
 Login Sign Up


| |||||
 |  | ||||

| 12Stocks.com Market Intelligence |
Best Nasdaq Stocks
|
On this page, you will find the most comprehensive analysis of Nasdaq 100 stocks and ETFs - from latest trends to performances to charts ➞. First, here are the year-to-date (YTD) performances of the most requested Nasdaq stocks at 12Stocks.com (click stock for review):
| Intel Corp 84% | ||
| Baidu 73% | ||
| NVIDIA Corp 37% | ||
| Netflix 30% | ||
| Google 29% | ||
| Microsoft 25% | ||
| Gilead 24% | ||
| Expedia 20% | ||
| AMGEN 17% | ||
| Tesla 13% | ||
| Qualcomm 12% | ||
| Apple 6% | ||
| Biogen 6% | ||
| Amazon.com 1% | ||
| Costco 1% | ||
| Starbucks Corp -5% | ||
| Comcast Corp -15% | ||
| Nasdaq 100 Stocks Lists: Performances & Trends, Nasdaq 100 Stock Charts
Sort Nasdaq 100 stocks: Daily, Weekly, Year-to-Date, Market Cap & Trends. |
| 12Stocks.com Nasdaq Stocks Performances & Trends Daily Report | |||||||||
|
| 
The overall Smart Investing & Trading Score is 100 (0-bearish to 100-bullish) which puts Nasdaq index in short term bullish trend. The Smart Investing & Trading Score from previous trading session is 90 and an improvement of trend continues. | ||||||||
Here are the Smart Investing & Trading Scores of the most requested Nasdaq 100 stocks at 12Stocks.com (click stock name for detailed review):
|


| 12Stocks.com: Top Performing Nasdaq 100 Index Stocks | ||||||||||||||||||||||||||||||||||||||||||||||||
 The top performing Nasdaq 100 Index stocks year to date are
Now, more recently, over last week, the top performing Nasdaq 100 Index stocks on the move are


|
||||||||||||||||||||||||||||||||||||||||||||||||
| 12Stocks.com: Investing in Nasdaq 100 Index with Stocks | |
|
The following table helps investors and traders sort through current performance and trends (as measured by Smart Investing & Trading Score) of various
stocks in the Nasdaq 100 Index. Quick View: Move mouse or cursor over stock symbol (ticker) to view short-term technical chart and over stock name to view long term chart. Click on  to add stock symbol to your watchlist and to add stock symbol to your watchlist and  to view watchlist. Click on any ticker or stock name for detailed market intelligence report for that stock. to view watchlist. Click on any ticker or stock name for detailed market intelligence report for that stock. |
12Stocks.com Performance of Stocks in Nasdaq 100 Index
| Ticker | Stock Name | Watchlist | Category | Recent Price | Smart Investing & Trading Score | Change % | YTD Change% |
| MCHP | Microchip |   | Technology | 67.61 | 100 | 2.24 | 20.68% |
| CHTR | Charter | | Technology | 274.60 | 40 | 1.85 | -21.40% |
| MDLZ | Mondelez | | Consumer Staples | 62.78 | 70 | 1.62 | 6.99% |
| CMCSA | Comcast Corp | | Technology | 30.89 | 30 | 1.61 | -15.23% |
| REGN | Regeneron | | Health Care | 609.51 | 100 | 1.59 | -14.54% |
| WDAY | Workday | | Technology | 235.80 | 80 | 1.59 | -6.37% |
| ODFL | Old Dominion | | Industrials | 142.82 | 60 | 1.58 | -18.46% |
| DDOG | Datadog | | Technology | 153.96 | 100 | 1.58 | 7.19% |
| ADI | Analog Devices | | Technology | 245.29 | 60 | 1.50 | 17.09% |
| AZN | Astrazeneca | | Health Care | 84.81 | 100 | 1.39 | 31.43% |
| TTWO | Take-Two Interactive | | Technology | 260.29 | 100 | 1.30 | 42.18% |
| GILD | Gilead | | Health Care | 111.96 | 40 | 1.27 | 23.58% |
| ON | ON Semiconductor | | Technology | 49.36 | 40 | 1.27 | -20.01% |
| GFS | GlobalFoundries | | Technology | 36.16 | 10 | 1.18 | -12.80% |
| XEL | Xcel Energy | | Utilities | 80.46 | 60 | 1.08 | 23.37% |
| NXPI | NXP Semiconductors | | Technology | 230.16 | 100 | 1.08 | 12.69% |
| TTD | Trade Desk | | Technology | 51.43 | 70 | 1.08 | -56.32% |
| FANG | Diamondback Energy | | Energy | 144.64 | 80 | 1.01 | -12.06% |
| ROP | Roper | | Technology | 502.48 | 50 | 0.98 | -1.76% |
| CDW | CDW Corp | | Technology | 160.94 | 50 | 0.95 | -4.70% |
| AVGO | Broadcom | | Technology | 341.36 | 70 | 0.94 | 47.95% |
| DXCM | Dexcom | | Health Care | 67.04 | 30 | 0.90 | -14.60% |
| CSX | CSX Corp | | Industrials | 35.88 | 80 | 0.87 | 12.49% |
| CDNS | Cadence Design | | Technology | 350.27 | 40 | 0.87 | 17.67% |
| CSGP | Costar | | Financials | 84.63 | 40 | 0.87 | 19.48% |
| AEP | American Electric | | Utilities | 114.38 | 90 | 0.81 | 27.74% |
| GEHC | GE HealthCare | | Health Care | 77.44 | 33 | 0.81 | -12.21% |
| CTSH | Cognizant | | Technology | 67.53 | 50 | 0.79 | -10.98% |
| MSFT | Microsoft | | Technology | 519.70 | 80 | 0.77 | 24.64% |
| FTNT | Fortinet | | Technology | 86.95 | 80 | 0.76 | -8.23% |
| For chart view version of above stock list: Chart View ➞ 0 - 30 , 30 - 60 , 60 - 90 , 90 - 120 | ||
 | Click To Change The Sort Order: By Market Cap or Company Size Performance: Year-to-date, Week and Day |  |
|
Get the most comprehensive stock market coverage daily at 12Stocks.com ➞ Best Stocks Today ➞ Best Stocks Weekly ➞ Best Stocks Year-to-Date ➞ Best Stocks Trends ➞  Best Stocks Today 12Stocks.com Best Dow Stocks ➞ Best S&P 500 Stocks ➞ Best Tech Stocks ➞ Best Biotech Stocks ➞ |
| Detailed Overview of Nasdaq 100 Stocks |
| Nasdaq 100 Technical Overview, Leaders & Laggards, Top Nasdaq 100 ETF Funds & Detailed Nasdaq 100 Stocks List, Charts, Trends & More |
| Nasdaq 100: Technical Analysis, Trends & YTD Performance | |
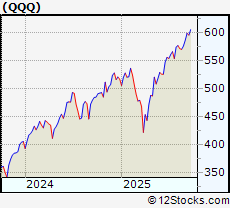
| Nasdaq 100 index as represented by
QQQ, an exchange-traded fund [ETF], holds basket of one hundred (mostly largecap) stocks from technology, biotech & retail sectors of the US stock market. The Nasdaq 100 index (contains stocks like Apple and Amgen) is up by 19.1474% and is currently outperforming the overall market by 3.8815% year-to-date. Below is a quick view of technical charts and trends: | |
 QQQ Weekly Chart |
|
| Long Term Trend: Very Good | |
| Medium Term Trend: Good | |
 QQQ Daily Chart |
|
| Short Term Trend: Very Good | |
| Overall Trend Score: 100 | |
| YTD Performance: 19.1474% | |
| **Trend Scores & Views Are Only For Educational Purposes And Not For Investing | |
| 12Stocks.com: Investing in Nasdaq 100 Index using Exchange Traded Funds | |
|
The following table shows list of key exchange traded funds (ETF) that
help investors track Nasdaq 100 index. The following list also includes leveraged ETF funds that track twice or thrice the daily returns of Nasdaq 100 indices. Short or inverse ETF funds move in the opposite direction to the index they track and are useful during market pullbacks or during bear markets. Quick View: Move mouse or cursor over ETF symbol (ticker) to view short-term technical chart and over ETF name to view long term chart. Click on ticker or stock name for detailed view. Click on to add stock symbol to your watchlist and to view watchlist. |
12Stocks.com List of ETFs that track Nasdaq 100 Index
| Ticker | ETF Name | Watchlist | Recent Price | Smart Investing & Trading Score | Change % | Week % | Year-to-date % |
| SQQQ | ProShares UltraPro Short QQQ -3x Shares | | 14.82 | 20 | -0.134771 | -5.84498 | -51.4315% |
| TQQQ | ProShares UltraPro QQQ 3x Shares | | 106.39 | 100 | 0.235538 | 6.33683 | 36.0836% |
| QQQ | Invesco QQQ Trust Series 1 | | 606.34 | 100 | 0.100705 | 2.15827 | 19.1474% |
| QID | ProShares UltraShort QQQ -2x Shares | | 21.14 | 10 | -0.094518 | -3.86539 | -34.2375% |
| QYLD | Global X NASDAQ 100 Covered Call ETF | | 17.05 | 90 | 0.235156 | 0.887574 | 0.474973% |
| QLD | ProShares Ultra QQQ 2x Shares | | 139.93 | 100 | 0.207677 | 4.24644 | 30.0308% |
| QQQE | Direxion NASDAQ-100 Equal Weighted Index Shares | | 102.73 | 100 | 0.538266 | 1.83386 | 14.7481% |
| QQQX | Nuveen NASDAQ 100 Dynamic Overwrite Fund | | 27.58 | 80 | 0.436999 | 0.327392 | 7.36698% |
| QTEC | First Trust NASDAQ-100 Technology Sector Index Fund | | 233.92 | 100 | 1.05845 | 2.93962 | 24.0218% |
| QQEW | First Trust NASDAQ-100 Equal Weighted Index Fund | | 143.24 | 100 | 0.294076 | 2.92448 | 14.8797% |
| QQXT | First Trust Nasdaq-100 Ex-Technology Sector Index Fund | | 99.34 | 90 | 0.147085 | 0.955285 | 7.21494% |
| 12Stocks.com: Charts, Trends, Fundamental Data and Performances of Nasdaq 100 Stocks | |
|
We now take in-depth look at all Nasdaq 100 stocks including charts, multi-period performances and overall trends (as measured by Smart Investing & Trading Score). One can sort Nasdaq 100 stocks (click link to choose) by Daily, Weekly and by Year-to-Date performances. Also, one can sort by size of the company or by market capitalization. |
| Select Your Default Chart Type: | |||||
| |||||
| Click on stock symbol or name for detailed view. Click on to add stock symbol to your watchlist and to view watchlist. Quick View: Move mouse or cursor over "Daily" to quickly view daily technical stock chart and over "Weekly" to view weekly technical stock chart. | |||||

 | MCHP Microchip Technology, Inc |
| Sector: Technology | |
| SubSector: Semiconductors | |
| MarketCap: 35575.7 Millions | |
| Recent Price: 67.61 Smart Investing & Trading Score: 100 | |
| Day Percent Change: 2.23802% Day Change: 1.48 | |
| Week Change: 4.27205% Year-to-date Change: 20.7% | |
| MCHP Links: Profile News Message Board | |
| Charts:- Daily , Weekly | |
| Add MCHP to Watchlist: View: Get Complete MCHP Trend Analysis ➞ | |
 | CHTR Charter Communications Inc |
| Sector: Technology | |
| SubSector: Telecom Services | |
| MarketCap: 39864.3 Millions | |
| Recent Price: 274.60 Smart Investing & Trading Score: 40 | |
| Day Percent Change: 1.85082% Day Change: 4.99 | |
| Week Change: 1.48945% Year-to-date Change: -21.4% | |
| CHTR Links: Profile News Message Board | |
| Charts:- Daily , Weekly | |
| Add CHTR to Watchlist: View: Get Complete CHTR Trend Analysis ➞ | |
 | MDLZ Mondelez International Inc |
| Sector: Consumer Staples | |
| SubSector: Confectioners | |
| MarketCap: 79888.2 Millions | |
| Recent Price: 62.78 Smart Investing & Trading Score: 70 | |
| Day Percent Change: 1.61865% Day Change: 1 | |
| Week Change: 0.351662% Year-to-date Change: 7.0% | |
| MDLZ Links: Profile News Message Board | |
| Charts:- Daily , Weekly | |
| Add MDLZ to Watchlist: View: Get Complete MDLZ Trend Analysis ➞ | |
 | CMCSA Comcast Corp |
| Sector: Technology | |
| SubSector: Telecom Services | |
| MarketCap: 125203 Millions | |
| Recent Price: 30.89 Smart Investing & Trading Score: 30 | |
| Day Percent Change: 1.61184% Day Change: 0.49 | |
| Week Change: -2.30867% Year-to-date Change: -15.2% | |
| CMCSA Links: Profile News Message Board | |
| Charts:- Daily , Weekly | |
| Add CMCSA to Watchlist: View: Get Complete CMCSA Trend Analysis ➞ | |
 | REGN Regeneron Pharmaceuticals, Inc |
| Sector: Health Care | |
| SubSector: Biotechnology | |
| MarketCap: 60771.1 Millions | |
| Recent Price: 609.51 Smart Investing & Trading Score: 100 | |
| Day Percent Change: 1.585% Day Change: 9.51 | |
| Week Change: 9.7208% Year-to-date Change: -14.5% | |
| REGN Links: Profile News Message Board | |
| Charts:- Daily , Weekly | |
| Add REGN to Watchlist: View: Get Complete REGN Trend Analysis ➞ | |
 | WDAY Workday Inc |
| Sector: Technology | |
| SubSector: Software - Application | |
| MarketCap: 61698.4 Millions | |
| Recent Price: 235.80 Smart Investing & Trading Score: 80 | |
| Day Percent Change: 1.59414% Day Change: 3.7 | |
| Week Change: -2.86303% Year-to-date Change: -6.4% | |
| WDAY Links: Profile News Message Board | |
| Charts:- Daily , Weekly | |
| Add WDAY to Watchlist: View: Get Complete WDAY Trend Analysis ➞ | |
 | ODFL Old Dominion Freight Line, Inc |
| Sector: Industrials | |
| SubSector: Trucking | |
| MarketCap: 31674.4 Millions | |
| Recent Price: 142.82 Smart Investing & Trading Score: 60 | |
| Day Percent Change: 1.57895% Day Change: 2.22 | |
| Week Change: 1.70192% Year-to-date Change: -18.5% | |
| ODFL Links: Profile News Message Board | |
| Charts:- Daily , Weekly | |
| Add ODFL to Watchlist: View: Get Complete ODFL Trend Analysis ➞ | |
 | DDOG Datadog Inc |
| Sector: Technology | |
| SubSector: Software - Application | |
| MarketCap: 47457.2 Millions | |
| Recent Price: 153.96 Smart Investing & Trading Score: 100 | |
| Day Percent Change: 1.57683% Day Change: 2.39 | |
| Week Change: 12.7086% Year-to-date Change: 7.2% | |
| DDOG Links: Profile News Message Board | |
| Charts:- Daily , Weekly | |
| Add DDOG to Watchlist: View: Get Complete DDOG Trend Analysis ➞ | |
 | ADI Analog Devices Inc |
| Sector: Technology | |
| SubSector: Semiconductors | |
| MarketCap: 121547 Millions | |
| Recent Price: 245.29 Smart Investing & Trading Score: 60 | |
| Day Percent Change: 1.49791% Day Change: 3.62 | |
| Week Change: -0.904941% Year-to-date Change: 17.1% | |
| ADI Links: Profile News Message Board | |
| Charts:- Daily , Weekly | |
| Add ADI to Watchlist: View: Get Complete ADI Trend Analysis ➞ | |
 | AZN Astrazeneca plc ADR |
| Sector: Health Care | |
| SubSector: Drug Manufacturers - General | |
| MarketCap: 253309 Millions | |
| Recent Price: 84.81 Smart Investing & Trading Score: 100 | |
| Day Percent Change: 1.38673% Day Change: 1.16 | |
| Week Change: 15.3407% Year-to-date Change: 31.4% | |
| AZN Links: Profile News Message Board | |
| Charts:- Daily , Weekly | |
| Add AZN to Watchlist: View: Get Complete AZN Trend Analysis ➞ | |
 | TTWO Take-Two Interactive Software, Inc |
| Sector: Technology | |
| SubSector: Electronic Gaming & Multimedia | |
| MarketCap: 44213.8 Millions | |
| Recent Price: 260.29 Smart Investing & Trading Score: 100 | |
| Day Percent Change: 1.30381% Day Change: 3.35 | |
| Week Change: 6.19314% Year-to-date Change: 42.2% | |
| TTWO Links: Profile News Message Board | |
| Charts:- Daily , Weekly | |
| Add TTWO to Watchlist: View: Get Complete TTWO Trend Analysis ➞ | |
 | GILD Gilead Sciences, Inc |
| Sector: Health Care | |
| SubSector: Drug Manufacturers - General | |
| MarketCap: 142755 Millions | |
| Recent Price: 111.96 Smart Investing & Trading Score: 40 | |
| Day Percent Change: 1.26628% Day Change: 1.4 | |
| Week Change: 0.873953% Year-to-date Change: 23.6% | |
| GILD Links: Profile News Message Board | |
| Charts:- Daily , Weekly | |
| Add GILD to Watchlist: View: Get Complete GILD Trend Analysis ➞ | |
 | ON ON Semiconductor Corp |
| Sector: Technology | |
| SubSector: Semiconductors | |
| MarketCap: 20082.7 Millions | |
| Recent Price: 49.36 Smart Investing & Trading Score: 40 | |
| Day Percent Change: 1.27206% Day Change: 0.62 | |
| Week Change: -0.823789% Year-to-date Change: -20.0% | |
| ON Links: Profile News Message Board | |
| Charts:- Daily , Weekly | |
| Add ON to Watchlist: View: Get Complete ON Trend Analysis ➞ | |
 | GFS GlobalFoundries Inc |
| Sector: Technology | |
| SubSector: Semiconductors | |
| MarketCap: 18406.5 Millions | |
| Recent Price: 36.16 Smart Investing & Trading Score: 10 | |
| Day Percent Change: 1.18% Day Change: 0.42 | |
| Week Change: 1.6% Year-to-date Change: -12.8% | |
| GFS Links: Profile News Message Board | |
| Charts:- Daily , Weekly | |
| Add GFS to Watchlist: View: Get Complete GFS Trend Analysis ➞ | |
 | XEL Xcel Energy, Inc |
| Sector: Utilities | |
| SubSector: Utilities - Regulated Electric | |
| MarketCap: 42984.9 Millions | |
| Recent Price: 80.46 Smart Investing & Trading Score: 60 | |
| Day Percent Change: 1.0804% Day Change: 0.86 | |
| Week Change: 4.15534% Year-to-date Change: 23.4% | |
| XEL Links: Profile News Message Board | |
| Charts:- Daily , Weekly | |
| Add XEL to Watchlist: View: Get Complete XEL Trend Analysis ➞ | |
 | NXPI NXP Semiconductors NV |
| Sector: Technology | |
| SubSector: Semiconductors | |
| MarketCap: 57164.5 Millions | |
| Recent Price: 230.16 Smart Investing & Trading Score: 100 | |
| Day Percent Change: 1.07815% Day Change: 2.45 | |
| Week Change: 1.47701% Year-to-date Change: 12.7% | |
| NXPI Links: Profile News Message Board | |
| Charts:- Daily , Weekly | |
| Add NXPI to Watchlist: View: Get Complete NXPI Trend Analysis ➞ | |
 | TTD Trade Desk Inc |
| Sector: Technology | |
| SubSector: Advertising Agencies | |
| MarketCap: 25459.3 Millions | |
| Recent Price: 51.43 Smart Investing & Trading Score: 70 | |
| Day Percent Change: 1.08097% Day Change: 0.55 | |
| Week Change: 9.98717% Year-to-date Change: -56.3% | |
| TTD Links: Profile News Message Board | |
| Charts:- Daily , Weekly | |
| Add TTD to Watchlist: View: Get Complete TTD Trend Analysis ➞ | |
 | FANG Diamondback Energy Inc |
| Sector: Energy | |
| SubSector: Oil & Gas E&P | |
| MarketCap: 40154.6 Millions | |
| Recent Price: 144.64 Smart Investing & Trading Score: 80 | |
| Day Percent Change: 1.01264% Day Change: 1.45 | |
| Week Change: -0.788806% Year-to-date Change: -12.1% | |
| FANG Links: Profile News Message Board | |
| Charts:- Daily , Weekly | |
| Add FANG to Watchlist: View: Get Complete FANG Trend Analysis ➞ | |
 | ROP Roper Technologies Inc |
| Sector: Technology | |
| SubSector: Software - Application | |
| MarketCap: 55791.3 Millions | |
| Recent Price: 502.48 Smart Investing & Trading Score: 50 | |
| Day Percent Change: 0.982737% Day Change: 4.89 | |
| Week Change: 1.50496% Year-to-date Change: -1.8% | |
| ROP Links: Profile News Message Board | |
| Charts:- Daily , Weekly | |
| Add ROP to Watchlist: View: Get Complete ROP Trend Analysis ➞ | |
 | CDW CDW Corp |
| Sector: Technology | |
| SubSector: Information Technology Services | |
| MarketCap: 22244.9 Millions | |
| Recent Price: 160.94 Smart Investing & Trading Score: 50 | |
| Day Percent Change: 0.953456% Day Change: 1.52 | |
| Week Change: 2.52915% Year-to-date Change: -4.7% | |
| CDW Links: Profile News Message Board | |
| Charts:- Daily , Weekly | |
| Add CDW to Watchlist: View: Get Complete CDW Trend Analysis ➞ | |
 | AVGO Broadcom Inc |
| Sector: Technology | |
| SubSector: Semiconductors | |
| MarketCap: 1575150 Millions | |
| Recent Price: 341.36 Smart Investing & Trading Score: 70 | |
| Day Percent Change: 0.940328% Day Change: 3.18 | |
| Week Change: 1.56501% Year-to-date Change: 47.9% | |
| AVGO Links: Profile News Message Board | |
| Charts:- Daily , Weekly | |
| Add AVGO to Watchlist: View: Get Complete AVGO Trend Analysis ➞ | |
 | DXCM Dexcom Inc |
| Sector: Health Care | |
| SubSector: Medical Devices | |
| MarketCap: 31572.4 Millions | |
| Recent Price: 67.04 Smart Investing & Trading Score: 30 | |
| Day Percent Change: 0.90307% Day Change: 0.6 | |
| Week Change: -1.8448% Year-to-date Change: -14.6% | |
| DXCM Links: Profile News Message Board | |
| Charts:- Daily , Weekly | |
| Add DXCM to Watchlist: View: Get Complete DXCM Trend Analysis ➞ | |
 | CSX CSX Corp |
| Sector: Industrials | |
| SubSector: Railroads | |
| MarketCap: 60644.9 Millions | |
| Recent Price: 35.88 Smart Investing & Trading Score: 80 | |
| Day Percent Change: 0.871521% Day Change: 0.31 | |
| Week Change: 6.2167% Year-to-date Change: 12.5% | |
| CSX Links: Profile News Message Board | |
| Charts:- Daily , Weekly | |
| Add CSX to Watchlist: View: Get Complete CSX Trend Analysis ➞ | |
 | CDNS Cadence Design Systems, Inc |
| Sector: Technology | |
| SubSector: Software - Application | |
| MarketCap: 95646.7 Millions | |
| Recent Price: 350.27 Smart Investing & Trading Score: 40 | |
| Day Percent Change: 0.872595% Day Change: 3.03 | |
| Week Change: -0.225033% Year-to-date Change: 17.7% | |
| CDNS Links: Profile News Message Board | |
| Charts:- Daily , Weekly | |
| Add CDNS to Watchlist: View: Get Complete CDNS Trend Analysis ➞ | |
 | CSGP Costar Group, Inc |
| Sector: Financials | |
| SubSector: Real Estate Services | |
| MarketCap: 37899.8 Millions | |
| Recent Price: 84.63 Smart Investing & Trading Score: 40 | |
| Day Percent Change: 0.870083% Day Change: 0.73 | |
| Week Change: 1.85341% Year-to-date Change: 19.5% | |
| CSGP Links: Profile News Message Board | |
| Charts:- Daily , Weekly | |
| Add CSGP to Watchlist: View: Get Complete CSGP Trend Analysis ➞ | |
 | AEP American Electric Power Company Inc |
| Sector: Utilities | |
| SubSector: Utilities - Regulated Electric | |
| MarketCap: 57816.7 Millions | |
| Recent Price: 114.38 Smart Investing & Trading Score: 90 | |
| Day Percent Change: 0.810858% Day Change: 0.92 | |
| Week Change: 6.04487% Year-to-date Change: 27.7% | |
| AEP Links: Profile News Message Board | |
| Charts:- Daily , Weekly | |
| Add AEP to Watchlist: View: Get Complete AEP Trend Analysis ➞ | |
 | GEHC GE HealthCare Technologies Inc |
| Sector: Health Care | |
| SubSector: Medical Devices | |
| MarketCap: 34575.4 Millions | |
| Recent Price: 77.44 Smart Investing & Trading Score: 33 | |
| Day Percent Change: 0.81% Day Change: 0.62 | |
| Week Change: 6.87% Year-to-date Change: -12.2% | |
| GEHC Links: Profile News Message Board | |
| Charts:- Daily , Weekly | |
| Add GEHC to Watchlist: View: Get Complete GEHC Trend Analysis ➞ | |
 | CTSH Cognizant Technology Solutions Corp |
| Sector: Technology | |
| SubSector: Information Technology Services | |
| MarketCap: 35076.6 Millions | |
| Recent Price: 67.53 Smart Investing & Trading Score: 50 | |
| Day Percent Change: 0.791045% Day Change: 0.53 | |
| Week Change: 1.28994% Year-to-date Change: -11.0% | |
| CTSH Links: Profile News Message Board | |
| Charts:- Daily , Weekly | |
| Add CTSH to Watchlist: View: Get Complete CTSH Trend Analysis ➞ | |
 | MSFT Microsoft Corporation |
| Sector: Technology | |
| SubSector: Software - Infrastructure | |
| MarketCap: 3679420 Millions | |
| Recent Price: 519.70 Smart Investing & Trading Score: 80 | |
| Day Percent Change: 0.767829% Day Change: 3.96 | |
| Week Change: 2.49887% Year-to-date Change: 24.6% | |
| MSFT Links: Profile News Message Board | |
| Charts:- Daily , Weekly | |
| Add MSFT to Watchlist: View: Get Complete MSFT Trend Analysis ➞ | |
 | FTNT Fortinet Inc |
| Sector: Technology | |
| SubSector: Software - Infrastructure | |
| MarketCap: 60404.8 Millions | |
| Recent Price: 86.95 Smart Investing & Trading Score: 80 | |
| Day Percent Change: 0.764863% Day Change: 0.66 | |
| Week Change: 4.49465% Year-to-date Change: -8.2% | |
| FTNT Links: Profile News Message Board | |
| Charts:- Daily , Weekly | |
| Add FTNT to Watchlist: View: Get Complete FTNT Trend Analysis ➞ | |
| For tabular summary view of above stock list: Summary View ➞ 0 - 30 , 30 - 60 , 60 - 90 , 90 - 120 | ||
| Click To Change The Sort Order: By Market Cap or Company Size Performance: Year-to-date, Week and Day | |
| Select Chart Type: | ||
|
Best Stocks Today 12Stocks.com |
© 2025 12Stocks.com Terms & Conditions Privacy Contact Us
All Information Provided Only For Education And Not To Be Used For Investing or Trading. See Terms & Conditions


One More Thing ... Get Best Stocks Delivered Daily!
Never Ever Miss A Move With Our Top Ten Stocks Lists
Find Best Stocks In Any Market - Bull or Bear Market
Take A Peek At Our Top Ten Stocks Lists: Daily, Weekly, Year-to-Date & Top Trends
Find Best Stocks In Any Market - Bull or Bear Market
Take A Peek At Our Top Ten Stocks Lists: Daily, Weekly, Year-to-Date & Top Trends
Nasdaq 100 Stocks With Best Up Trends [0-bearish to 100-bullish]: Constellation Energy[100], Sirius XM[100], Micron [100], Biogen [100], Microchip [100], Regeneron [100], Datadog [100], Astrazeneca [100], Take-Two Interactive[100], NXP Semiconductors[100], SPDR S&P[100]
Best Nasdaq 100 Stocks Year-to-Date:
Micron [119.007%], Lam Research[104.226%], Warner Bros.[84.96%], Intel Corp[84.3719%], KLA Corp[76.399%], Zscaler [68.2264%], DoorDash [58.9804%], Constellation Energy[55.3778%], Idexx [54.6264%], ASML Holding[48.6555%], Broadcom [47.9453%] Best Nasdaq 100 Stocks This Week:
Micron [21.6795%], Electronic Arts[19.3916%], Biogen [17.3436%], Astrazeneca [15.3407%], Constellation Energy[15.1381%], Lam Research[14.8287%], Moderna [13.8562%], Datadog [12.7086%], AMGEN [9.99705%], Trade Desk[9.98717%], Regeneron [9.7208%] Best Nasdaq 100 Stocks Daily:
Constellation Energy[5.11106%], Sirius XM[4.11504%], Micron [3.85306%], Intuitive Surgical[2.62071%], Biogen [2.54428%], Microchip [2.23802%], Charter [1.85082%], Mondelez [1.61865%], Comcast Corp[1.61184%], Regeneron [1.585%], Workday [1.59414%]