
 Login Sign Up


| |||||
 |  | ||||

| 12Stocks.com Market Intelligence |
Best Nasdaq Stocks
|
On this page, you will find the most comprehensive analysis of Nasdaq 100 stocks and ETFs - from latest trends to performances to charts ➞. First, here are the year-to-date (YTD) performances of the most requested Nasdaq stocks at 12Stocks.com (click stock for review):
| Intel Corp 84% | ||
| Baidu 70% | ||
| NVIDIA Corp 37% | ||
| Netflix 31% | ||
| Google 30% | ||
| Microsoft 24% | ||
| Gilead 22% | ||
| Expedia 18% | ||
| AMGEN 17% | ||
| Tesla 15% | ||
| Qualcomm 11% | ||
| Apple 6% | ||
| Biogen 4% | ||
| Costco 1% | ||
| Amazon.com 1% | ||
| Starbucks Corp -5% | ||
| Comcast Corp -17% | ||
| Nasdaq 100 Stocks Lists: Performances & Trends, Nasdaq 100 Stock Charts
Sort Nasdaq 100 stocks: Daily, Weekly, Year-to-Date, Market Cap & Trends. |
| 12Stocks.com Nasdaq Stocks Performances & Trends Daily Report | |||||||||
|
| 
The overall Smart Investing & Trading Score is 100 (0-bearish to 100-bullish) which puts Nasdaq index in short term bullish trend. The Smart Investing & Trading Score from previous trading session is 90 and an improvement of trend continues. | ||||||||
Here are the Smart Investing & Trading Scores of the most requested Nasdaq 100 stocks at 12Stocks.com (click stock name for detailed review):
|


| 12Stocks.com: Top Performing Nasdaq 100 Index Stocks | ||||||||||||||||||||||||||||||||||||||||||||||||
 The top performing Nasdaq 100 Index stocks year to date are
Now, more recently, over last week, the top performing Nasdaq 100 Index stocks on the move are


|
||||||||||||||||||||||||||||||||||||||||||||||||
| 12Stocks.com: Investing in Nasdaq 100 Index with Stocks | |
|
The following table helps investors and traders sort through current performance and trends (as measured by Smart Investing & Trading Score) of various
stocks in the Nasdaq 100 Index. Quick View: Move mouse or cursor over stock symbol (ticker) to view short-term technical chart and over stock name to view long term chart. Click on  to add stock symbol to your watchlist and to add stock symbol to your watchlist and  to view watchlist. Click on any ticker or stock name for detailed market intelligence report for that stock. to view watchlist. Click on any ticker or stock name for detailed market intelligence report for that stock. |
12Stocks.com Performance of Stocks in Nasdaq 100 Index
| Ticker | Stock Name | Watchlist | Category | Recent Price | Smart Investing & Trading Score | Change % | YTD Change% |
| AEP | American Electric |   | Utilities | 113.47 | 90 | 0.64% | 26.72% |
| SPY | SPDR S&P | | Financials | 669.22 | 90 | 0.12% | 15.15% |
| SBUX | Starbucks Corp | | Services & Goods | 86.73 | 80 | 2.76% | -4.73% |
| MDB | MongoDB | | Technology | 326.29 | 80 | 1.48% | 33.39% |
| FTNT | Fortinet | | Technology | 86.30 | 80 | 1.32% | -8.92% |
| NXPI | NXP Semiconductors | | Technology | 227.79 | 80 | 1.28% | 11.53% |
| VRTX | Vertex | | Health Care | 408.85 | 80 | 1.15% | 0.76% |
| GOOG | | Technology | 246.43 | 80 | 0.36% | 29.57% | |
| GOOGL | | Technology | 245.74 | 80 | 0.34% | 30.03% | |
| CRWD | Crowdstrike | | Technology | 496.80 | 80 | -0.63% | 43.03% |
| PYPL | PayPal | | Financials | 68.93 | 70 | 3.41% | -20.02% |
| TTD | Trade Desk | | Technology | 50.89 | 70 | 3.18% | -56.77% |
| MCHP | Microchip | | Technology | 66.13 | 70 | 3.15% | 18.04% |
| CSX | CSX Corp | | Industrials | 35.58 | 70 | 1.64% | 11.53% |
| AVGO | Broadcom | | Technology | 338.18 | 70 | 1.44% | 46.57% |
| AAPL | Apple | | Technology | 257.13 | 70 | 0.66% | 5.82% |
| PEP | PepsiCo | | Consumer Staples | 142.31 | 70 | -0.58% | -3.37% |
| CSCO | Cisco | | Technology | 68.31 | 70 | -0.64% | 17.85% |
| ADSK | Autodesk | | Technology | 320.91 | 60 | 1.64% | 9.41% |
| HON | Honeywell | | Industrials | 210.96 | 60 | 0.37% | -5.47% |
| EXC | Exelon Corp | | Utilities | 44.97 | 60 | -0.20% | 22.68% |
| FANG | Diamondback Energy | | Energy | 143.19 | 60 | -0.24% | -12.94% |
| EA | Electronic Arts | | Technology | 201.00 | 60 | -0.31% | 38.14% |
| MSFT | Microsoft | | Technology | 515.74 | 60 | -0.76% | 23.69% |
| XEL | Xcel Energy | | Utilities | 79.59 | 60 | -0.90% | 22.04% |
| ILMN | Illumina | | Health Care | 99.30 | 60 | -2.89% | -24.16% |
| TSLA | Tesla | | Services & Goods | 435.91 | 60 | -5.13% | 14.93% |
| ADBE | Adobe | | Technology | 351.55 | 50 | 2.28% | -20.28% |
| MAR | Marriott | | Services & Goods | 266.40 | 50 | 1.81% | -2.47% |
| PCAR | Paccar | | Industrials | 99.09 | 50 | 1.41% | -3.56% |
| For chart view version of above stock list: Chart View ➞ 0 - 30 , 30 - 60 , 60 - 90 , 90 - 120 | ||
 | Click To Change The Sort Order: By Market Cap or Company Size Performance: Year-to-date, Week and Day |  |
|
Get the most comprehensive stock market coverage daily at 12Stocks.com ➞ Best Stocks Today ➞ Best Stocks Weekly ➞ Best Stocks Year-to-Date ➞ Best Stocks Trends ➞  Best Stocks Today 12Stocks.com Best Dow Stocks ➞ Best S&P 500 Stocks ➞ Best Tech Stocks ➞ Best Biotech Stocks ➞ |
| Detailed Overview of Nasdaq 100 Stocks |
| Nasdaq 100 Technical Overview, Leaders & Laggards, Top Nasdaq 100 ETF Funds & Detailed Nasdaq 100 Stocks List, Charts, Trends & More |
| Nasdaq 100: Technical Analysis, Trends & YTD Performance | |
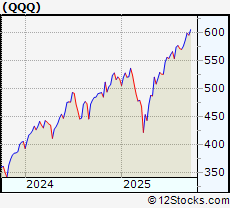
| Nasdaq 100 index as represented by
QQQ, an exchange-traded fund [ETF], holds basket of one hundred (mostly largecap) stocks from technology, biotech & retail sectors of the US stock market. The Nasdaq 100 index (contains stocks like Apple and Amgen) is up by 19.0275% and is currently outperforming the overall market by 4.2696% year-to-date. Below is a quick view of technical charts and trends: | |
 QQQ Weekly Chart |
|
| Long Term Trend: Very Good | |
| Medium Term Trend: Good | |
 QQQ Daily Chart |
|
| Short Term Trend: Very Good | |
| Overall Trend Score: 100 | |
| YTD Performance: 19.0275% | |
| **Trend Scores & Views Are Only For Educational Purposes And Not For Investing | |
| 12Stocks.com: Investing in Nasdaq 100 Index using Exchange Traded Funds | |
|
The following table shows list of key exchange traded funds (ETF) that
help investors track Nasdaq 100 index. The following list also includes leveraged ETF funds that track twice or thrice the daily returns of Nasdaq 100 indices. Short or inverse ETF funds move in the opposite direction to the index they track and are useful during market pullbacks or during bear markets. Quick View: Move mouse or cursor over ETF symbol (ticker) to view short-term technical chart and over ETF name to view long term chart. Click on ticker or stock name for detailed view. Click on to add stock symbol to your watchlist and to view watchlist. |
12Stocks.com List of ETFs that track Nasdaq 100 Index
| Ticker | ETF Name | Watchlist | Recent Price | Smart Investing & Trading Score | Change % | Week % | Year-to-date % |
| SQQQ | ProShares UltraPro Short QQQ -3x Shares | | 14.84 | 10 | -1.13324 | -4.44366 | -51.3663% |
| TQQQ | ProShares UltraPro QQQ 3x Shares | | 106.18 | 100 | 1.25977 | 4.70466 | 35.8162% |
| QQQ | Invesco QQQ Trust Series 1 | | 605.73 | 100 | 0.411106 | 1.6155 | 19.0275% |
| QID | ProShares UltraShort QQQ -2x Shares | | 21.16 | 0 | -0.797 | -2.93578 | -34.1753% |
| QYLD | Global X NASDAQ 100 Covered Call ETF | | 17.05 | 90 | 0.235156 | 0.887574 | 0.474973% |
| QLD | ProShares Ultra QQQ 2x Shares | | 139.64 | 100 | 0.808547 | 3.09339 | 29.7613% |
| QQQE | Direxion NASDAQ-100 Equal Weighted Index Shares | | 102.73 | 100 | 0.538266 | 1.83386 | 14.7481% |
| QQQX | Nuveen NASDAQ 100 Dynamic Overwrite Fund | | 27.58 | 80 | 0.436999 | 0.327392 | 7.36698% |
| QQEW | First Trust NASDAQ-100 Equal Weighted Index Fund | | 142.82 | 100 | 0.662532 | 1.99826 | 14.5428% |
| QTEC | First Trust NASDAQ-100 Technology Sector Index Fund | | 233.92 | 100 | 1.05845 | 2.93962 | 24.0218% |
| QQXT | First Trust Nasdaq-100 Ex-Technology Sector Index Fund | | 99.34 | 90 | 0.147085 | 0.955285 | 7.21494% |
| 12Stocks.com: Charts, Trends, Fundamental Data and Performances of Nasdaq 100 Stocks | |
|
We now take in-depth look at all Nasdaq 100 stocks including charts, multi-period performances and overall trends (as measured by Smart Investing & Trading Score). One can sort Nasdaq 100 stocks (click link to choose) by Daily, Weekly and by Year-to-Date performances. Also, one can sort by size of the company or by market capitalization. |
| Select Your Default Chart Type: | |||||
| |||||
| Click on stock symbol or name for detailed view. Click on to add stock symbol to your watchlist and to view watchlist. Quick View: Move mouse or cursor over "Daily" to quickly view daily technical stock chart and over "Weekly" to view weekly technical stock chart. | |||||

 | AEP American Electric Power Company Inc |
| Sector: Utilities | |
| SubSector: Utilities - Regulated Electric | |
| MarketCap: 57816.7 Millions | |
| Recent Price: 113.47 Smart Investing & Trading Score: 90 | |
| Day Percent Change: 0.638581% Day Change: 1.01 | |
| Week Change: 4.21565% Year-to-date Change: 26.7% | |
| AEP Links: Profile News Message Board | |
| Charts:- Daily , Weekly | |
| Add AEP to Watchlist: View: Get Complete AEP Trend Analysis ➞ | |
 | SPY SPDR S&P 500 ETF Trust |
| Sector: Financials | |
| SubSector: Exchange Traded Fund | |
| MarketCap: Millions | |
| Recent Price: 669.22 Smart Investing & Trading Score: 90 | |
| Day Percent Change: 0.115192% Day Change: 1.12 | |
| Week Change: 1.22826% Year-to-date Change: 15.2% | |
| SPY Links: Profile News Message Board | |
| Charts:- Daily , Weekly | |
| Add SPY to Watchlist: View: Get Complete SPY Trend Analysis ➞ | |
 | SBUX Starbucks Corp |
| Sector: Services & Goods | |
| SubSector: Restaurants | |
| MarketCap: 97108.3 Millions | |
| Recent Price: 86.73 Smart Investing & Trading Score: 80 | |
| Day Percent Change: 2.76066% Day Change: 2.34 | |
| Week Change: 2.91919% Year-to-date Change: -4.7% | |
| SBUX Links: Profile News Message Board | |
| Charts:- Daily , Weekly | |
| Add SBUX to Watchlist: View: Get Complete SBUX Trend Analysis ➞ | |
 | MDB MongoDB Inc |
| Sector: Technology | |
| SubSector: Software - Infrastructure | |
| MarketCap: 26419.8 Millions | |
| Recent Price: 326.29 Smart Investing & Trading Score: 80 | |
| Day Percent Change: 1.48042% Day Change: 4.09 | |
| Week Change: 3.48557% Year-to-date Change: 33.4% | |
| MDB Links: Profile News Message Board | |
| Charts:- Daily , Weekly | |
| Add MDB to Watchlist: View: Get Complete MDB Trend Analysis ➞ | |
 | FTNT Fortinet Inc |
| Sector: Technology | |
| SubSector: Software - Infrastructure | |
| MarketCap: 60404.8 Millions | |
| Recent Price: 86.30 Smart Investing & Trading Score: 80 | |
| Day Percent Change: 1.31604% Day Change: 0.78 | |
| Week Change: 3.23086% Year-to-date Change: -8.9% | |
| FTNT Links: Profile News Message Board | |
| Charts:- Daily , Weekly | |
| Add FTNT to Watchlist: View: Get Complete FTNT Trend Analysis ➞ | |
 | NXPI NXP Semiconductors NV |
| Sector: Technology | |
| SubSector: Semiconductors | |
| MarketCap: 57164.5 Millions | |
| Recent Price: 227.79 Smart Investing & Trading Score: 80 | |
| Day Percent Change: 1.28051% Day Change: 3.65 | |
| Week Change: 0.0571027% Year-to-date Change: 11.5% | |
| NXPI Links: Profile News Message Board | |
| Charts:- Daily , Weekly | |
| Add NXPI to Watchlist: View: Get Complete NXPI Trend Analysis ➞ | |
 | VRTX Vertex Pharmaceuticals, Inc |
| Sector: Health Care | |
| SubSector: Biotechnology | |
| MarketCap: 101561 Millions | |
| Recent Price: 408.85 Smart Investing & Trading Score: 80 | |
| Day Percent Change: 1.14792% Day Change: 3.2 | |
| Week Change: 8.5577% Year-to-date Change: 0.8% | |
| VRTX Links: Profile News Message Board | |
| Charts:- Daily , Weekly | |
| Add VRTX to Watchlist: View: Get Complete VRTX Trend Analysis ➞ | |
 | GOOG Alphabet Inc |
| Sector: Technology | |
| SubSector: Internet Content & Information | |
| MarketCap: 2843010 Millions | |
| Recent Price: 246.43 Smart Investing & Trading Score: 80 | |
| Day Percent Change: 0.362466% Day Change: -0.56 | |
| Week Change: -0.564903% Year-to-date Change: 29.6% | |
| GOOG Links: Profile News Message Board | |
| Charts:- Daily , Weekly | |
| Add GOOG to Watchlist: View: Get Complete GOOG Trend Analysis ➞ | |
 | GOOGL Alphabet Inc |
| Sector: Technology | |
| SubSector: Internet Content & Information | |
| MarketCap: 2843010 Millions | |
| Recent Price: 245.74 Smart Investing & Trading Score: 80 | |
| Day Percent Change: 0.342997% Day Change: -0.59 | |
| Week Change: -0.566481% Year-to-date Change: 30.0% | |
| GOOGL Links: Profile News Message Board | |
| Charts:- Daily , Weekly | |
| Add GOOGL to Watchlist: View: Get Complete GOOGL Trend Analysis ➞ | |
 | CRWD Crowdstrike Holdings Inc |
| Sector: Technology | |
| SubSector: Software - Infrastructure | |
| MarketCap: 104806 Millions | |
| Recent Price: 496.80 Smart Investing & Trading Score: 80 | |
| Day Percent Change: -0.632051% Day Change: -3.35 | |
| Week Change: 4.29744% Year-to-date Change: 43.0% | |
| CRWD Links: Profile News Message Board | |
| Charts:- Daily , Weekly | |
| Add CRWD to Watchlist: View: Get Complete CRWD Trend Analysis ➞ | |
 | PYPL PayPal Holdings Inc |
| Sector: Financials | |
| SubSector: Credit Services | |
| MarketCap: 65214.1 Millions | |
| Recent Price: 68.93 Smart Investing & Trading Score: 70 | |
| Day Percent Change: 3.40534% Day Change: 1.84 | |
| Week Change: 1.57678% Year-to-date Change: -20.0% | |
| PYPL Links: Profile News Message Board | |
| Charts:- Daily , Weekly | |
| Add PYPL to Watchlist: View: Get Complete PYPL Trend Analysis ➞ | |
 | TTD Trade Desk Inc |
| Sector: Technology | |
| SubSector: Advertising Agencies | |
| MarketCap: 25459.3 Millions | |
| Recent Price: 50.89 Smart Investing & Trading Score: 70 | |
| Day Percent Change: 3.18329% Day Change: 1.59 | |
| Week Change: 8.57691% Year-to-date Change: -56.8% | |
| TTD Links: Profile News Message Board | |
| Charts:- Daily , Weekly | |
| Add TTD to Watchlist: View: Get Complete TTD Trend Analysis ➞ | |
 | MCHP Microchip Technology, Inc |
| Sector: Technology | |
| SubSector: Semiconductors | |
| MarketCap: 35575.7 Millions | |
| Recent Price: 66.13 Smart Investing & Trading Score: 70 | |
| Day Percent Change: 3.15083% Day Change: 1.97 | |
| Week Change: 0.425209% Year-to-date Change: 18.0% | |
| MCHP Links: Profile News Message Board | |
| Charts:- Daily , Weekly | |
| Add MCHP to Watchlist: View: Get Complete MCHP Trend Analysis ➞ | |
 | CSX CSX Corp |
| Sector: Industrials | |
| SubSector: Railroads | |
| MarketCap: 60644.9 Millions | |
| Recent Price: 35.58 Smart Investing & Trading Score: 70 | |
| Day Percent Change: 1.64286% Day Change: 0.4 | |
| Week Change: 5.18924% Year-to-date Change: 11.5% | |
| CSX Links: Profile News Message Board | |
| Charts:- Daily , Weekly | |
| Add CSX to Watchlist: View: Get Complete CSX Trend Analysis ➞ | |
 | AVGO Broadcom Inc |
| Sector: Technology | |
| SubSector: Semiconductors | |
| MarketCap: 1575150 Millions | |
| Recent Price: 338.18 Smart Investing & Trading Score: 70 | |
| Day Percent Change: 1.43676% Day Change: 7.16 | |
| Week Change: -0.333029% Year-to-date Change: 46.6% | |
| AVGO Links: Profile News Message Board | |
| Charts:- Daily , Weekly | |
| Add AVGO to Watchlist: View: Get Complete AVGO Trend Analysis ➞ | |
 | AAPL Apple Inc |
| Sector: Technology | |
| SubSector: Consumer Electronics | |
| MarketCap: 3557090 Millions | |
| Recent Price: 257.13 Smart Investing & Trading Score: 70 | |
| Day Percent Change: 0.657663% Day Change: 2.57 | |
| Week Change: 1.91035% Year-to-date Change: 5.8% | |
| AAPL Links: Profile News Message Board | |
| Charts:- Daily , Weekly | |
| Add AAPL to Watchlist: View: Get Complete AAPL Trend Analysis ➞ | |
 | PEP PepsiCo Inc |
| Sector: Consumer Staples | |
| SubSector: Beverages - Non-Alcoholic | |
| MarketCap: 200419 Millions | |
| Recent Price: 142.31 Smart Investing & Trading Score: 70 | |
| Day Percent Change: -0.579852% Day Change: -1.2 | |
| Week Change: 0.0984737% Year-to-date Change: -3.4% | |
| PEP Links: Profile News Message Board | |
| Charts:- Daily , Weekly | |
| Add PEP to Watchlist: View: Get Complete PEP Trend Analysis ➞ | |
 | CSCO Cisco Systems, Inc |
| Sector: Technology | |
| SubSector: Communication Equipment | |
| MarketCap: 264469 Millions | |
| Recent Price: 68.31 Smart Investing & Trading Score: 70 | |
| Day Percent Change: -0.644364% Day Change: -0.08 | |
| Week Change: 1.46613% Year-to-date Change: 17.8% | |
| CSCO Links: Profile News Message Board | |
| Charts:- Daily , Weekly | |
| Add CSCO to Watchlist: View: Get Complete CSCO Trend Analysis ➞ | |
 | ADSK Autodesk Inc |
| Sector: Technology | |
| SubSector: Software - Application | |
| MarketCap: 69516.8 Millions | |
| Recent Price: 320.91 Smart Investing & Trading Score: 60 | |
| Day Percent Change: 1.64064% Day Change: 5.06 | |
| Week Change: -0.806751% Year-to-date Change: 9.4% | |
| ADSK Links: Profile News Message Board | |
| Charts:- Daily , Weekly | |
| Add ADSK to Watchlist: View: Get Complete ADSK Trend Analysis ➞ | |
 | HON Honeywell International Inc |
| Sector: Industrials | |
| SubSector: Conglomerates | |
| MarketCap: 136027 Millions | |
| Recent Price: 210.96 Smart Investing & Trading Score: 60 | |
| Day Percent Change: 0.37111% Day Change: 1.73 | |
| Week Change: 1.13135% Year-to-date Change: -5.5% | |
| HON Links: Profile News Message Board | |
| Charts:- Daily , Weekly | |
| Add HON to Watchlist: View: Get Complete HON Trend Analysis ➞ | |
 | EXC Exelon Corp |
| Sector: Utilities | |
| SubSector: Utilities - Regulated Electric | |
| MarketCap: 43863.8 Millions | |
| Recent Price: 44.97 Smart Investing & Trading Score: 60 | |
| Day Percent Change: -0.199734% Day Change: -0.28 | |
| Week Change: 1.67307% Year-to-date Change: 22.7% | |
| EXC Links: Profile News Message Board | |
| Charts:- Daily , Weekly | |
| Add EXC to Watchlist: View: Get Complete EXC Trend Analysis ➞ | |
 | FANG Diamondback Energy Inc |
| Sector: Energy | |
| SubSector: Oil & Gas E&P | |
| MarketCap: 40154.6 Millions | |
| Recent Price: 143.19 Smart Investing & Trading Score: 60 | |
| Day Percent Change: -0.243834% Day Change: -0.23 | |
| Week Change: -0.981951% Year-to-date Change: -12.9% | |
| FANG Links: Profile News Message Board | |
| Charts:- Daily , Weekly | |
| Add FANG to Watchlist: View: Get Complete FANG Trend Analysis ➞ | |
 | EA Electronic Arts, Inc |
| Sector: Technology | |
| SubSector: Electronic Gaming & Multimedia | |
| MarketCap: 42189.9 Millions | |
| Recent Price: 201.00 Smart Investing & Trading Score: 60 | |
| Day Percent Change: -0.312454% Day Change: -0.68 | |
| Week Change: 20.1076% Year-to-date Change: 38.1% | |
| EA Links: Profile News Message Board | |
| Charts:- Daily , Weekly | |
| Add EA to Watchlist: View: Get Complete EA Trend Analysis ➞ | |
 | MSFT Microsoft Corporation |
| Sector: Technology | |
| SubSector: Software - Infrastructure | |
| MarketCap: 3679420 Millions | |
| Recent Price: 515.74 Smart Investing & Trading Score: 60 | |
| Day Percent Change: -0.763888% Day Change: -2.57 | |
| Week Change: 1.09576% Year-to-date Change: 23.7% | |
| MSFT Links: Profile News Message Board | |
| Charts:- Daily , Weekly | |
| Add MSFT to Watchlist: View: Get Complete MSFT Trend Analysis ➞ | |
 | XEL Xcel Energy, Inc |
| Sector: Utilities | |
| SubSector: Utilities - Regulated Electric | |
| MarketCap: 42984.9 Millions | |
| Recent Price: 79.59 Smart Investing & Trading Score: 60 | |
| Day Percent Change: -0.896526% Day Change: -0.67 | |
| Week Change: 2.13012% Year-to-date Change: 22.0% | |
| XEL Links: Profile News Message Board | |
| Charts:- Daily , Weekly | |
| Add XEL to Watchlist: View: Get Complete XEL Trend Analysis ➞ | |
 | ILMN Illumina Inc |
| Sector: Health Care | |
| SubSector: Diagnostics & Research | |
| MarketCap: 15205.5 Millions | |
| Recent Price: 99.30 Smart Investing & Trading Score: 60 | |
| Day Percent Change: -2.89458% Day Change: -3.41 | |
| Week Change: 5.17954% Year-to-date Change: -24.2% | |
| ILMN Links: Profile News Message Board | |
| Charts:- Daily , Weekly | |
| Add ILMN to Watchlist: View: Get Complete ILMN Trend Analysis ➞ | |
 | TSLA Tesla Inc |
| Sector: Services & Goods | |
| SubSector: Auto Manufacturers | |
| MarketCap: 1131620 Millions | |
| Recent Price: 435.91 Smart Investing & Trading Score: 60 | |
| Day Percent Change: -5.12558% Day Change: -18.23 | |
| Week Change: -1.55378% Year-to-date Change: 14.9% | |
| TSLA Links: Profile News Message Board | |
| Charts:- Daily , Weekly | |
| Add TSLA to Watchlist: View: Get Complete TSLA Trend Analysis ➞ | |
 | ADBE Adobe Inc |
| Sector: Technology | |
| SubSector: Software - Application | |
| MarketCap: 148033 Millions | |
| Recent Price: 351.55 Smart Investing & Trading Score: 50 | |
| Day Percent Change: 2.27802% Day Change: 6.51 | |
| Week Change: -0.48688% Year-to-date Change: -20.3% | |
| ADBE Links: Profile News Message Board | |
| Charts:- Daily , Weekly | |
| Add ADBE to Watchlist: View: Get Complete ADBE Trend Analysis ➞ | |
 | MAR Marriott International, Inc |
| Sector: Services & Goods | |
| SubSector: Lodging | |
| MarketCap: 71854.9 Millions | |
| Recent Price: 266.40 Smart Investing & Trading Score: 50 | |
| Day Percent Change: 1.81151% Day Change: 3.49 | |
| Week Change: 1.62509% Year-to-date Change: -2.5% | |
| MAR Links: Profile News Message Board | |
| Charts:- Daily , Weekly | |
| Add MAR to Watchlist: View: Get Complete MAR Trend Analysis ➞ | |
 | PCAR Paccar Inc |
| Sector: Industrials | |
| SubSector: Farm & Heavy Construction Machinery | |
| MarketCap: 52011.5 Millions | |
| Recent Price: 99.09 Smart Investing & Trading Score: 50 | |
| Day Percent Change: 1.41234% Day Change: 1.4 | |
| Week Change: 2.27062% Year-to-date Change: -3.6% | |
| PCAR Links: Profile News Message Board | |
| Charts:- Daily , Weekly | |
| Add PCAR to Watchlist: View: Get Complete PCAR Trend Analysis ➞ | |
| For tabular summary view of above stock list: Summary View ➞ 0 - 30 , 30 - 60 , 60 - 90 , 90 - 120 | ||
| Click To Change The Sort Order: By Market Cap or Company Size Performance: Year-to-date, Week and Day | |
| Select Chart Type: | ||
|
Best Stocks Today 12Stocks.com |
© 2025 12Stocks.com Terms & Conditions Privacy Contact Us
All Information Provided Only For Education And Not To Be Used For Investing or Trading. See Terms & Conditions


One More Thing ... Get Best Stocks Delivered Daily!
Never Ever Miss A Move With Our Top Ten Stocks Lists
Find Best Stocks In Any Market - Bull or Bear Market
Take A Peek At Our Top Ten Stocks Lists: Daily, Weekly, Year-to-Date & Top Trends
Find Best Stocks In Any Market - Bull or Bear Market
Take A Peek At Our Top Ten Stocks Lists: Daily, Weekly, Year-to-Date & Top Trends
Nasdaq 100 Stocks With Best Up Trends [0-bearish to 100-bullish]: Intel Corp[100], Lam Research[100], Applied Materials[100], ASML Holding[100], Ross Stores[100], Constellation Energy[100], UltraPro[100], Palo Alto[100], KLA Corp[100], NVIDIA Corp[100], Micron [100]
Best Nasdaq 100 Stocks Year-to-Date:
Micron [110.87%], Lam Research[103.976%], Intel Corp[84.4708%], Warner Bros.[84.2%], KLA Corp[79.7904%], Zscaler [69.3163%], DoorDash [58.3182%], Idexx [55.03%], ASML Holding[48.1837%], Constellation Energy[47.8225%], Broadcom [46.567%] Best Nasdaq 100 Stocks This Week:
Electronic Arts[20.1076%], Intel Corp[19.4747%], Lam Research[14.5184%], Micron [13.6232%], Biogen [12.7697%], Astrazeneca [11.0138%], Applied Materials[11.0008%], Datadog [10.9834%], Moderna [9.62133%], ASML Holding[8.78936%], Trade Desk[8.57691%] Best Nasdaq 100 Stocks Daily:
Intel Corp[3.78408%], Advanced Micro[3.48759%], PayPal [3.40534%], MercadoLibre [3.20133%], Trade Desk[3.18329%], Microchip [3.15083%], Lam Research[2.91337%], Moderna [2.78986%], Marvell [2.76553%], Starbucks Corp[2.76066%], Applied Materials[2.69128%]