
 Login Sign Up


| |||||
 |  | ||||

| 12Stocks.com Market Intelligence |
Best MidCap Stocks
|
| In a hurry? Mid Cap Stocks Lists: Performance Trends Table, Stock Charts
Sort midcap stocks: Daily, Weekly, Year-to-Date, Market Cap & Trends. Filter midcap stocks list by sector: Show all, Tech, Finance, Energy, Staples, Retail, Industrial, Materials, Utilities and HealthCare Filter midcap stocks list by size:All MidCap Large Mid-Range Small |
| 12Stocks.com Mid Cap Stocks Performances & Trends Daily | |||||||||
|
|  The overall Smart Investing & Trading Score is 70 (0-bearish to 100-bullish) which puts Mid Cap index in short term neutral to bullish trend. The Smart Investing & Trading Score from previous trading session is 60 and an improvement of trend continues.
| ||||||||
Here are the Smart Investing & Trading Scores of the most requested mid cap stocks at 12Stocks.com (click stock name for detailed review):
|


| 12Stocks.com: Top Performing Mid Cap Index Stocks | ||||||||||||||||||||||||||||||||||||||||||||||||
 The top performing Mid Cap Index stocks year to date are
Now, more recently, over last week, the top performing Mid Cap Index stocks on the move are


|
||||||||||||||||||||||||||||||||||||||||||||||||
| 12Stocks.com: Investing in Midcap Index with Stocks | |
|
The following table helps investors and traders sort through current performance and trends (as measured by Smart Investing & Trading Score) of various
stocks in the Midcap Index. Quick View: Move mouse or cursor over stock symbol (ticker) to view short-term technical chart and over stock name to view long term chart. Click on  to add stock symbol to your watchlist and to add stock symbol to your watchlist and  to view watchlist. Click on any ticker or stock name for detailed market intelligence report for that stock. to view watchlist. Click on any ticker or stock name for detailed market intelligence report for that stock. |
12Stocks.com Performance of Stocks in Midcap Index
| Ticker | Stock Name | Watchlist | Category | Recent Price | Smart Investing & Trading Score | Change % | YTD Change% |
| KNX | Knight-Swift Transportation |   | Industrials | 39.90 | 40 | 2.47% | -23.74% |
| DLB | Dolby | | Industrials | 71.51 | 20 | -0.91% | -6.89% |
| BYD | Boyd Gaming | | Services & Goods | 87.01 | 80 | -0.02% | 21.75% |
| TREX | TREX Co | | Industrials | 52.46 | 40 | 1.00% | -23.14% |
| OLED | Universal Display | | Technology | 147.31 | 90 | 2.11% | -0.96% |
| JHG | Janus Henderson | | Financials | 44.96 | 90 | 1.93% | 7.46% |
| LPX | Louisiana-Pacific Corp | | Industrials | 89.98 | 50 | -0.22% | -12.87% |
| AXTA | Axalta Coating | | Materials | 28.19 | 30 | 0.39% | -16.00% |
| HRB | H&R Block | | Services & Goods | 51.14 | 60 | 0.04% | -2.37% |
| FAF | First American | | Financials | 63.77 | 20 | -0.17% | 4.92% |
| SITE | SiteOne Landscape | | Industrials | 128.63 | 30 | 0.86% | -0.32% |
| CHE | Chemed Corp | | Health Care | 442.04 | 30 | 0.32% | -16.01% |
| IDA | Idacorp | | Utilities | 131.88 | 60 | 0.30% | 24.26% |
| LYFT | Lyft | | Technology | 22.62 | 80 | 3.67% | 65.71% |
| GTES | Gates Industrial | | Industrials | 25.75 | 70 | 2.14% | 26.10% |
| MSA | MSA Safety | | Industrials | 173.63 | 80 | 0.67% | 5.91% |
| CFLT | Confluent | | Technology | 20.52 | 100 | 4.06% | -27.36% |
| BFAM | Bright Horizons | | Services & Goods | 106.64 | 0 | -1.25% | -3.54% |
| WH | Wyndham Hotels | | Services & Goods | 81.20 | 40 | 1.06% | -17.85% |
| ARW | Arrow Electronics | | Technology | 122.45 | 60 | 0.62% | 9.94% |
| MTG | MGIC | | Financials | 27.75 | 10 | -1.25% | 19.11% |
| AMG | Affiliated Managers | | Financials | 236.55 | 50 | 2.40% | 26.59% |
| LFUS | Littelfuse | | Technology | 259.12 | 70 | 0.44% | 11.08% |
| SLM | SLM Corp | | Financials | 27.22 | 0 | -0.66% | 0.38% |
| PB | Prosperity Bancshares | | Financials | 65.58 | 0 | -2.06% | -10.70% |
| For chart view version of above stock list: Chart View ➞ 0 - 25 , 25 - 50 , 50 - 75 , 75 - 100 , 100 - 125 | ||
 | Click To Change The Sort Order: By Market Cap or Company Size Performance: Year-to-date, Week and Day |  |
|
Get the most comprehensive stock market coverage daily at 12Stocks.com ➞ Best Stocks Today ➞ Best Stocks Weekly ➞ Best Stocks Year-to-Date ➞ Best Stocks Trends ➞  Best Stocks Today 12Stocks.com Best Nasdaq Stocks ➞ Best S&P 500 Stocks ➞ Best Tech Stocks ➞ Best Biotech Stocks ➞ |
| Detailed Overview of Midcap Stocks |
| Midcap Technical Overview, Leaders & Laggards, Top Midcap ETF Funds & Detailed Midcap Stocks List, Charts, Trends & More |
| Midcap: Technical Analysis, Trends & YTD Performance | |
| MidCap segment as represented by
MDY, an exchange-traded fund [ETF], holds basket of about four hundred midcap stocks from across all major sectors of the US stock market. The midcap index (contains stocks like Green Mountain Coffee Roasters and Tractor Supply Company) is up by 5.96788% and is currently underperforming the overall market by -8.79002% year-to-date. Below is a quick view of technical charts and trends: | |
 MDY Weekly Chart |
|
| Long Term Trend: Very Good | |
| Medium Term Trend: Not Good | |
 MDY Daily Chart |
|
| Short Term Trend: Very Good | |
| Overall Trend Score: 70 | |
| YTD Performance: 5.96788% | |
| **Trend Scores & Views Are Only For Educational Purposes And Not For Investing | |
| 12Stocks.com: Investing in Midcap Index using Exchange Traded Funds | |
|
The following table shows list of key exchange traded funds (ETF) that
help investors track Midcap index. The following list also includes leveraged ETF funds that track twice or thrice the daily returns of Midcap indices. Short or inverse ETF funds move in the opposite direction to the index they track and are useful during market pullbacks or during bear markets. Quick View: Move mouse or cursor over ETF symbol (ticker) to view short-term technical chart and over ETF name to view long term chart. Click on ticker or stock name for detailed view. Click on to add stock symbol to your watchlist and to view watchlist. |
12Stocks.com List of ETFs that track Midcap Index
| Ticker | ETF Name | Watchlist | Recent Price | Smart Investing & Trading Score | Change % | Week % | Year-to-date % |
| IJH | iShares Core S&P Mid-Cap ETF | | 65.57 | 70 | 0.122156 | 0.814883 | 6.12728% |
| IWR | iShares Russell Mid-Cap ETF | | 96.94 | 80 | 0.435143 | 1.095 | 10.4451% |
| MDY | S&P MidCap 400 ETF | | 598.78 | 70 | 0.135458 | 0.799623 | 5.96788% |
| IWP | iShares Russell Mid-Cap Growth ETF | | 143.46 | 60 | 1.06375 | 0.709021 | 12.7484% |
| IWS | iShares Russell Mid-Cap Value ETF | | 140.24 | 90 | 0.293213 | 1.2417 | 9.61902% |
| XMLV | Invesco S&P MidCap Low Volatility ETF | | 63.15 | 40 | -0.468716 | 0.529449 | 5.75473% |
| IJK | iShares S&P Mid-Cap 400 Growth ETF | | 96.25 | 70 | 0.176936 | 0.669386 | 6.02707% |
| IJJ | iShares S&P Mid-Cap 400 Value ETF | | 130.47 | 70 | 0.138153 | 0.850274 | 5.90097% |
| MYY | ProShares Short Midcap400 -1x Shares | | 17.72 | 10 | -0.221847 | -0.638093 | -5.50223% |
| UMDD | ProShares UltraPro MidCap400 3x Shares | | 25.88 | 70 | 0.622084 | 2.09476 | -1.51345% |
| MZZ | ProShares UltraShort MidCap400 -2x Shares | | 8.16 | 10 | -0.237155 | -1.19976 | -15.2687% |
| MVV | ProShares Ultra MidCap400 2X Shares | | 69.74 | 70 | 0.273185 | 1.4105 | 3.63664% |
| SMDD | ProShares UltraPro Short MidCap400 -3x Shares | | 13.01 | 20 | -0.306513 | -1.99919 | -26.369% |
| 12Stocks.com: Charts, Trends, Fundamental Data and Performances of MidCap Stocks | |
|
We now take in-depth look at all MidCap stocks including charts, multi-period performances and overall trends (as measured by Smart Investing & Trading Score). One can sort MidCap stocks (click link to choose) by Daily, Weekly and by Year-to-Date performances. Also, one can sort by size of the company or by market capitalization. |
| Select Your Default Chart Type: | |||||
| |||||
| Click on stock symbol or name for detailed view. Click on to add stock symbol to your watchlist and to view watchlist. Quick View: Move mouse or cursor over "Daily" to quickly view daily technical stock chart and over "Weekly" to view weekly technical stock chart. | |||||

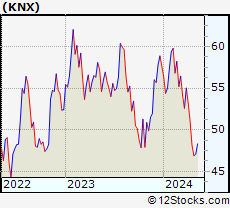 | KNX Knight-Swift Transportation Holdings Inc |
| Sector: Industrials | |
| SubSector: Trucking | |
| MarketCap: 6996.84 Millions | |
| Recent Price: 39.90 Smart Investing & Trading Score: 40 | |
| Day Percent Change: 2.46533% Day Change: 0.81 | |
| Week Change: 1.86367% Year-to-date Change: -23.7% | |
| KNX Links: Profile News Message Board | |
| Charts:- Daily , Weekly | |
| Add KNX to Watchlist: View: Get Complete KNX Trend Analysis ➞ | |
 | DLB Dolby Laboratories Inc |
| Sector: Industrials | |
| SubSector: Specialty Business Services | |
| MarketCap: 6962.16 Millions | |
| Recent Price: 71.51 Smart Investing & Trading Score: 20 | |
| Day Percent Change: -0.914507% Day Change: -0.46 | |
| Week Change: -0.139645% Year-to-date Change: -6.9% | |
| DLB Links: Profile News Message Board | |
| Charts:- Daily , Weekly | |
| Add DLB to Watchlist: View: Get Complete DLB Trend Analysis ➞ | |
 | BYD Boyd Gaming Corp |
| Sector: Services & Goods | |
| SubSector: Resorts & Casinos | |
| MarketCap: 6932.73 Millions | |
| Recent Price: 87.01 Smart Investing & Trading Score: 80 | |
| Day Percent Change: -0.0229806% Day Change: 0.03 | |
| Week Change: 3.0802% Year-to-date Change: 21.8% | |
| BYD Links: Profile News Message Board | |
| Charts:- Daily , Weekly | |
| Add BYD to Watchlist: View: Get Complete BYD Trend Analysis ➞ | |
 | TREX TREX Co., Inc |
| Sector: Industrials | |
| SubSector: Building Products & Equipment | |
| MarketCap: 6927.34 Millions | |
| Recent Price: 52.46 Smart Investing & Trading Score: 40 | |
| Day Percent Change: 1.00116% Day Change: 0.14 | |
| Week Change: 3.38983% Year-to-date Change: -23.1% | |
| TREX Links: Profile News Message Board | |
| Charts:- Daily , Weekly | |
| Add TREX to Watchlist: View: Get Complete TREX Trend Analysis ➞ | |
 | OLED Universal Display Corp |
| Sector: Technology | |
| SubSector: Electronic Components | |
| MarketCap: 6910.99 Millions | |
| Recent Price: 147.31 Smart Investing & Trading Score: 90 | |
| Day Percent Change: 2.10716% Day Change: 3.25 | |
| Week Change: 0.258627% Year-to-date Change: -1.0% | |
| OLED Links: Profile News Message Board | |
| Charts:- Daily , Weekly | |
| Add OLED to Watchlist: View: Get Complete OLED Trend Analysis ➞ | |
 | JHG Janus Henderson Group plc |
| Sector: Financials | |
| SubSector: Asset Management | |
| MarketCap: 6906.73 Millions | |
| Recent Price: 44.96 Smart Investing & Trading Score: 90 | |
| Day Percent Change: 1.927% Day Change: 0.87 | |
| Week Change: 1.39829% Year-to-date Change: 7.5% | |
| JHG Links: Profile News Message Board | |
| Charts:- Daily , Weekly | |
| Add JHG to Watchlist: View: Get Complete JHG Trend Analysis ➞ | |
 | LPX Louisiana-Pacific Corp |
| Sector: Industrials | |
| SubSector: Building Products & Equipment | |
| MarketCap: 6895.85 Millions | |
| Recent Price: 89.98 Smart Investing & Trading Score: 50 | |
| Day Percent Change: -0.221779% Day Change: -0.51 | |
| Week Change: 7.90263% Year-to-date Change: -12.9% | |
| LPX Links: Profile News Message Board | |
| Charts:- Daily , Weekly | |
| Add LPX to Watchlist: View: Get Complete LPX Trend Analysis ➞ | |
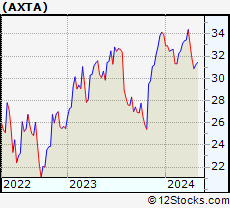 | AXTA Axalta Coating Systems Ltd |
| Sector: Materials | |
| SubSector: Specialty Chemicals | |
| MarketCap: 6891.39 Millions | |
| Recent Price: 28.19 Smart Investing & Trading Score: 30 | |
| Day Percent Change: 0.391738% Day Change: 0.18 | |
| Week Change: -0.879044% Year-to-date Change: -16.0% | |
| AXTA Links: Profile News Message Board | |
| Charts:- Daily , Weekly | |
| Add AXTA to Watchlist: View: Get Complete AXTA Trend Analysis ➞ | |
 | HRB H&R Block Inc |
| Sector: Services & Goods | |
| SubSector: Personal Services | |
| MarketCap: 6848.73 Millions | |
| Recent Price: 51.14 Smart Investing & Trading Score: 60 | |
| Day Percent Change: 0.0391236% Day Change: 0.14 | |
| Week Change: 3.41759% Year-to-date Change: -2.4% | |
| HRB Links: Profile News Message Board | |
| Charts:- Daily , Weekly | |
| Add HRB to Watchlist: View: Get Complete HRB Trend Analysis ➞ | |
 | FAF First American Financial Corp |
| Sector: Financials | |
| SubSector: Insurance - Specialty | |
| MarketCap: 6826.71 Millions | |
| Recent Price: 63.77 Smart Investing & Trading Score: 20 | |
| Day Percent Change: -0.172198% Day Change: -0.16 | |
| Week Change: -2.28317% Year-to-date Change: 4.9% | |
| FAF Links: Profile News Message Board | |
| Charts:- Daily , Weekly | |
| Add FAF to Watchlist: View: Get Complete FAF Trend Analysis ➞ | |
 | SITE SiteOne Landscape Supply Inc |
| Sector: Industrials | |
| SubSector: Industrial Distribution | |
| MarketCap: 6824.39 Millions | |
| Recent Price: 128.63 Smart Investing & Trading Score: 30 | |
| Day Percent Change: 0.862542% Day Change: 0.97 | |
| Week Change: -1.50088% Year-to-date Change: -0.3% | |
| SITE Links: Profile News Message Board | |
| Charts:- Daily , Weekly | |
| Add SITE to Watchlist: View: Get Complete SITE Trend Analysis ➞ | |
 | CHE Chemed Corp |
| Sector: Health Care | |
| SubSector: Medical Care Facilities | |
| MarketCap: 6785.02 Millions | |
| Recent Price: 442.04 Smart Investing & Trading Score: 30 | |
| Day Percent Change: 0.31772% Day Change: 1.85 | |
| Week Change: -3.26929% Year-to-date Change: -16.0% | |
| CHE Links: Profile News Message Board | |
| Charts:- Daily , Weekly | |
| Add CHE to Watchlist: View: Get Complete CHE Trend Analysis ➞ | |
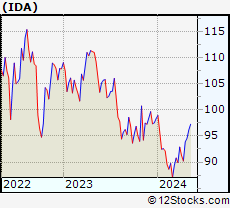 | IDA Idacorp, Inc |
| Sector: Utilities | |
| SubSector: Utilities - Regulated Electric | |
| MarketCap: 6773.57 Millions | |
| Recent Price: 131.88 Smart Investing & Trading Score: 60 | |
| Day Percent Change: 0.304229% Day Change: -0.25 | |
| Week Change: 2.68629% Year-to-date Change: 24.3% | |
| IDA Links: Profile News Message Board | |
| Charts:- Daily , Weekly | |
| Add IDA to Watchlist: View: Get Complete IDA Trend Analysis ➞ | |
 | LYFT Lyft Inc |
| Sector: Technology | |
| SubSector: Software - Application | |
| MarketCap: 6771.32 Millions | |
| Recent Price: 22.62 Smart Investing & Trading Score: 80 | |
| Day Percent Change: 3.66636% Day Change: -0.01 | |
| Week Change: 2.53853% Year-to-date Change: 65.7% | |
| LYFT Links: Profile News Message Board | |
| Charts:- Daily , Weekly | |
| Add LYFT to Watchlist: View: Get Complete LYFT Trend Analysis ➞ | |
 | GTES Gates Industrial Corporation plc |
| Sector: Industrials | |
| SubSector: Specialty Industrial Machinery | |
| MarketCap: 6679.16 Millions | |
| Recent Price: 25.75 Smart Investing & Trading Score: 70 | |
| Day Percent Change: 2.14201% Day Change: 0.52 | |
| Week Change: 5.79293% Year-to-date Change: 26.1% | |
| GTES Links: Profile News Message Board | |
| Charts:- Daily , Weekly | |
| Add GTES to Watchlist: View: Get Complete GTES Trend Analysis ➞ | |
 | MSA MSA Safety Inc |
| Sector: Industrials | |
| SubSector: Security & Protection Services | |
| MarketCap: 6672.35 Millions | |
| Recent Price: 173.63 Smart Investing & Trading Score: 80 | |
| Day Percent Change: 0.672581% Day Change: 0.86 | |
| Week Change: 2.38222% Year-to-date Change: 5.9% | |
| MSA Links: Profile News Message Board | |
| Charts:- Daily , Weekly | |
| Add MSA to Watchlist: View: Get Complete MSA Trend Analysis ➞ | |
 | CFLT Confluent Inc |
| Sector: Technology | |
| SubSector: Software - Infrastructure | |
| MarketCap: 6667.35 Millions | |
| Recent Price: 20.52 Smart Investing & Trading Score: 100 | |
| Day Percent Change: 4.0568% Day Change: 0.85 | |
| Week Change: 3.95137% Year-to-date Change: -27.4% | |
| CFLT Links: Profile News Message Board | |
| Charts:- Daily , Weekly | |
| Add CFLT to Watchlist: View: Get Complete CFLT Trend Analysis ➞ | |
 | BFAM Bright Horizons Family Solutions, Inc |
| Sector: Services & Goods | |
| SubSector: Personal Services | |
| MarketCap: 6643.77 Millions | |
| Recent Price: 106.64 Smart Investing & Trading Score: 0 | |
| Day Percent Change: -1.25012% Day Change: -1.35 | |
| Week Change: -0.818452% Year-to-date Change: -3.5% | |
| BFAM Links: Profile News Message Board | |
| Charts:- Daily , Weekly | |
| Add BFAM to Watchlist: View: Get Complete BFAM Trend Analysis ➞ | |
 | WH Wyndham Hotels & Resorts Inc |
| Sector: Services & Goods | |
| SubSector: Lodging | |
| MarketCap: 6594.13 Millions | |
| Recent Price: 81.20 Smart Investing & Trading Score: 40 | |
| Day Percent Change: 1.05787% Day Change: 1.01 | |
| Week Change: -1.48022% Year-to-date Change: -17.9% | |
| WH Links: Profile News Message Board | |
| Charts:- Daily , Weekly | |
| Add WH to Watchlist: View: Get Complete WH Trend Analysis ➞ | |
 | ARW Arrow Electronics Inc |
| Sector: Technology | |
| SubSector: Electronics & Computer Distribution | |
| MarketCap: 6573.68 Millions | |
| Recent Price: 122.45 Smart Investing & Trading Score: 60 | |
| Day Percent Change: 0.624538% Day Change: 0.51 | |
| Week Change: 1.25693% Year-to-date Change: 9.9% | |
| ARW Links: Profile News Message Board | |
| Charts:- Daily , Weekly | |
| Add ARW to Watchlist: View: Get Complete ARW Trend Analysis ➞ | |
 | MTG MGIC Investment Corp |
| Sector: Financials | |
| SubSector: Insurance - Specialty | |
| MarketCap: 6546.85 Millions | |
| Recent Price: 27.75 Smart Investing & Trading Score: 10 | |
| Day Percent Change: -1.24555% Day Change: -0.29 | |
| Week Change: -2.69986% Year-to-date Change: 19.1% | |
| MTG Links: Profile News Message Board | |
| Charts:- Daily , Weekly | |
| Add MTG to Watchlist: View: Get Complete MTG Trend Analysis ➞ | |
 | AMG Affiliated Managers Group Inc |
| Sector: Financials | |
| SubSector: Asset Management | |
| MarketCap: 6542.73 Millions | |
| Recent Price: 236.55 Smart Investing & Trading Score: 50 | |
| Day Percent Change: 2.39816% Day Change: 3.98 | |
| Week Change: -0.290845% Year-to-date Change: 26.6% | |
| AMG Links: Profile News Message Board | |
| Charts:- Daily , Weekly | |
| Add AMG to Watchlist: View: Get Complete AMG Trend Analysis ➞ | |
 | LFUS Littelfuse, Inc |
| Sector: Technology | |
| SubSector: Electronic Components | |
| MarketCap: 6508.38 Millions | |
| Recent Price: 259.12 Smart Investing & Trading Score: 70 | |
| Day Percent Change: 0.441895% Day Change: 2.32 | |
| Week Change: -0.326961% Year-to-date Change: 11.1% | |
| LFUS Links: Profile News Message Board | |
| Charts:- Daily , Weekly | |
| Add LFUS to Watchlist: View: Get Complete LFUS Trend Analysis ➞ | |
 | SLM SLM Corp |
| Sector: Financials | |
| SubSector: Credit Services | |
| MarketCap: 6485.86 Millions | |
| Recent Price: 27.22 Smart Investing & Trading Score: 0 | |
| Day Percent Change: -0.656934% Day Change: -0.08 | |
| Week Change: -4.28973% Year-to-date Change: 0.4% | |
| SLM Links: Profile News Message Board | |
| Charts:- Daily , Weekly | |
| Add SLM to Watchlist: View: Get Complete SLM Trend Analysis ➞ | |
 | PB Prosperity Bancshares Inc |
| Sector: Financials | |
| SubSector: Banks - Regional | |
| MarketCap: 6462.88 Millions | |
| Recent Price: 65.58 Smart Investing & Trading Score: 0 | |
| Day Percent Change: -2.06093% Day Change: -1.21 | |
| Week Change: 0.275229% Year-to-date Change: -10.7% | |
| PB Links: Profile News Message Board | |
| Charts:- Daily , Weekly | |
| Add PB to Watchlist: View: Get Complete PB Trend Analysis ➞ | |
| For tabular summary view of above stock list: Summary View ➞ 0 - 25 , 25 - 50 , 50 - 75 , 75 - 100 , 100 - 125 | ||
| Click To Change The Sort Order: By Market Cap or Company Size Performance: Year-to-date, Week and Day | |
| Select Chart Type: | ||
|
Best Stocks Today 12Stocks.com |
© 2025 12Stocks.com Terms & Conditions Privacy Contact Us
All Information Provided Only For Education And Not To Be Used For Investing or Trading. See Terms & Conditions


One More Thing ... Get Best Stocks Delivered Daily!
Never Ever Miss A Move With Our Top Ten Stocks Lists
Find Best Stocks In Any Market - Bull or Bear Market
Take A Peek At Our Top Ten Stocks Lists: Daily, Weekly, Year-to-Date & Top Trends
Find Best Stocks In Any Market - Bull or Bear Market
Take A Peek At Our Top Ten Stocks Lists: Daily, Weekly, Year-to-Date & Top Trends
Midcap Stocks With Best Up Trends [0-bearish to 100-bullish]: Fair Isaac[100], Sarepta [100], Ginkgo Bioworks[100], Acadia [100], Robinhood Markets[100], Sunrun [100], Confluent [100], MKS [100], Ionis [100], Bio-Techne Corp[100], DuPont de[100]
Best Midcap Stocks Year-to-Date:
Lucid [695.38%], MP Materials[332.947%], Wolfspeed [307.01%], Robinhood Markets[269.422%], SSR Mining[227.298%], Viasat [224.029%], Western Digital[181.204%], QuantumScape Corp[158.123%], Palantir Technologies[148.77%], Roblox [126.886%], Celsius [116.544%] Best Midcap Stocks This Week:
Wolfspeed [1961.98%], Splunk [38.7643%], Ginkgo Bioworks[38.5082%], Stericycle [31.4276%], Sarepta [22.3987%], Bio-Techne Corp[21.2222%], Electronic Arts[20.1076%], QuidelOrtho [19.7078%], Western Digital[19.6645%], Sunrun [19.4081%], Certara [19.0227%] Best Midcap Stocks Daily:
Fair Isaac[17.979%], Sarepta [15.6832%], Ginkgo Bioworks[8.86162%], Teladoc Health[8.71795%], Acadia [8.51324%], Agilon Health[8%], Coinbase Global[7.48187%], Celanese Corp[6.98937%], Bentley [6.91632%], AMC Entertainment[6.77966%], Kinsale Capital[6.00493%]