
 Login Sign Up


| |||||
 |  | ||||

| 12Stocks.com Market Intelligence |
Best Materials Stocks
| In a hurry? Materials Stocks Lists: Performance Trends Table, Stock Charts
Sort Materials stocks: Daily, Weekly, Year-to-Date, Market Cap & Trends. Filter Materials stocks list by size: All Materials Large Mid-Range Small |
| 12Stocks.com Materials Stocks Performances & Trends Daily | |||||||||
|
|  The overall Smart Investing & Trading Score is 40 (0-bearish to 100-bullish) which puts Materials sector in short term bearish to neutral trend. The Smart Investing & Trading Score from previous trading session is 30 and an improvement of trend continues.
| ||||||||
Here are the Smart Investing & Trading Scores of the most requested Materials stocks at 12Stocks.com (click stock name for detailed review):
|


| Consider signing up for our daily 12Stocks.com "Best Stocks Newsletter". You will never ever miss a big stock move again! |
| 12Stocks.com: Investing in Materials sector with Stocks | |
|
The following table helps investors and traders sort through current performance and trends (as measured by Smart Investing & Trading Score) of various
stocks in the Materials sector. Quick View: Move mouse or cursor over stock symbol (ticker) to view short-term Technical chart and over stock name to view long term chart. Click on  to add stock symbol to your watchlist and to add stock symbol to your watchlist and  to view watchlist. Click on any ticker or stock name for detailed market intelligence report for that stock. to view watchlist. Click on any ticker or stock name for detailed market intelligence report for that stock. |
12Stocks.com Performance of Stocks in Materials Sector
| Ticker | Stock Name | Watchlist | Category | Recent Price | Smart Investing & Trading Score | Change % | YTD Change% |
| SAND | Sandstorm Gold |   | Gold | 12.40 | 80 | -0.64% | 118.41% |
| HMY | Harmony Gold | | Gold | 18.34 | 70 | -0.54% | 117.88% |
| B | Barrick | | Gold | 33.92 | 50 | 0.62% | 114.73% |
| OR | OR Royalties | | Gold | 39.67 | 70 | -1.29% | 113.75% |
| SVM | Silvercorp Metals | | Silver | 6.63 | 100 | 1.69% | 111.09% |
| BVN | Compania de | | Other Precious Metals & Mining | 24.93 | 70 | 1.14% | 110.15% |
| TGB | Taseko Mines | | Copper | 4.19 | 80 | 0.00% | 109.50% |
| AEM | Agnico Eagle | | Gold | 168.14 | 70 | -1.20% | 106.64% |
| SA | Seabridge Gold | | Gold | 24.85 | 90 | -0.52% | 106.40% |
| EQX | Equinox Gold | | Gold | 10.93 | 50 | 0.37% | 105.84% |
| AG | First Majestic | | Silver | 12.06 | 60 | -1.63% | 103.08% |
| MUX | McEwen | | Other Precious Metals & Mining | 16.42 | 60 | -2.15% | 98.79% |
| BTG | B2gold Corp | | Gold | 5.03 | 70 | 0.60% | 96.73% |
| TRX | TRX Gold | | Gold | 0.62 | 80 | -1.25% | 95.53% |
| FSM | Fortuna | | Gold | 8.89 | 90 | 0.00% | 94.10% |
| TFPM | Triple Flag | | Other Precious Metals & Mining | 29.42 | 60 | -1.93% | 93.55% |
| PLG | Platinum | | Other Precious Metals & Mining | 2.58 | 80 | -2.64% | 91.11% |
| EXK | Endeavour Silver | | Silver | 7.63 | 60 | -1.55% | 90.75% |
| WPM | Wheaton Precious | | Gold | 109.83 | 40 | -1.47% | 89.90% |
| EGO | Eldorado Gold | | Gold | 29.23 | 60 | -0.75% | 86.30% |
| PAAS | Pan American | | Gold | 39.19 | 70 | -0.23% | 84.96% |
| FNV | Franco-Nevada | | Gold | 217.54 | 60 | -2.13% | 80.47% |
| NAK | Northern Dynasty | | Other Industrial Metals & Mining | 1.22 | 70 | 3.39% | 79.41% |
| AGI | Alamos Gold | | Gold | 34.41 | 60 | -1.94% | 79.01% |
| DC | Dakota Gold | | Gold | 4.55 | 46 | 1.82% | 77.73% |
| For chart view version of above stock list: Chart View ➞ 0 - 25 , 25 - 50 , 50 - 75 , 75 - 100 , 100 - 125 , 125 - 150 , 150 - 175 , 175 - 200 , 200 - 225 , 225 - 250 , 250 - 275 | ||
 | Click To Change The Sort Order: By Market Cap or Company Size Performance: Year-to-date, Week and Day |  |
|
Get the most comprehensive stock market coverage daily at 12Stocks.com ➞ Best Stocks Today ➞ Best Stocks Weekly ➞ Best Stocks Year-to-Date ➞ Best Stocks Trends ➞  Best Stocks Today 12Stocks.com Best Nasdaq Stocks ➞ Best S&P 500 Stocks ➞ Best Tech Stocks ➞ Best Biotech Stocks ➞ |
| Detailed Overview of Materials Stocks |
| Materials Technical Overview, Leaders & Laggards, Top Materials ETF Funds & Detailed Materials Stocks List, Charts, Trends & More |
| Materials Sector: Technical Analysis, Trends & YTD Performance | |
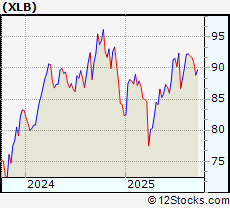
| Materials sector is composed of stocks
from mining, metals, agricultural, precious metals
and chemical subsectors. Materials sector, as represented by XLB, an exchange-traded fund [ETF] that holds basket of Materials stocks (e.g, Dow Chemical, Newmont Mining) is up by 8.87691% and is currently underperforming the overall market by -5.88099% year-to-date. Below is a quick view of Technical charts and trends: |
|
 XLB Weekly Chart |
|
| Long Term Trend: Very Good | |
| Medium Term Trend: Not Good | |
 XLB Daily Chart |
|
| Short Term Trend: Very Good | |
| Overall Trend Score: 40 | |
| YTD Performance: 8.87691% | |
| **Trend Scores & Views Are Only For Educational Purposes And Not For Investing | |
| 12Stocks.com: Top Performing Materials Sector Stocks | ||||||||||||||||||||||||||||||||||||||||||||||||
 The top performing Materials sector stocks year to date are
Now, more recently, over last week, the top performing Materials sector stocks on the move are


|
||||||||||||||||||||||||||||||||||||||||||||||||
| 12Stocks.com: Investing in Materials Sector using Exchange Traded Funds | |
|
The following table shows list of key exchange traded funds (ETF) that
help investors track Materials Index. For detailed view, check out our ETF Funds section of our website. Quick View: Move mouse or cursor over ETF symbol (ticker) to view short-term Technical chart and over ETF name to view long term chart. Click on ticker or stock name for detailed view. Click on to add stock symbol to your watchlist and to view watchlist. |
12Stocks.com List of ETFs that track Materials Index
| Ticker | ETF Name | Watchlist | Recent Price | Smart Investing & Trading Score | Change % | Week % | Year-to-date % |
| JJC | Copper Sub | | 62.75 | 90 | 2.06571 | 220.808 | 0% |
| RTM | S&P 500 Eq | | 32.95 | 50 | 1.16672 | -0.969567 | 3.3732% |
| 12Stocks.com: Charts, Trends, Fundamental Data and Performances of Materials Stocks | |
|
We now take in-depth look at all Materials stocks including charts, multi-period performances and overall trends (as measured by Smart Investing & Trading Score). One can sort Materials stocks (click link to choose) by Daily, Weekly and by Year-to-Date performances. Also, one can sort by size of the company or by market capitalization. |
| Select Your Default Chart Type: | |||||
| |||||
| Click on stock symbol or name for detailed view. Click on to add stock symbol to your watchlist and to view watchlist. Quick View: Move mouse or cursor over "Daily" to quickly view daily Technical stock chart and over "Weekly" to view weekly Technical stock chart. | |||||

 | SAND Sandstorm Gold Ltd |
| Sector: Materials | |
| SubSector: Gold | |
| MarketCap: 3365.48 Millions | |
| Recent Price: 12.40 Smart Investing & Trading Score: 80 | |
| Day Percent Change: -0.641026% Day Change: 0.31 | |
| Week Change: 5.17388% Year-to-date Change: 118.4% | |
| SAND Links: Profile News Message Board | |
| Charts:- Daily , Weekly | |
| Add SAND to Watchlist: View: Get Complete SAND Trend Analysis ➞ | |
 | HMY Harmony Gold Mining Co Ltd ADR |
| Sector: Materials | |
| SubSector: Gold | |
| MarketCap: 8778.96 Millions | |
| Recent Price: 18.34 Smart Investing & Trading Score: 70 | |
| Day Percent Change: -0.542299% Day Change: -0.71 | |
| Week Change: 6.31884% Year-to-date Change: 117.9% | |
| HMY Links: Profile News Message Board | |
| Charts:- Daily , Weekly | |
| Add HMY to Watchlist: View: Get Complete HMY Trend Analysis ➞ | |
 | B Barrick Mining Corp |
| Sector: Materials | |
| SubSector: Gold | |
| MarketCap: 48467.2 Millions | |
| Recent Price: 33.92 Smart Investing & Trading Score: 50 | |
| Day Percent Change: 0.622961% Day Change: -0.79 | |
| Week Change: 1.0426% Year-to-date Change: 114.7% | |
| B Links: Profile News Message Board | |
| Charts:- Daily , Weekly | |
| Add B to Watchlist: View: Get Complete B Trend Analysis ➞ | |
 | OR OR Royalties Inc |
| Sector: Materials | |
| SubSector: Gold | |
| MarketCap: 6477.16 Millions | |
| Recent Price: 39.67 Smart Investing & Trading Score: 70 | |
| Day Percent Change: -1.29385% Day Change: -1.25 | |
| Week Change: 7.53592% Year-to-date Change: 113.8% | |
| OR Links: Profile News Message Board | |
| Charts:- Daily , Weekly | |
| Add OR to Watchlist: View: Get Complete OR Trend Analysis ➞ | |
 | SVM Silvercorp Metals Inc |
| Sector: Materials | |
| SubSector: Silver | |
| MarketCap: 1075.66 Millions | |
| Recent Price: 6.63 Smart Investing & Trading Score: 100 | |
| Day Percent Change: 1.68712% Day Change: 0.07 | |
| Week Change: 12.7551% Year-to-date Change: 111.1% | |
| SVM Links: Profile News Message Board | |
| Charts:- Daily , Weekly | |
| Add SVM to Watchlist: View: Get Complete SVM Trend Analysis ➞ | |
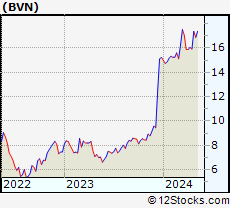 | BVN Compania de Minas Buenaventura S.A. ADR |
| Sector: Materials | |
| SubSector: Other Precious Metals & Mining | |
| MarketCap: 5071.86 Millions | |
| Recent Price: 24.93 Smart Investing & Trading Score: 70 | |
| Day Percent Change: 1.1359% Day Change: -0.56 | |
| Week Change: 9.05512% Year-to-date Change: 110.1% | |
| BVN Links: Profile News Message Board | |
| Charts:- Daily , Weekly | |
| Add BVN to Watchlist: View: Get Complete BVN Trend Analysis ➞ | |
 | TGB Taseko Mines Ltd |
| Sector: Materials | |
| SubSector: Copper | |
| MarketCap: 1051.88 Millions | |
| Recent Price: 4.19 Smart Investing & Trading Score: 80 | |
| Day Percent Change: 0% Day Change: 0.01 | |
| Week Change: 3.20197% Year-to-date Change: 109.5% | |
| TGB Links: Profile News Message Board | |
| Charts:- Daily , Weekly | |
| Add TGB to Watchlist: View: Get Complete TGB Trend Analysis ➞ | |
 | AEM Agnico Eagle Mines Ltd |
| Sector: Materials | |
| SubSector: Gold | |
| MarketCap: 76280.3 Millions | |
| Recent Price: 168.14 Smart Investing & Trading Score: 70 | |
| Day Percent Change: -1.20454% Day Change: -5.44 | |
| Week Change: 6.46489% Year-to-date Change: 106.6% | |
| AEM Links: Profile News Message Board | |
| Charts:- Daily , Weekly | |
| Add AEM to Watchlist: View: Get Complete AEM Trend Analysis ➞ | |
 | SA Seabridge Gold, Inc |
| Sector: Materials | |
| SubSector: Gold | |
| MarketCap: 1782.57 Millions | |
| Recent Price: 24.85 Smart Investing & Trading Score: 90 | |
| Day Percent Change: -0.520416% Day Change: 0.2 | |
| Week Change: 17.217% Year-to-date Change: 106.4% | |
| SA Links: Profile News Message Board | |
| Charts:- Daily , Weekly | |
| Add SA to Watchlist: View: Get Complete SA Trend Analysis ➞ | |
 | EQX Equinox Gold Corp |
| Sector: Materials | |
| SubSector: Gold | |
| MarketCap: 7422.92 Millions | |
| Recent Price: 10.93 Smart Investing & Trading Score: 50 | |
| Day Percent Change: 0.367309% Day Change: -0.24 | |
| Week Change: 4.19447% Year-to-date Change: 105.8% | |
| EQX Links: Profile News Message Board | |
| Charts:- Daily , Weekly | |
| Add EQX to Watchlist: View: Get Complete EQX Trend Analysis ➞ | |
 | AG First Majestic Silver Corporation |
| Sector: Materials | |
| SubSector: Silver | |
| MarketCap: 4434 Millions | |
| Recent Price: 12.06 Smart Investing & Trading Score: 60 | |
| Day Percent Change: -1.63132% Day Change: 0.18 | |
| Week Change: 5.69676% Year-to-date Change: 103.1% | |
| AG Links: Profile News Message Board | |
| Charts:- Daily , Weekly | |
| Add AG to Watchlist: View: Get Complete AG Trend Analysis ➞ | |
 | MUX McEwen Inc |
| Sector: Materials | |
| SubSector: Other Precious Metals & Mining | |
| MarketCap: 734.22 Millions | |
| Recent Price: 16.42 Smart Investing & Trading Score: 60 | |
| Day Percent Change: -2.14541% Day Change: 0.31 | |
| Week Change: 13.0076% Year-to-date Change: 98.8% | |
| MUX Links: Profile News Message Board | |
| Charts:- Daily , Weekly | |
| Add MUX to Watchlist: View: Get Complete MUX Trend Analysis ➞ | |
 | BTG B2gold Corp |
| Sector: Materials | |
| SubSector: Gold | |
| MarketCap: 5516.87 Millions | |
| Recent Price: 5.03 Smart Investing & Trading Score: 70 | |
| Day Percent Change: 0.6% Day Change: -0.13 | |
| Week Change: 3.71134% Year-to-date Change: 96.7% | |
| BTG Links: Profile News Message Board | |
| Charts:- Daily , Weekly | |
| Add BTG to Watchlist: View: Get Complete BTG Trend Analysis ➞ | |
 | TRX TRX Gold Corp |
| Sector: Materials | |
| SubSector: Gold | |
| MarketCap: 114.48 Millions | |
| Recent Price: 0.62 Smart Investing & Trading Score: 80 | |
| Day Percent Change: -1.2482% Day Change: 0.01 | |
| Week Change: 2.86714% Year-to-date Change: 95.5% | |
| TRX Links: Profile News Message Board | |
| Charts:- Daily , Weekly | |
| Add TRX to Watchlist: View: Get Complete TRX Trend Analysis ➞ | |
 | FSM Fortuna Mining Corp |
| Sector: Materials | |
| SubSector: Gold | |
| MarketCap: 2354.38 Millions | |
| Recent Price: 8.89 Smart Investing & Trading Score: 90 | |
| Day Percent Change: 0% Day Change: 0.26 | |
| Week Change: 5.58195% Year-to-date Change: 94.1% | |
| FSM Links: Profile News Message Board | |
| Charts:- Daily , Weekly | |
| Add FSM to Watchlist: View: Get Complete FSM Trend Analysis ➞ | |
 | TFPM Triple Flag Precious Metals Corp |
| Sector: Materials | |
| SubSector: Other Precious Metals & Mining | |
| MarketCap: 5850.14 Millions | |
| Recent Price: 29.42 Smart Investing & Trading Score: 60 | |
| Day Percent Change: -1.93333% Day Change: -1.54 | |
| Week Change: 6.13276% Year-to-date Change: 93.5% | |
| TFPM Links: Profile News Message Board | |
| Charts:- Daily , Weekly | |
| Add TFPM to Watchlist: View: Get Complete TFPM Trend Analysis ➞ | |
 | PLG Platinum Group Metals Ltd |
| Sector: Materials | |
| SubSector: Other Precious Metals & Mining | |
| MarketCap: 186.17 Millions | |
| Recent Price: 2.58 Smart Investing & Trading Score: 80 | |
| Day Percent Change: -2.64151% Day Change: 0.05 | |
| Week Change: 22.8571% Year-to-date Change: 91.1% | |
| PLG Links: Profile News Message Board | |
| Charts:- Daily , Weekly | |
| Add PLG to Watchlist: View: Get Complete PLG Trend Analysis ➞ | |
 | EXK Endeavour Silver Corp |
| Sector: Materials | |
| SubSector: Silver | |
| MarketCap: 1734.34 Millions | |
| Recent Price: 7.63 Smart Investing & Trading Score: 60 | |
| Day Percent Change: -1.54839% Day Change: 0.22 | |
| Week Change: 3.10811% Year-to-date Change: 90.8% | |
| EXK Links: Profile News Message Board | |
| Charts:- Daily , Weekly | |
| Add EXK to Watchlist: View: Get Complete EXK Trend Analysis ➞ | |
 | WPM Wheaton Precious Metals Corp |
| Sector: Materials | |
| SubSector: Gold | |
| MarketCap: 47319.8 Millions | |
| Recent Price: 109.83 Smart Investing & Trading Score: 40 | |
| Day Percent Change: -1.47125% Day Change: -5.03 | |
| Week Change: 4.29209% Year-to-date Change: 89.9% | |
| WPM Links: Profile News Message Board | |
| Charts:- Daily , Weekly | |
| Add WPM to Watchlist: View: Get Complete WPM Trend Analysis ➞ | |
 | EGO Eldorado Gold Corp |
| Sector: Materials | |
| SubSector: Gold | |
| MarketCap: 5307.58 Millions | |
| Recent Price: 29.23 Smart Investing & Trading Score: 60 | |
| Day Percent Change: -0.747029% Day Change: -1.13 | |
| Week Change: 4.20677% Year-to-date Change: 86.3% | |
| EGO Links: Profile News Message Board | |
| Charts:- Daily , Weekly | |
| Add EGO to Watchlist: View: Get Complete EGO Trend Analysis ➞ | |
 | PAAS Pan American Silver Corp |
| Sector: Materials | |
| SubSector: Gold | |
| MarketCap: 12518.3 Millions | |
| Recent Price: 39.19 Smart Investing & Trading Score: 70 | |
| Day Percent Change: -0.229124% Day Change: -1.55 | |
| Week Change: 7.69442% Year-to-date Change: 85.0% | |
| PAAS Links: Profile News Message Board | |
| Charts:- Daily , Weekly | |
| Add PAAS to Watchlist: View: Get Complete PAAS Trend Analysis ➞ | |
 | FNV Franco-Nevada Corporation |
| Sector: Materials | |
| SubSector: Gold | |
| MarketCap: 37343.3 Millions | |
| Recent Price: 217.54 Smart Investing & Trading Score: 60 | |
| Day Percent Change: -2.12804% Day Change: -9.89 | |
| Week Change: 3.76836% Year-to-date Change: 80.5% | |
| FNV Links: Profile News Message Board | |
| Charts:- Daily , Weekly | |
| Add FNV to Watchlist: View: Get Complete FNV Trend Analysis ➞ | |
 | NAK Northern Dynasty Minerals Ltd |
| Sector: Materials | |
| SubSector: Other Industrial Metals & Mining | |
| MarketCap: 455.23 Millions | |
| Recent Price: 1.22 Smart Investing & Trading Score: 70 | |
| Day Percent Change: 3.38983% Day Change: 0.03 | |
| Week Change: 11.9266% Year-to-date Change: 79.4% | |
| NAK Links: Profile News Message Board | |
| Charts:- Daily , Weekly | |
| Add NAK to Watchlist: View: Get Complete NAK Trend Analysis ➞ | |
 | AGI Alamos Gold Inc |
| Sector: Materials | |
| SubSector: Gold | |
| MarketCap: 13533.6 Millions | |
| Recent Price: 34.41 Smart Investing & Trading Score: 60 | |
| Day Percent Change: -1.93787% Day Change: -1.54 | |
| Week Change: 3.17841% Year-to-date Change: 79.0% | |
| AGI Links: Profile News Message Board | |
| Charts:- Daily , Weekly | |
| Add AGI to Watchlist: View: Get Complete AGI Trend Analysis ➞ | |
 | DC Dakota Gold Corp |
| Sector: Materials | |
| SubSector: Gold | |
| MarketCap: 498.81 Millions | |
| Recent Price: 4.55 Smart Investing & Trading Score: 46 | |
| Day Percent Change: 1.82% Day Change: 0.07 | |
| Week Change: -2.01% Year-to-date Change: 77.7% | |
| DC Links: Profile News Message Board | |
| Charts:- Daily , Weekly | |
| Add DC to Watchlist: View: Get Complete DC Trend Analysis ➞ | |
| For tabular summary view of above stock list: Summary View ➞ 0 - 25 , 25 - 50 , 50 - 75 , 75 - 100 , 100 - 125 , 125 - 150 , 150 - 175 , 175 - 200 , 200 - 225 , 225 - 250 , 250 - 275 | ||
| Click To Change The Sort Order: By Market Cap or Company Size Performance: Year-to-date, Week and Day | |
| Select Chart Type: | ||
|
Best Stocks Today 12Stocks.com |
© 2025 12Stocks.com Terms & Conditions Privacy Contact Us
All Information Provided Only For Education And Not To Be Used For Investing or Trading. See Terms & Conditions


One More Thing ... Get Best Stocks Delivered Daily!
Never Ever Miss A Move With Our Top Ten Stocks Lists
Find Best Stocks In Any Market - Bull or Bear Market
Take A Peek At Our Top Ten Stocks Lists: Daily, Weekly, Year-to-Date & Top Trends
Find Best Stocks In Any Market - Bull or Bear Market
Take A Peek At Our Top Ten Stocks Lists: Daily, Weekly, Year-to-Date & Top Trends
Materials Stocks With Best Up Trends [0-bearish to 100-bullish]: Livent [100], DuPont de[100], Turquoise Hill[100], Chemtura [100], Alcoa Corp[100], Steel Dynamics[100], Nevsun [100], Southern Copper[100], Hawkins [100], Iamgold Corp[100], Silvercorp Metals[100]
Best Materials Stocks Year-to-Date:
Americas Gold[892.308%], Avino Silver[437.523%], United States[334.104%], MP [332.947%], Vista Gold[273.653%], Gold [272.523%], Tower[254.565%], Ramaco [234.807%], Sibanye Stillwater[227.666%], SSR [227.298%], DRDGold .[211.911%] Best Materials Stocks This Week:
PolyOne [59833200%], Amyris [36360%], Chemtura [3703.85%], Golden Star[1837.95%], Alexco [690.301%], Hi-Crush Partners[626.496%], Yamana Gold[625.812%], Aluminum [516.255%], Monsanto [465.839%], Turquoise Hill[433.11%], Mechel PAO[418.222%] Best Materials Stocks Daily:
Livent [140.6%], Arch Coal[8.71849%], Celanese Corp[6.98937%], IperionX [5.96%], Nutrien [5.50945%], Sibanye Gold[5.06135%], Synalloy [5.05051%], MP [4.92385%], Westlake [4.05159%], CF Industries[3.94539%], Loma Negra[3.92707%]