
 Login Sign Up


| |||||
 |  | ||||

| 12Stocks.com Market Intelligence |
Best Materials Stocks
| In a hurry? Materials Stocks Lists: Performance Trends Table, Stock Charts
Sort Materials stocks: Daily, Weekly, Year-to-Date, Market Cap & Trends. Filter Materials stocks list by size: All Materials Large Mid-Range Small |
| 12Stocks.com Materials Stocks Performances & Trends Daily | |||||||||
|
|  The overall Smart Investing & Trading Score is 50 (0-bearish to 100-bullish) which puts Materials sector in short term neutral trend. The Smart Investing & Trading Score from previous trading session is 70 and a deterioration of trend continues.
| ||||||||
Here are the Smart Investing & Trading Scores of the most requested Materials stocks at 12Stocks.com (click stock name for detailed review):
|


| Consider signing up for our daily 12Stocks.com "Best Stocks Newsletter". You will never ever miss a big stock move again! |
| 12Stocks.com: Investing in Materials sector with Stocks | |
|
The following table helps investors and traders sort through current performance and trends (as measured by Smart Investing & Trading Score) of various
stocks in the Materials sector. Quick View: Move mouse or cursor over stock symbol (ticker) to view short-term Technical chart and over stock name to view long term chart. Click on  to add stock symbol to your watchlist and to add stock symbol to your watchlist and  to view watchlist. Click on any ticker or stock name for detailed market intelligence report for that stock. to view watchlist. Click on any ticker or stock name for detailed market intelligence report for that stock. |
12Stocks.com Performance of Stocks in Materials Sector
| Ticker | Stock Name | Watchlist | Category | Recent Price | Smart Investing & Trading Score | Change % | Weekly Change% |
| CLW | Clearwater Paper |   | Paper & Paper Products | 21.36 | 50 | -2.06% | -2.55% |
| WDFC | WD-40 Co | | Chemicals | 211.03 | 0 | -0.83% | -2.60% |
| BHP | BHP | | Other Industrial Metals & Mining | 54.07 | 70 | -0.26% | -2.66% |
| ASH | Ashland | | Chemicals | 52.77 | 30 | -3.51% | -2.71% |
| TMST | TimkenSteel | | Steel & Iron | 20.40 | 60 | 1.04% | -2.72% |
| SCL | Stepan Co | | Chemicals | 48.11 | 30 | -2.83% | -2.81% |
| CEIX | CONSOL Energy | | Metals/Minerals | 101.91 | 40 | 2.31% | -2.85% |
| METC | Ramaco | | Coking Coal | 24.25 | 50 | 0.25% | -2.92% |
| FCX | Freeport-McMoRan | | Copper | 44.72 | 60 | -2.61% | -2.93% |
| SMG | Scotts Miracle-Gro | | Agricultural Inputs | 60.75 | 0 | -1.56% | -3.06% |
| BCPC | Balchem Corp | | Chemicals | 156.34 | 20 | -1.90% | -3.14% |
| CINR | Ciner | | Metals/Minerals | 19.12 | 0 | -5.25% | -3.39% |
| MERC | Mercer | | Paper & Paper Products | 3.08 | 40 | -0.97% | -3.45% |
| KNF | Knife River | | Building Materials | 77.96 | 30 | 1.14% | -3.65% |
| IOSP | Innospec | | Chemicals | 82.69 | 10 | -1.15% | -3.69% |
| CMP | Compass Minerals | | Other Industrial Metals & Mining | 18.07 | 0 | -2.32% | -3.83% |
| UFPI | UFP Industries | | Lumber & Wood Production | 98.68 | 10 | -3.63% | -3.86% |
| ALB | Albemarle Corp | | Chemicals | 75.98 | 70 | 1.24% | -4.15% |
| NAK | Northern Dynasty | | Other Industrial Metals & Mining | 0.82 | 20 | 0.43% | -4.20% |
| REX | REX American | | Chemicals | 60.83 | 60 | -1.46% | -4.36% |
| SQM | Sociedad Quimica | | Chemicals | 41.97 | 60 | -1.50% | -5.17% |
| SXT | Sensient Technologies | | Chemicals | 106.42 | 10 | -1.03% | -5.68% |
| PAH | Platform Specialty | | Chemicals | 88.81 | 10 | 0.40% | -5.97% |
| SLVM | Sylvamo Corp | | Paper & Paper Products | 43.30 | 30 | -3.86% | -6.94% |
| ASTL | Algoma Steel | | Steel | 4.55 | 0 | -1.30% | -8.63% |
| For chart view version of above stock list: Chart View ➞ 0 - 25 , 25 - 50 , 50 - 75 , 75 - 100 , 100 - 125 , 125 - 150 , 150 - 175 , 175 - 200 , 200 - 225 , 225 - 250 , 250 - 275 | ||
 | Click To Change The Sort Order: By Market Cap or Company Size Performance: Year-to-date, Week and Day |  |
|
Get the most comprehensive stock market coverage daily at 12Stocks.com ➞ Best Stocks Today ➞ Best Stocks Weekly ➞ Best Stocks Year-to-Date ➞ Best Stocks Trends ➞  Best Stocks Today 12Stocks.com Best Nasdaq Stocks ➞ Best S&P 500 Stocks ➞ Best Tech Stocks ➞ Best Biotech Stocks ➞ |
| Detailed Overview of Materials Stocks |
| Materials Technical Overview, Leaders & Laggards, Top Materials ETF Funds & Detailed Materials Stocks List, Charts, Trends & More |
| Materials Sector: Technical Analysis, Trends & YTD Performance | |
| Materials sector is composed of stocks
from mining, metals, agricultural, precious metals
and chemical subsectors. Materials sector, as represented by XLB, an exchange-traded fund [ETF] that holds basket of Materials stocks (e.g, Dow Chemical, Newmont Mining) is up by 11.2678% and is currently underperforming the overall market by -1.5832% year-to-date. Below is a quick view of Technical charts and trends: |
|
 XLB Weekly Chart |
|
| Long Term Trend: Very Good | |
| Medium Term Trend: Not Good | |
 XLB Daily Chart |
|
| Short Term Trend: Good | |
| Overall Trend Score: 50 | |
| YTD Performance: 11.2678% | |
| **Trend Scores & Views Are Only For Educational Purposes And Not For Investing | |
| 12Stocks.com: Top Performing Materials Sector Stocks | ||||||||||||||||||||||||||||||||||||||||||||||||
 The top performing Materials sector stocks year to date are
Now, more recently, over last week, the top performing Materials sector stocks on the move are


|
||||||||||||||||||||||||||||||||||||||||||||||||
| 12Stocks.com: Investing in Materials Sector using Exchange Traded Funds | |
|
The following table shows list of key exchange traded funds (ETF) that
help investors track Materials Index. For detailed view, check out our ETF Funds section of our website. Quick View: Move mouse or cursor over ETF symbol (ticker) to view short-term Technical chart and over ETF name to view long term chart. Click on ticker or stock name for detailed view. Click on to add stock symbol to your watchlist and to view watchlist. |
12Stocks.com List of ETFs that track Materials Index
| Ticker | ETF Name | Watchlist | Recent Price | Smart Investing & Trading Score | Change % | Week % | Year-to-date % |
| JJC | Copper Sub | | 62.75 | 90 | 2.06571 | 220.808 | 0% |
| RTM | S&P 500 Eq | | 33.73 | 60 | 2.18116 | -0.295596 | 5.82027% |
| 12Stocks.com: Charts, Trends, Fundamental Data and Performances of Materials Stocks | |
|
We now take in-depth look at all Materials stocks including charts, multi-period performances and overall trends (as measured by Smart Investing & Trading Score). One can sort Materials stocks (click link to choose) by Daily, Weekly and by Year-to-Date performances. Also, one can sort by size of the company or by market capitalization. |
| Select Your Default Chart Type: | |||||
| |||||
| Click on stock symbol or name for detailed view. Click on to add stock symbol to your watchlist and to view watchlist. Quick View: Move mouse or cursor over "Daily" to quickly view daily Technical stock chart and over "Weekly" to view weekly Technical stock chart. | |||||

 | CLW Clearwater Paper Corp |
| Sector: Materials | |
| SubSector: Paper & Paper Products | |
| MarketCap: 354.45 Millions | |
| Recent Price: 21.36 Smart Investing & Trading Score: 50 | |
| Day Percent Change: -2.06327% Day Change: 0.16 | |
| Week Change: -2.55474% Year-to-date Change: -27.6% | |
| CLW Links: Profile News Message Board | |
| Charts:- Daily , Weekly | |
| Add CLW to Watchlist: View: Get Complete CLW Trend Analysis ➞ | |
 | WDFC WD-40 Co |
| Sector: Materials | |
| SubSector: Specialty Chemicals | |
| MarketCap: 2951.47 Millions | |
| Recent Price: 211.03 Smart Investing & Trading Score: 0 | |
| Day Percent Change: -0.831767% Day Change: -0.6 | |
| Week Change: -2.59854% Year-to-date Change: -10.9% | |
| WDFC Links: Profile News Message Board | |
| Charts:- Daily , Weekly | |
| Add WDFC to Watchlist: View: Get Complete WDFC Trend Analysis ➞ | |
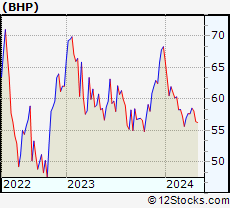 | BHP BHP Group Limited ADR |
| Sector: Materials | |
| SubSector: Other Industrial Metals & Mining | |
| MarketCap: 138102 Millions | |
| Recent Price: 54.07 Smart Investing & Trading Score: 70 | |
| Day Percent Change: -0.258255% Day Change: -0.08 | |
| Week Change: -2.66427% Year-to-date Change: 12.1% | |
| BHP Links: Profile News Message Board | |
| Charts:- Daily , Weekly | |
| Add BHP to Watchlist: View: Get Complete BHP Trend Analysis ➞ | |
 | ASH Ashland Inc |
| Sector: Materials | |
| SubSector: Specialty Chemicals | |
| MarketCap: 2509.71 Millions | |
| Recent Price: 52.77 Smart Investing & Trading Score: 30 | |
| Day Percent Change: -3.5107% Day Change: -1.47 | |
| Week Change: -2.71018% Year-to-date Change: -23.2% | |
| ASH Links: Profile News Message Board | |
| Charts:- Daily , Weekly | |
| Add ASH to Watchlist: View: Get Complete ASH Trend Analysis ➞ | |
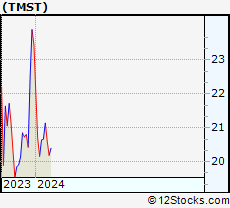 | TMST TimkenSteel Corporation |
| Sector: Materials | |
| SubSector: Steel & Iron | |
| MarketCap: 170.888 Millions | |
| Recent Price: 20.40 Smart Investing & Trading Score: 60 | |
| Day Percent Change: 1.04012% Day Change: -9999 | |
| Week Change: -2.71817% Year-to-date Change: 0.0% | |
| TMST Links: Profile News Message Board | |
| Charts:- Daily , Weekly | |
| Add TMST to Watchlist: View: Get Complete TMST Trend Analysis ➞ | |
 | SCL Stepan Co |
| Sector: Materials | |
| SubSector: Specialty Chemicals | |
| MarketCap: 1134.21 Millions | |
| Recent Price: 48.11 Smart Investing & Trading Score: 30 | |
| Day Percent Change: -2.82771% Day Change: 0.11 | |
| Week Change: -2.80808% Year-to-date Change: -22.8% | |
| SCL Links: Profile News Message Board | |
| Charts:- Daily , Weekly | |
| Add SCL to Watchlist: View: Get Complete SCL Trend Analysis ➞ | |
 | CEIX CONSOL Energy Inc. |
| Sector: Materials | |
| SubSector: Industrial Metals & Minerals | |
| MarketCap: 196.81 Millions | |
| Recent Price: 101.91 Smart Investing & Trading Score: 40 | |
| Day Percent Change: 2.30901% Day Change: -9999 | |
| Week Change: -2.85033% Year-to-date Change: -5.6% | |
| CEIX Links: Profile News Message Board | |
| Charts:- Daily , Weekly | |
| Add CEIX to Watchlist: View: Get Complete CEIX Trend Analysis ➞ | |
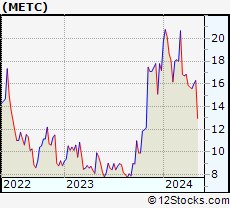 | METC Ramaco Resources Inc |
| Sector: Materials | |
| SubSector: Coking Coal | |
| MarketCap: 1726.47 Millions | |
| Recent Price: 24.25 Smart Investing & Trading Score: 50 | |
| Day Percent Change: 0.248036% Day Change: 1.05 | |
| Week Change: -2.92234% Year-to-date Change: 131.5% | |
| METC Links: Profile News Message Board | |
| Charts:- Daily , Weekly | |
| Add METC to Watchlist: View: Get Complete METC Trend Analysis ➞ | |
 | FCX Freeport-McMoRan Inc |
| Sector: Materials | |
| SubSector: Copper | |
| MarketCap: 66533.8 Millions | |
| Recent Price: 44.72 Smart Investing & Trading Score: 60 | |
| Day Percent Change: -2.61324% Day Change: -1.32 | |
| Week Change: -2.93032% Year-to-date Change: 19.4% | |
| FCX Links: Profile News Message Board | |
| Charts:- Daily , Weekly | |
| Add FCX to Watchlist: View: Get Complete FCX Trend Analysis ➞ | |
 | SMG Scotts Miracle-Gro Company |
| Sector: Materials | |
| SubSector: Agricultural Inputs | |
| MarketCap: 3639.84 Millions | |
| Recent Price: 60.75 Smart Investing & Trading Score: 0 | |
| Day Percent Change: -1.55566% Day Change: -0.88 | |
| Week Change: -3.06367% Year-to-date Change: -5.5% | |
| SMG Links: Profile News Message Board | |
| Charts:- Daily , Weekly | |
| Add SMG to Watchlist: View: Get Complete SMG Trend Analysis ➞ | |
 | BCPC Balchem Corp |
| Sector: Materials | |
| SubSector: Specialty Chemicals | |
| MarketCap: 5230.48 Millions | |
| Recent Price: 156.34 Smart Investing & Trading Score: 20 | |
| Day Percent Change: -1.89508% Day Change: 0.1 | |
| Week Change: -3.13507% Year-to-date Change: -1.4% | |
| BCPC Links: Profile News Message Board | |
| Charts:- Daily , Weekly | |
| Add BCPC to Watchlist: View: Get Complete BCPC Trend Analysis ➞ | |
 | CINR Ciner Resources LP |
| Sector: Materials | |
| SubSector: Industrial Metals & Minerals | |
| MarketCap: 210.41 Millions | |
| Recent Price: 19.12 Smart Investing & Trading Score: 0 | |
| Day Percent Change: -5.25273% Day Change: -9999 | |
| Week Change: -3.38555% Year-to-date Change: 0.0% | |
| CINR Links: Profile News Message Board | |
| Charts:- Daily , Weekly | |
| Add CINR to Watchlist: View: Get Complete CINR Trend Analysis ➞ | |
 | MERC Mercer International Inc |
| Sector: Materials | |
| SubSector: Paper & Paper Products | |
| MarketCap: 216.35 Millions | |
| Recent Price: 3.08 Smart Investing & Trading Score: 40 | |
| Day Percent Change: -0.970999% Day Change: 0.06 | |
| Week Change: -3.44828% Year-to-date Change: -50.2% | |
| MERC Links: Profile News Message Board | |
| Charts:- Daily , Weekly | |
| Add MERC to Watchlist: View: Get Complete MERC Trend Analysis ➞ | |
 | KNF Knife River Corp |
| Sector: Materials | |
| SubSector: Building Materials | |
| MarketCap: 4554.1 Millions | |
| Recent Price: 77.96 Smart Investing & Trading Score: 30 | |
| Day Percent Change: 1.14% Day Change: 0.99 | |
| Week Change: -3.65% Year-to-date Change: -13.7% | |
| KNF Links: Profile News Message Board | |
| Charts:- Daily , Weekly | |
| Add KNF to Watchlist: View: Get Complete KNF Trend Analysis ➞ | |
 | IOSP Innospec Inc |
| Sector: Materials | |
| SubSector: Specialty Chemicals | |
| MarketCap: 2128.7 Millions | |
| Recent Price: 82.69 Smart Investing & Trading Score: 10 | |
| Day Percent Change: -1.14764% Day Change: 0.34 | |
| Week Change: -3.69206% Year-to-date Change: -22.4% | |
| IOSP Links: Profile News Message Board | |
| Charts:- Daily , Weekly | |
| Add IOSP to Watchlist: View: Get Complete IOSP Trend Analysis ➞ | |
 | CMP Compass Minerals International Inc |
| Sector: Materials | |
| SubSector: Other Industrial Metals & Mining | |
| MarketCap: 784.16 Millions | |
| Recent Price: 18.07 Smart Investing & Trading Score: 0 | |
| Day Percent Change: -2.32432% Day Change: 0.29 | |
| Week Change: -3.83183% Year-to-date Change: 64.4% | |
| CMP Links: Profile News Message Board | |
| Charts:- Daily , Weekly | |
| Add CMP to Watchlist: View: Get Complete CMP Trend Analysis ➞ | |
 | UFPI UFP Industries Inc |
| Sector: Materials | |
| SubSector: Lumber & Wood Production | |
| MarketCap: 6268.39 Millions | |
| Recent Price: 98.68 Smart Investing & Trading Score: 10 | |
| Day Percent Change: -3.63281% Day Change: -0.17 | |
| Week Change: -3.85814% Year-to-date Change: -10.6% | |
| UFPI Links: Profile News Message Board | |
| Charts:- Daily , Weekly | |
| Add UFPI to Watchlist: View: Get Complete UFPI Trend Analysis ➞ | |
 | ALB Albemarle Corp |
| Sector: Materials | |
| SubSector: Specialty Chemicals | |
| MarketCap: 9595.87 Millions | |
| Recent Price: 75.98 Smart Investing & Trading Score: 70 | |
| Day Percent Change: 1.23917% Day Change: 0.43 | |
| Week Change: -4.15037% Year-to-date Change: -9.8% | |
| ALB Links: Profile News Message Board | |
| Charts:- Daily , Weekly | |
| Add ALB to Watchlist: View: Get Complete ALB Trend Analysis ➞ | |
 | NAK Northern Dynasty Minerals Ltd |
| Sector: Materials | |
| SubSector: Other Industrial Metals & Mining | |
| MarketCap: 455.23 Millions | |
| Recent Price: 0.82 Smart Investing & Trading Score: 20 | |
| Day Percent Change: 0.429448% Day Change: 0.03 | |
| Week Change: -4.20178% Year-to-date Change: 20.4% | |
| NAK Links: Profile News Message Board | |
| Charts:- Daily , Weekly | |
| Add NAK to Watchlist: View: Get Complete NAK Trend Analysis ➞ | |
 | REX REX American Resources Corp |
| Sector: Materials | |
| SubSector: Chemicals | |
| MarketCap: 1019.33 Millions | |
| Recent Price: 60.83 Smart Investing & Trading Score: 60 | |
| Day Percent Change: -1.45796% Day Change: 0.83 | |
| Week Change: -4.35535% Year-to-date Change: 42.4% | |
| REX Links: Profile News Message Board | |
| Charts:- Daily , Weekly | |
| Add REX to Watchlist: View: Get Complete REX Trend Analysis ➞ | |
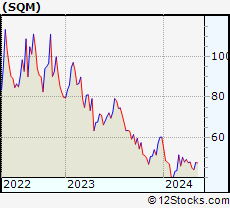 | SQM Sociedad Quimica Y Minera de Chile S.A. ADR |
| Sector: Materials | |
| SubSector: Specialty Chemicals | |
| MarketCap: 6549.73 Millions | |
| Recent Price: 41.97 Smart Investing & Trading Score: 60 | |
| Day Percent Change: -1.50199% Day Change: 0.89 | |
| Week Change: -5.17397% Year-to-date Change: 16.4% | |
| SQM Links: Profile News Message Board | |
| Charts:- Daily , Weekly | |
| Add SQM to Watchlist: View: Get Complete SQM Trend Analysis ➞ | |
 | SXT Sensient Technologies Corp |
| Sector: Materials | |
| SubSector: Specialty Chemicals | |
| MarketCap: 4791.88 Millions | |
| Recent Price: 106.42 Smart Investing & Trading Score: 10 | |
| Day Percent Change: -1.03227% Day Change: 0.74 | |
| Week Change: -5.68111% Year-to-date Change: 54.2% | |
| SXT Links: Profile News Message Board | |
| Charts:- Daily , Weekly | |
| Add SXT to Watchlist: View: Get Complete SXT Trend Analysis ➞ | |
 | PAH Platform Specialty Products Corporation |
| Sector: Materials | |
| SubSector: Specialty Chemicals | |
| MarketCap: 3602.95 Millions | |
| Recent Price: 88.81 Smart Investing & Trading Score: 10 | |
| Day Percent Change: 0.395659% Day Change: -9999 | |
| Week Change: -5.97141% Year-to-date Change: 0.0% | |
| PAH Links: Profile News Message Board | |
| Charts:- Daily , Weekly | |
| Add PAH to Watchlist: View: Get Complete PAH Trend Analysis ➞ | |
 | SLVM Sylvamo Corp |
| Sector: Materials | |
| SubSector: Paper & Paper Products | |
| MarketCap: 1832.11 Millions | |
| Recent Price: 43.30 Smart Investing & Trading Score: 30 | |
| Day Percent Change: -3.86% Day Change: -1.67 | |
| Week Change: -6.94% Year-to-date Change: -46.2% | |
| SLVM Links: Profile News Message Board | |
| Charts:- Daily , Weekly | |
| Add SLVM to Watchlist: View: Get Complete SLVM Trend Analysis ➞ | |
 | ASTL Algoma Steel Group Inc |
| Sector: Materials | |
| SubSector: Steel | |
| MarketCap: 538.29 Millions | |
| Recent Price: 4.55 Smart Investing & Trading Score: 0 | |
| Day Percent Change: -1.30152% Day Change: 0.22 | |
| Week Change: -8.63454% Year-to-date Change: -52.3% | |
| ASTL Links: Profile News Message Board | |
| Charts:- Daily , Weekly | |
| Add ASTL to Watchlist: View: Get Complete ASTL Trend Analysis ➞ | |
| For tabular summary view of above stock list: Summary View ➞ 0 - 25 , 25 - 50 , 50 - 75 , 75 - 100 , 100 - 125 , 125 - 150 , 150 - 175 , 175 - 200 , 200 - 225 , 225 - 250 , 250 - 275 | ||
| Click To Change The Sort Order: By Market Cap or Company Size Performance: Year-to-date, Week and Day | |
| Select Chart Type: | ||
|
Best Stocks Today 12Stocks.com |
© 2025 12Stocks.com Terms & Conditions Privacy Contact Us
All Information Provided Only For Education And Not To Be Used For Investing or Trading. See Terms & Conditions


One More Thing ... Get Best Stocks Delivered Daily!
Never Ever Miss A Move With Our Top Ten Stocks Lists
Find Best Stocks In Any Market - Bull or Bear Market
Take A Peek At Our Top Ten Stocks Lists: Daily, Weekly, Year-to-Date & Top Trends
Find Best Stocks In Any Market - Bull or Bear Market
Take A Peek At Our Top Ten Stocks Lists: Daily, Weekly, Year-to-Date & Top Trends
Materials Stocks With Best Up Trends [0-bearish to 100-bullish]: Livent [100], Vista Gold[100], TRX Gold[100], United States[100], Century Aluminum[100], Western Copper[100], U.S. Gold[100], Platinum [100], Cementos Pacasmayo[100], Turquoise Hill[100], Chemtura [100]
Best Materials Stocks Year-to-Date:
Americas Gold[633.333%], Avino Silver[351.726%], MP [287.492%], Gold [270.27%], Tower[236.518%], Vista Gold[218.04%], SSR [211.978%], Gold Royalty[207.258%], United States[184.971%], AngloGold Ashanti[179.141%], Gold Fields[172.347%] Best Materials Stocks This Week:
PolyOne [59833200%], Amyris [36360%], Chemtura [3703.85%], Golden Star[1837.95%], Alexco [690.301%], Hi-Crush Partners[626.496%], Yamana Gold[625.812%], Aluminum [516.255%], Monsanto [465.839%], Turquoise Hill[433.11%], Mechel PAO[418.222%] Best Materials Stocks Daily:
Livent [140.6%], Vista Gold[15.0943%], Grupo Simec[12.2572%], TRX Gold[10.4613%], Arch Coal[8.71849%], United States[7.40741%], Century Aluminum[6.40294%], IperionX [5.96%], Flexible [5.63991%], Sibanye Gold[5.06135%], Synalloy [5.05051%]