
 Login Sign Up


| |||||
 |  | ||||

| 12Stocks.com Market Intelligence |
Best Industrial Stocks
| In a hurry? Industrial Stocks Lists: Performance Trends Table, Stock Charts
Sort Industrial stocks: Daily, Weekly, Year-to-Date, Market Cap & Trends. Filter Industrial stocks list by size:All Industrial Large Mid-Range Small |
| 12Stocks.com Industrial Stocks Performances & Trends Daily | |||||||||
|
|  The overall Smart Investing & Trading Score is 80 (0-bearish to 100-bullish) which puts Industrial sector in short term neutral to bullish trend. The Smart Investing & Trading Score from previous trading session is 80 and an improvement of trend continues.
| ||||||||
Here are the Smart Investing & Trading Scores of the most requested Industrial stocks at 12Stocks.com (click stock name for detailed review):
|


| 12Stocks.com: Investing in Industrial sector with Stocks | |
|
The following table helps investors and traders sort through current performance and trends (as measured by Smart Investing & Trading Score) of various
stocks in the Industrial sector. Quick View: Move mouse or cursor over stock symbol (ticker) to view short-term Technical chart and over stock name to view long term chart. Click on  to add stock symbol to your watchlist and to add stock symbol to your watchlist and  to view watchlist. Click on any ticker or stock name for detailed market intelligence report for that stock. to view watchlist. Click on any ticker or stock name for detailed market intelligence report for that stock. |
12Stocks.com Performance of Stocks in Industrial Sector
| Ticker | Stock Name | Watchlist | Category | Recent Price | Smart Investing & Trading Score | Change % | YTD Change% |
| DHI | D.R. Horton |   | Residential | 165.55 | 100 | 3.46% | 19.44% |
| IEP | Icahn Enterprises | | Conglomerates | 9.32 | 50 | -32.44% | 19.27% |
| CPAC | Cementos Pacasmayo | | Cement | 6.22 | 30 | 1.44% | 18.93% |
| MLI | Mueller Industries | | Fabrication | 93.73 | 100 | 2.27% | 18.87% |
| CMI | Cummins | | Machinery | 406.80 | 100 | 1.23% | 17.92% |
| SSD | Simpson | | Small Tools & Accessories | 194.24 | 100 | 4.50% | 17.74% |
| POWL | Powell Industries | | Machinery | 259.71 | 80 | 8.51% | 17.50% |
| GHM | Graham | | Fabrication | 51.89 | 60 | 92.69% | 16.69% |
| RSG | Republic Services | | Waste Mgmt | 232.74 | 0 | -0.17% | 16.58% |
| BGC | General Cable | | Equipment | 10.48 | 70 | 0.00% | 16.16% |
| CAT | Caterpillar | | Machinery | 413.70 | 30 | 23.16% | 15.45% |
| VMC | Vulcan Materials | | Building Materials | 295.64 | 100 | 2.61% | 15.40% |
| GRC | Gorman-Rupp | | Machinery | 43.33 | 100 | 19.01% | 15.38% |
| PCH | PotlatchDeltic | | Lumber, Wood | 44.24 | 100 | 7.81% | 15.15% |
| TEX | Terex | | Machinery | 52.56 | 90 | -10.98% | 15.03% |
| WM | Waste Management | | Waste Mgmt | 229.90 | 10 | 31.40% | 14.75% |
| DCI | Donaldson | | Machinery | 75.72 | 100 | 19.22% | 13.83% |
| TKR | Timken | | Machine Tools | 80.39 | 80 | 2.74% | 13.66% |
| BDC | Belden | | Electrical Equipment | 127.61 | 80 | 2.64% | 13.43% |
| TMHC | Taylor Morrison | | Residential | 69.33 | 100 | 39.81% | 13.27% |
| BLDP | Ballard Power | | Electrical Equipment | 1.87 | 70 | -57.66% | 12.65% |
| TDG | TransDigm | | Aerospace/Defense | 1425.81 | 30 | 1.80% | 12.51% |
| TILE | Interface | | Textile Industrial | 27.23 | 100 | 5.76% | 11.94% |
| SXI | Standex | | Equipment | 208.12 | 100 | 2.93% | 11.91% |
| CVCO | Cavco Industries | | Residential | 495.53 | 100 | 4.85% | 11.05% |
| For chart view version of above stock list: Chart View ➞ 0 - 25 , 25 - 50 , 50 - 75 , 75 - 100 , 100 - 125 , 125 - 150 , 150 - 175 , 175 - 200 | ||
 | Click To Change The Sort Order: By Market Cap or Company Size Performance: Year-to-date, Week and Day |  |
|
Get the most comprehensive stock market coverage daily at 12Stocks.com ➞ Best Stocks Today ➞ Best Stocks Weekly ➞ Best Stocks Year-to-Date ➞ Best Stocks Trends ➞  Best Stocks Today 12Stocks.com Best Nasdaq Stocks ➞ Best S&P 500 Stocks ➞ Best Tech Stocks ➞ Best Biotech Stocks ➞ |
| Detailed Overview of Industrial Stocks |
| Industrial Technical Overview, Leaders & Laggards, Top Industrial ETF Funds & Detailed Industrial Stocks List, Charts, Trends & More |
| Industrial Sector: Technical Analysis, Trends & YTD Performance | |
| Industrial sector is composed of stocks
from industrial machinery, aerospace, defense, farm/construction
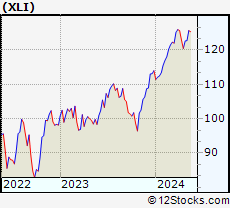
and industrial services subsectors. Industrial sector, as represented by XLI, an exchange-traded fund [ETF] that holds basket of Industrial stocks (e.g, Caterpillar, Boeing) is up by 16.43% and is currently outperforming the overall market by 6.1% year-to-date. Below is a quick view of Technical charts and trends: |
|
 XLI Weekly Chart |
|
| Long Term Trend: Very Good | |
| Medium Term Trend: Deteriorating | |
 XLI Daily Chart |
|
| Short Term Trend: Very Good | |
| Overall Trend Score: 80 | |
| YTD Performance: 16.43% | |
| **Trend Scores & Views Are Only For Educational Purposes And Not For Investing | |
| 12Stocks.com: Top Performing Industrial Sector Stocks | ||||||||||||||||||||||||||||||||||||||||||||||||
 The top performing Industrial sector stocks year to date are
Now, more recently, over last week, the top performing Industrial sector stocks on the move are


|
||||||||||||||||||||||||||||||||||||||||||||||||
| 12Stocks.com: Investing in Industrial Sector using Exchange Traded Funds | |
|
The following table shows list of key exchange traded funds (ETF) that
help investors track Industrial Index. For detailed view, check out our ETF Funds section of our website. Quick View: Move mouse or cursor over ETF symbol (ticker) to view short-term Technical chart and over ETF name to view long term chart. Click on ticker or stock name for detailed view. Click on to add stock symbol to your watchlist and to view watchlist. |
12Stocks.com List of ETFs that track Industrial Index
| Ticker | ETF Name | Watchlist | Recent Price | Smart Investing & Trading Score | Change % | Week % | Year-to-date % |
| XLI | Industrial | | 152.48 | 80 | 1.17 | 1.03 | 16.43% |
| UXI | Industrials | | 45.63 | 80 | 31.9 | 2 | 26.16% |
| PPA | Aerospace & Defense | | 147.94 | 70 | 0.64 | 0.39 | 29.15% |
| ITA | Aerospace & Defense | | 196.81 | 30 | 0.67 | -0.3 | 35.76% |
| ITB | Home Construction | | 111.20 | 100 | 4.39 | 7.99 | 9.08% |
| XHB | Homebuilders | | 115.73 | 100 | 4.45 | 8.64 | 11.28% |
| SIJ | Short Industrials | | 11.94 | 20 | -1.1 | -1.91 | -27.73% |
| IYJ | Industrials | | 145.69 | 80 | 1.02 | 1.74 | 9.55% |
| VIS | Industrials | | 292.48 | 80 | 19.27 | 1.49 | 15.62% |
| PSCI | SmallCap Industrials | | 149.28 | 100 | 2.89 | 5.67 | 11.45% |
| XAR | Aerospace & Defense | | 218.98 | 70 | 0.99 | 0.99 | 32.3% |
| 12Stocks.com: Charts, Trends, Fundamental Data and Performances of Industrial Stocks | |
|
We now take in-depth look at all Industrial stocks including charts, multi-period performances and overall trends (as measured by Smart Investing & Trading Score). One can sort Industrial stocks (click link to choose) by Daily, Weekly and by Year-to-Date performances. Also, one can sort by size of the company or by market capitalization. |
| Select Your Default Chart Type: | |||||
| |||||
| Click on stock symbol or name for detailed view. Click on to add stock symbol to your watchlist and to view watchlist. Quick View: Move mouse or cursor over "Daily" to quickly view daily Technical stock chart and over "Weekly" to view weekly Technical stock chart. | |||||

 | DHI D.R. Horton, Inc. |
| Sector: Industrials | |
| SubSector: Residential Construction | |
| MarketCap: 13372.6 Millions | |
| Recent Price: 165.55 Smart Investing & Trading Score: 100 | |
| Day Percent Change: 3.46% Day Change: 6.42 | |
| Week Change: 7.74% Year-to-date Change: 19.4% | |
| DHI Links: Profile News Message Board | |
| Charts:- Daily , Weekly | |
| Add DHI to Watchlist: View: Get Complete DHI Trend Analysis ➞ | |
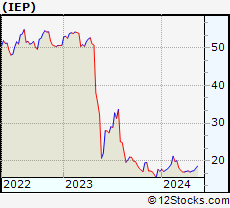 | IEP Icahn Enterprises L.P. |
| Sector: Industrials | |
| SubSector: Conglomerates | |
| MarketCap: 9969.88 Millions | |
| Recent Price: 9.32 Smart Investing & Trading Score: 50 | |
| Day Percent Change: -32.44% Day Change: -7.63 | |
| Week Change: 0.76% Year-to-date Change: 19.3% | |
| IEP Links: Profile News Message Board | |
| Charts:- Daily , Weekly | |
| Add IEP to Watchlist: View: Get Complete IEP Trend Analysis ➞ | |
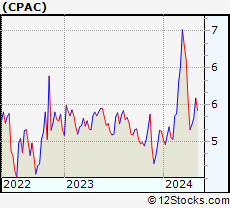 | CPAC Cementos Pacasmayo S.A.A. |
| Sector: Industrials | |
| SubSector: Cement | |
| MarketCap: 677.573 Millions | |
| Recent Price: 6.22 Smart Investing & Trading Score: 30 | |
| Day Percent Change: 1.44% Day Change: 0.08 | |
| Week Change: -0.96% Year-to-date Change: 18.9% | |
| CPAC Links: Profile News Message Board | |
| Charts:- Daily , Weekly | |
| Add CPAC to Watchlist: View: Get Complete CPAC Trend Analysis ➞ | |
 | MLI Mueller Industries, Inc. |
| Sector: Industrials | |
| SubSector: Metal Fabrication | |
| MarketCap: 1259.5 Millions | |
| Recent Price: 93.73 Smart Investing & Trading Score: 100 | |
| Day Percent Change: 2.27% Day Change: 1.57 | |
| Week Change: 7.33% Year-to-date Change: 18.9% | |
| MLI Links: Profile News Message Board | |
| Charts:- Daily , Weekly | |
| Add MLI to Watchlist: View: Get Complete MLI Trend Analysis ➞ | |
 | CMI Cummins Inc. |
| Sector: Industrials | |
| SubSector: Diversified Machinery | |
| MarketCap: 19127.1 Millions | |
| Recent Price: 406.80 Smart Investing & Trading Score: 100 | |
| Day Percent Change: 1.23% Day Change: 3.75 | |
| Week Change: 6.58% Year-to-date Change: 17.9% | |
| CMI Links: Profile News Message Board | |
| Charts:- Daily , Weekly | |
| Add CMI to Watchlist: View: Get Complete CMI Trend Analysis ➞ | |
 | SSD Simpson Manufacturing Co., Inc. |
| Sector: Industrials | |
| SubSector: Small Tools & Accessories | |
| MarketCap: 2850.16 Millions | |
| Recent Price: 194.24 Smart Investing & Trading Score: 100 | |
| Day Percent Change: 4.5% Day Change: 8.01 | |
| Week Change: 6.73% Year-to-date Change: 17.7% | |
| SSD Links: Profile News Message Board | |
| Charts:- Daily , Weekly | |
| Add SSD to Watchlist: View: Get Complete SSD Trend Analysis ➞ | |
 | POWL Powell Industries, Inc. |
| Sector: Industrials | |
| SubSector: Diversified Machinery | |
| MarketCap: 257.216 Millions | |
| Recent Price: 259.71 Smart Investing & Trading Score: 80 | |
| Day Percent Change: 8.51% Day Change: 15.12 | |
| Week Change: 13.99% Year-to-date Change: 17.5% | |
| POWL Links: Profile News Message Board | |
| Charts:- Daily , Weekly | |
| Add POWL to Watchlist: View: Get Complete POWL Trend Analysis ➞ | |
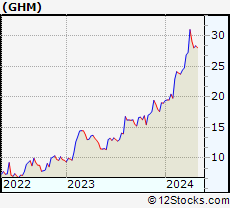 | GHM Graham Corporation |
| Sector: Industrials | |
| SubSector: Metal Fabrication | |
| MarketCap: 143.25 Millions | |
| Recent Price: 51.89 Smart Investing & Trading Score: 60 | |
| Day Percent Change: 92.69% Day Change: 14.96 | |
| Week Change: 5.73% Year-to-date Change: 16.7% | |
| GHM Links: Profile News Message Board | |
| Charts:- Daily , Weekly | |
| Add GHM to Watchlist: View: Get Complete GHM Trend Analysis ➞ | |
 | RSG Republic Services, Inc. |
| Sector: Industrials | |
| SubSector: Waste Management | |
| MarketCap: 26178.6 Millions | |
| Recent Price: 232.74 Smart Investing & Trading Score: 0 | |
| Day Percent Change: -0.17% Day Change: -0.36 | |
| Week Change: -1.18% Year-to-date Change: 16.6% | |
| RSG Links: Profile News Message Board | |
| Charts:- Daily , Weekly | |
| Add RSG to Watchlist: View: Get Complete RSG Trend Analysis ➞ | |
 | BGC General Cable Corporation |
| Sector: Industrials | |
| SubSector: Industrial Equipment & Components | |
| MarketCap: 850.79 Millions | |
| Recent Price: 10.48 Smart Investing & Trading Score: 70 | |
| Day Percent Change: 0% Day Change: 0 | |
| Week Change: 5.86% Year-to-date Change: 16.2% | |
| BGC Links: Profile News Message Board | |
| Charts:- Daily , Weekly | |
| Add BGC to Watchlist: View: Get Complete BGC Trend Analysis ➞ | |
 | CAT Caterpillar Inc. |
| Sector: Industrials | |
| SubSector: Farm & Construction Machinery | |
| MarketCap: 58636 Millions | |
| Recent Price: 413.70 Smart Investing & Trading Score: 30 | |
| Day Percent Change: 23.16% Day Change: 65.52 | |
| Week Change: -3.28% Year-to-date Change: 15.5% | |
| CAT Links: Profile News Message Board | |
| Charts:- Daily , Weekly | |
| Add CAT to Watchlist: View: Get Complete CAT Trend Analysis ➞ | |
 | VMC Vulcan Materials Company |
| Sector: Industrials | |
| SubSector: General Building Materials | |
| MarketCap: 12304.7 Millions | |
| Recent Price: 295.64 Smart Investing & Trading Score: 100 | |
| Day Percent Change: 2.61% Day Change: 6.49 | |
| Week Change: 4.99% Year-to-date Change: 15.4% | |
| VMC Links: Profile News Message Board | |
| Charts:- Daily , Weekly | |
| Add VMC to Watchlist: View: Get Complete VMC Trend Analysis ➞ | |
 | GRC The Gorman-Rupp Company |
| Sector: Industrials | |
| SubSector: Diversified Machinery | |
| MarketCap: 729.616 Millions | |
| Recent Price: 43.33 Smart Investing & Trading Score: 100 | |
| Day Percent Change: 19.01% Day Change: 6.28 | |
| Week Change: 3.44% Year-to-date Change: 15.4% | |
| GRC Links: Profile News Message Board | |
| Charts:- Daily , Weekly | |
| Add GRC to Watchlist: View: Get Complete GRC Trend Analysis ➞ | |
 | PCH PotlatchDeltic Corporation |
| Sector: Industrials | |
| SubSector: Lumber, Wood Production | |
| MarketCap: 2314.68 Millions | |
| Recent Price: 44.24 Smart Investing & Trading Score: 100 | |
| Day Percent Change: 7.81% Day Change: 3.2 | |
| Week Change: 3.44% Year-to-date Change: 15.2% | |
| PCH Links: Profile News Message Board | |
| Charts:- Daily , Weekly | |
| Add PCH to Watchlist: View: Get Complete PCH Trend Analysis ➞ | |
 | TEX Terex Corporation |
| Sector: Industrials | |
| SubSector: Farm & Construction Machinery | |
| MarketCap: 1083.07 Millions | |
| Recent Price: 52.56 Smart Investing & Trading Score: 90 | |
| Day Percent Change: -10.98% Day Change: -6.85 | |
| Week Change: 8.57% Year-to-date Change: 15.0% | |
| TEX Links: Profile News Message Board | |
| Charts:- Daily , Weekly | |
| Add TEX to Watchlist: View: Get Complete TEX Trend Analysis ➞ | |
 | WM Waste Management, Inc. |
| Sector: Industrials | |
| SubSector: Waste Management | |
| MarketCap: 46977.4 Millions | |
| Recent Price: 229.90 Smart Investing & Trading Score: 10 | |
| Day Percent Change: 31.4% Day Change: 50.18 | |
| Week Change: -0.73% Year-to-date Change: 14.8% | |
| WM Links: Profile News Message Board | |
| Charts:- Daily , Weekly | |
| Add WM to Watchlist: View: Get Complete WM Trend Analysis ➞ | |
 | DCI Donaldson Company, Inc. |
| Sector: Industrials | |
| SubSector: Diversified Machinery | |
| MarketCap: 4993.46 Millions | |
| Recent Price: 75.72 Smart Investing & Trading Score: 100 | |
| Day Percent Change: 19.22% Day Change: 12.06 | |
| Week Change: 5.43% Year-to-date Change: 13.8% | |
| DCI Links: Profile News Message Board | |
| Charts:- Daily , Weekly | |
| Add DCI to Watchlist: View: Get Complete DCI Trend Analysis ➞ | |
 | TKR The Timken Company |
| Sector: Industrials | |
| SubSector: Machine Tools & Accessories | |
| MarketCap: 2277.48 Millions | |
| Recent Price: 80.39 Smart Investing & Trading Score: 80 | |
| Day Percent Change: 2.74% Day Change: 2.26 | |
| Week Change: 9.27% Year-to-date Change: 13.7% | |
| TKR Links: Profile News Message Board | |
| Charts:- Daily , Weekly | |
| Add TKR to Watchlist: View: Get Complete TKR Trend Analysis ➞ | |
 | BDC Belden Inc. |
| Sector: Industrials | |
| SubSector: Industrial Electrical Equipment | |
| MarketCap: 1490.59 Millions | |
| Recent Price: 127.61 Smart Investing & Trading Score: 80 | |
| Day Percent Change: 2.64% Day Change: 2.75 | |
| Week Change: 10.41% Year-to-date Change: 13.4% | |
| BDC Links: Profile News Message Board | |
| Charts:- Daily , Weekly | |
| Add BDC to Watchlist: View: Get Complete BDC Trend Analysis ➞ | |
 | TMHC Taylor Morrison Home Corporation |
| Sector: Industrials | |
| SubSector: Residential Construction | |
| MarketCap: 1336.76 Millions | |
| Recent Price: 69.33 Smart Investing & Trading Score: 100 | |
| Day Percent Change: 39.81% Day Change: 19.55 | |
| Week Change: 7.41% Year-to-date Change: 13.3% | |
| TMHC Links: Profile News Message Board | |
| Charts:- Daily , Weekly | |
| Add TMHC to Watchlist: View: Get Complete TMHC Trend Analysis ➞ | |
 | BLDP Ballard Power Systems Inc. |
| Sector: Industrials | |
| SubSector: Industrial Electrical Equipment | |
| MarketCap: 2124.79 Millions | |
| Recent Price: 1.87 Smart Investing & Trading Score: 70 | |
| Day Percent Change: -57.66% Day Change: -2.71 | |
| Week Change: 2.19% Year-to-date Change: 12.7% | |
| BLDP Links: Profile News Message Board | |
| Charts:- Daily , Weekly | |
| Add BLDP to Watchlist: View: Get Complete BLDP Trend Analysis ➞ | |
 | TDG TransDigm Group Incorporated |
| Sector: Industrials | |
| SubSector: Aerospace/Defense Products & Services | |
| MarketCap: 18441 Millions | |
| Recent Price: 1425.81 Smart Investing & Trading Score: 30 | |
| Day Percent Change: 1.8% Day Change: 23.48 | |
| Week Change: 1.75% Year-to-date Change: 12.5% | |
| TDG Links: Profile News Message Board | |
| Charts:- Daily , Weekly | |
| Add TDG to Watchlist: View: Get Complete TDG Trend Analysis ➞ | |
 | TILE Interface, Inc. |
| Sector: Industrials | |
| SubSector: Textile Industrial | |
| MarketCap: 478 Millions | |
| Recent Price: 27.23 Smart Investing & Trading Score: 100 | |
| Day Percent Change: 5.76% Day Change: 1.02 | |
| Week Change: 5.91% Year-to-date Change: 11.9% | |
| TILE Links: Profile News Message Board | |
| Charts:- Daily , Weekly | |
| Add TILE to Watchlist: View: Get Complete TILE Trend Analysis ➞ | |
 | SXI Standex International Corporation |
| Sector: Industrials | |
| SubSector: Industrial Equipment & Components | |
| MarketCap: 644.109 Millions | |
| Recent Price: 208.12 Smart Investing & Trading Score: 100 | |
| Day Percent Change: 2.93% Day Change: 5.02 | |
| Week Change: 7.68% Year-to-date Change: 11.9% | |
| SXI Links: Profile News Message Board | |
| Charts:- Daily , Weekly | |
| Add SXI to Watchlist: View: Get Complete SXI Trend Analysis ➞ | |
 | CVCO Cavco Industries, Inc. |
| Sector: Industrials | |
| SubSector: Residential Construction | |
| MarketCap: 1375.86 Millions | |
| Recent Price: 495.53 Smart Investing & Trading Score: 100 | |
| Day Percent Change: 4.85% Day Change: 18.91 | |
| Week Change: 9.95% Year-to-date Change: 11.1% | |
| CVCO Links: Profile News Message Board | |
| Charts:- Daily , Weekly | |
| Add CVCO to Watchlist: View: Get Complete CVCO Trend Analysis ➞ | |
| For tabular summary view of above stock list: Summary View ➞ 0 - 25 , 25 - 50 , 50 - 75 , 75 - 100 , 100 - 125 , 125 - 150 , 150 - 175 , 175 - 200 | ||
| Click To Change The Sort Order: By Market Cap or Company Size Performance: Year-to-date, Week and Day | |
| Select Chart Type: | ||
|
Best Stocks Today 12Stocks.com |
© 2025 12Stocks.com Terms & Conditions Privacy Contact Us
All Information Provided Only For Education And Not To Be Used For Investing or Trading. See Terms & Conditions


One More Thing ... Get Best Stocks Delivered Daily!
Never Ever Miss A Move With Our Top Ten Stocks Lists
Find Best Stocks In Any Market - Bull or Bear Market
Take A Peek At Our Top Ten Stocks Lists: Daily, Weekly, Year-to-Date & Top Trends
Find Best Stocks In Any Market - Bull or Bear Market
Take A Peek At Our Top Ten Stocks Lists: Daily, Weekly, Year-to-Date & Top Trends
Industrial Stocks With Best Up Trends [0-bearish to 100-bullish]: Toll Brothers[100], Granite Construction[100], Armstrong World[100], Pulte [100], Generac [100], Eagle Materials[100], Taylor Morrison[100], Century Communities[100], Masco [100], EnPro Industries[100], Pentair [100]
Best Industrial Stocks Year-to-Date:
China Yuchai[215.15%], Tutor Perini[138.64%], American Superconductor[119.61%], Astronics [114.6%], Evolv Technologies[89.62%], Elbit Systems[79.41%], Sterling Construction[73.62%], IES [73.33%], Argan [68.62%], Comfort Systems[65.93%], AeroVironment [65.58%] Best Industrial Stocks This Week:
Hillenbrand [34.71%], Installed Building[28.67%], China Yuchai[24.26%], Tutor Perini[22.14%], Granite Construction[19.23%], Astec Industries[18.41%], Middleby [16.64%], CRH [16.44%], Compass Diversified[15.7%], Quanex Building[15.4%], United States[15.11%] Best Industrial Stocks Daily:
Embraer S.A[128.34%], Graham [92.69%], Argan [92.17%], AeroVironment [91.63%], Comfort Systems[86.98%], Toll Brothers[84.15%], Granite Construction[74.15%], Eastern [68.24%], Armstrong World[62.49%], Alpha Pro[60.2%], Pulte [57.11%]