
 Login Sign Up


| |||||
 |  | ||||

| 12Stocks.com Market Intelligence |
Best Industrial Stocks
| In a hurry? Industrial Stocks Lists: Performance Trends Table, Stock Charts
Sort Industrial stocks: Daily, Weekly, Year-to-Date, Market Cap & Trends. Filter Industrial stocks list by size:All Industrial Large Mid-Range Small |
| 12Stocks.com Industrial Stocks Performances & Trends Daily | |||||||||
|
|  The overall Smart Investing & Trading Score is 50 (0-bearish to 100-bullish) which puts Industrial sector in short term neutral trend. The Smart Investing & Trading Score from previous trading session is 50 and an improvement of trend continues.
| ||||||||
Here are the Smart Investing & Trading Scores of the most requested Industrial stocks at 12Stocks.com (click stock name for detailed review):
|

| 12Stocks.com: Investing in Industrial sector with Stocks | |
|
The following table helps investors and traders sort through current performance and trends (as measured by Smart Investing & Trading Score) of various
stocks in the Industrial sector. Quick View: Move mouse or cursor over stock symbol (ticker) to view short-term Technical chart and over stock name to view long term chart. Click on  to add stock symbol to your watchlist and to add stock symbol to your watchlist and  to view watchlist. Click on any ticker or stock name for detailed market intelligence report for that stock. to view watchlist. Click on any ticker or stock name for detailed market intelligence report for that stock. |
12Stocks.com Performance of Stocks in Industrial Sector
| Ticker | Stock Name | Watchlist | Category | Recent Price | Smart Investing & Trading Score | Change % | YTD Change% |
| ATRO | Astronics Corp |   | Aerospace & Defense | 38.68 | 100 | -0.97% | 144.97% |
| AMRC | Ameresco | | Engineering & Construction | 25.93 | 70 | -0.27% | 3.14% |
| BV | BrightView | | Specialty | 14.36 | 40 | -0.49% | -9.40% |
| DCO | Ducommun | | Aerospace & Defense | 90.45 | 30 | -1.01% | 42.24% |
| CVA | Covanta Holding | | Waste Mgmt | 50.32 | 60 | -15.80% | 0.00% |
| GEF.B | GREIF BROS-CL | | CONTNRS-PPR/PLS | 60.57 | 20 | -1.53% | 0.00% |
| CDRE | Cadre | | Aerospace & Defense | 32.00 | 73 | 1.26% | -7.48% |
| CRAI | CRA | | Consulting | 194.24 | 80 | -1.24% | 6.88% |
| LMB | Limbach | | Building Products & Equipment | 107.85 | 20 | -3.96% | 21.56% |
| PGEM | Ply Gem | | Building Materials | 128.45 | 80 | 0.61% | 0.00% |
| MCRN | Milacron | | Machinery | 199.54 | 0 | 0.95% | 0.00% |
| BBSI | Barrett Business | | Staffing & Employment | 48.14 | 50 | -2.09% | 12.45% |
| DOOR | Masonite | | Building Materials | 58.13 | 20 | 1.40% | 0.00% |
| BMCH | BMC Stock | | Building Materials | 5.53 | 10 | -0.18% | 0.00% |
| BECN | Beacon Roofing | | Building Materials | 124.17 | 60 | -0.02% | 23.58% |
| RDW | Redwire | | Aerospace & Defense | 8.32 | 10 | 1.34% | -51.17% |
| TASR | TASER | | Aerospace/Defense | 21.90 | 0 | -0.41% | 0.00% |
| PRLB | Proto Labs | | Fabrication | 49.93 | 70 | -0.54% | 28.85% |
| ALGT | Allegiant Travel | | Airlines | 64.53 | 70 | 0.40% | -29.82% |
| ULCC | Frontier | | Airlines | 5.18 | 60 | 0.00% | -28.35% |
| EVEX | Eve Holding | | Aerospace & Defense | 3.92 | 46 | -3.41% | -27.21% |
| AIMC | Altra | | Electrical Equipment | 126.05 | 100 | 1.19% | 0.00% |
| KAMN | Kaman | | Aerospace/Defense | 68.05 | 70 | -0.77% | 0.00% |
| SUM | Summit Materials | | Building Materials | 52.49 | 50 | 0.08% | 3.02% |
| GRC | Gorman-Rupp Co | | Specialty Industrial Machinery | 43.22 | 90 | 0.05% | 17.00% |
| For chart view version of above stock list: Chart View ➞ 0 - 25 , 25 - 50 , 50 - 75 , 75 - 100 , 100 - 125 , 125 - 150 , 150 - 175 , 175 - 200 , 200 - 225 , 225 - 250 , 250 - 275 , 275 - 300 , 300 - 325 , 325 - 350 , 350 - 375 , 375 - 400 , 400 - 425 , 425 - 450 , 450 - 475 , 475 - 500 , 500 - 525 | ||
 | Click To Change The Sort Order: By Market Cap or Company Size Performance: Year-to-date, Week and Day |  |
|
Get the most comprehensive stock market coverage daily at 12Stocks.com ➞ Best Stocks Today ➞ Best Stocks Weekly ➞ Best Stocks Year-to-Date ➞ Best Stocks Trends ➞  Best Stocks Today 12Stocks.com Best Nasdaq Stocks ➞ Best S&P 500 Stocks ➞ Best Tech Stocks ➞ Best Biotech Stocks ➞ |
| Detailed Overview of Industrial Stocks |
| Industrial Technical Overview, Leaders & Laggards, Top Industrial ETF Funds & Detailed Industrial Stocks List, Charts, Trends & More |
| Industrial Sector: Technical Analysis, Trends & YTD Performance | |
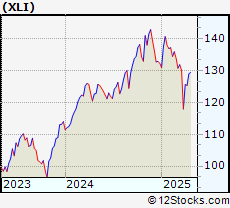
| Industrial sector is composed of stocks
from industrial machinery, aerospace, defense, farm/construction
and industrial services subsectors. Industrial sector, as represented by XLI, an exchange-traded fund [ETF] that holds basket of Industrial stocks (e.g, Caterpillar, Boeing) is up by 15.6543% and is currently outperforming the overall market by 4.4597% year-to-date. Below is a quick view of Technical charts and trends: |
|
 XLI Weekly Chart |
|
| Long Term Trend: Good | |
| Medium Term Trend: Good | |
 XLI Daily Chart |
|
| Short Term Trend: Good | |
| Overall Trend Score: 50 | |
| YTD Performance: 15.6543% | |
| **Trend Scores & Views Are Only For Educational Purposes And Not For Investing | |
| 12Stocks.com: Top Performing Industrial Sector Stocks | ||||||||||||||||||||||||||||||||||||||||||||||||
 The top performing Industrial sector stocks year to date are
Now, more recently, over last week, the top performing Industrial sector stocks on the move are


|
||||||||||||||||||||||||||||||||||||||||||||||||
| 12Stocks.com: Investing in Industrial Sector using Exchange Traded Funds | |
|
The following table shows list of key exchange traded funds (ETF) that
help investors track Industrial Index. For detailed view, check out our ETF Funds section of our website. Quick View: Move mouse or cursor over ETF symbol (ticker) to view short-term Technical chart and over ETF name to view long term chart. Click on ticker or stock name for detailed view. Click on to add stock symbol to your watchlist and to view watchlist. |
12Stocks.com List of ETFs that track Industrial Index
| Ticker | ETF Name | Watchlist | Recent Price | Smart Investing & Trading Score | Change % | Week % | Year-to-date % |
| CHII | China Industrials | | 9.80 | 20 | 0 | -0.0509944 | 0% |
| 12Stocks.com: Charts, Trends, Fundamental Data and Performances of Industrial Stocks | |
|
We now take in-depth look at all Industrial stocks including charts, multi-period performances and overall trends (as measured by Smart Investing & Trading Score). One can sort Industrial stocks (click link to choose) by Daily, Weekly and by Year-to-Date performances. Also, one can sort by size of the company or by market capitalization. |
| Select Your Default Chart Type: | |||||
| |||||
| Click on stock symbol or name for detailed view. Click on to add stock symbol to your watchlist and to view watchlist. Quick View: Move mouse or cursor over "Daily" to quickly view daily Technical stock chart and over "Weekly" to view weekly Technical stock chart. | |||||

 | ATRO Astronics Corp |
| Sector: Industrials | |
| SubSector: Aerospace & Defense | |
| MarketCap: 1368 Millions | |
| Recent Price: 38.68 Smart Investing & Trading Score: 100 | |
| Day Percent Change: -0.972862% Day Change: 1.19 | |
| Week Change: 5.88557% Year-to-date Change: 145.0% | |
| ATRO Links: Profile News Message Board | |
| Charts:- Daily , Weekly | |
| Add ATRO to Watchlist: View: Get Complete ATRO Trend Analysis ➞ | |
 | AMRC Ameresco Inc |
| Sector: Industrials | |
| SubSector: Engineering & Construction | |
| MarketCap: 1366.61 Millions | |
| Recent Price: 25.93 Smart Investing & Trading Score: 70 | |
| Day Percent Change: -0.269231% Day Change: 0.08 | |
| Week Change: 5.66422% Year-to-date Change: 3.1% | |
| AMRC Links: Profile News Message Board | |
| Charts:- Daily , Weekly | |
| Add AMRC to Watchlist: View: Get Complete AMRC Trend Analysis ➞ | |
 | BV BrightView Holdings Inc |
| Sector: Industrials | |
| SubSector: Specialty Business Services | |
| MarketCap: 1362.76 Millions | |
| Recent Price: 14.36 Smart Investing & Trading Score: 40 | |
| Day Percent Change: -0.4851% Day Change: 0.17 | |
| Week Change: -3.2345% Year-to-date Change: -9.4% | |
| BV Links: Profile News Message Board | |
| Charts:- Daily , Weekly | |
| Add BV to Watchlist: View: Get Complete BV Trend Analysis ➞ | |
 | DCO Ducommun Inc |
| Sector: Industrials | |
| SubSector: Aerospace & Defense | |
| MarketCap: 1349.85 Millions | |
| Recent Price: 90.45 Smart Investing & Trading Score: 30 | |
| Day Percent Change: -1.0069% Day Change: 1.54 | |
| Week Change: -1.90869% Year-to-date Change: 42.2% | |
| DCO Links: Profile News Message Board | |
| Charts:- Daily , Weekly | |
| Add DCO to Watchlist: View: Get Complete DCO Trend Analysis ➞ | |
 | CVA Covanta Holding Corporation |
| Sector: Industrials | |
| SubSector: Waste Management | |
| MarketCap: 1344.88 Millions | |
| Recent Price: 50.32 Smart Investing & Trading Score: 60 | |
| Day Percent Change: -15.7965% Day Change: -9999 | |
| Week Change: 148.617% Year-to-date Change: 0.0% | |
| CVA Links: Profile News Message Board | |
| Charts:- Daily , Weekly | |
| Add CVA to Watchlist: View: Get Complete CVA Trend Analysis ➞ | |
 | GEF.B GREIF BROS-CL B |
| Sector: Industrials | |
| SubSector: CONTNRS-PPR/PLS | |
| MarketCap: 1305.31 Millions | |
| Recent Price: 60.57 Smart Investing & Trading Score: 20 | |
| Day Percent Change: -1.52821% Day Change: -9999 | |
| Week Change: -3.79606% Year-to-date Change: 0.0% | |
| GEF.B Links: Profile News Message Board | |
| Charts:- Daily , Weekly | |
| Add GEF.B to Watchlist: View: Get Complete GEF.B Trend Analysis ➞ | |
 | CDRE Cadre Holdings Inc |
| Sector: Industrials | |
| SubSector: Aerospace & Defense | |
| MarketCap: 1301.24 Millions | |
| Recent Price: 32.00 Smart Investing & Trading Score: 73 | |
| Day Percent Change: 1.26% Day Change: 0.37 | |
| Week Change: 1.4% Year-to-date Change: -7.5% | |
| CDRE Links: Profile News Message Board | |
| Charts:- Daily , Weekly | |
| Add CDRE to Watchlist: View: Get Complete CDRE Trend Analysis ➞ | |
 | CRAI CRA International Inc |
| Sector: Industrials | |
| SubSector: Consulting Services | |
| MarketCap: 1278.89 Millions | |
| Recent Price: 194.24 Smart Investing & Trading Score: 80 | |
| Day Percent Change: -1.24059% Day Change: 1.55 | |
| Week Change: -3.06902% Year-to-date Change: 6.9% | |
| CRAI Links: Profile News Message Board | |
| Charts:- Daily , Weekly | |
| Add CRAI to Watchlist: View: Get Complete CRAI Trend Analysis ➞ | |
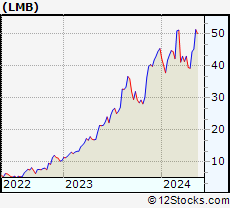 | LMB Limbach Holdings Inc |
| Sector: Industrials | |
| SubSector: Building Products & Equipment | |
| MarketCap: 1253.95 Millions | |
| Recent Price: 107.85 Smart Investing & Trading Score: 20 | |
| Day Percent Change: -3.9626% Day Change: 1.8 | |
| Week Change: -14.33% Year-to-date Change: 21.6% | |
| LMB Links: Profile News Message Board | |
| Charts:- Daily , Weekly | |
| Add LMB to Watchlist: View: Get Complete LMB Trend Analysis ➞ | |
 | PGEM Ply Gem Holdings, Inc |
| Sector: Industrials | |
| SubSector: General Building Materials | |
| MarketCap: 1251.83 Millions | |
| Recent Price: 128.45 Smart Investing & Trading Score: 80 | |
| Day Percent Change: 0.61095% Day Change: -9999 | |
| Week Change: 41.4648% Year-to-date Change: 0.0% | |
| PGEM Links: Profile News Message Board | |
| Charts:- Daily , Weekly | |
| Add PGEM to Watchlist: View: Get Complete PGEM Trend Analysis ➞ | |
 | MCRN Milacron Holdings Corp. |
| Sector: Industrials | |
| SubSector: Diversified Machinery | |
| MarketCap: 1240.92 Millions | |
| Recent Price: 199.54 Smart Investing & Trading Score: 0 | |
| Day Percent Change: 0.946021% Day Change: -9999 | |
| Week Change: -6.56927% Year-to-date Change: 0.0% | |
| MCRN Links: Profile News Message Board | |
| Charts:- Daily , Weekly | |
| Add MCRN to Watchlist: View: Get Complete MCRN Trend Analysis ➞ | |
 | BBSI Barrett Business Services Inc |
| Sector: Industrials | |
| SubSector: Staffing & Employment Services | |
| MarketCap: 1236.7 Millions | |
| Recent Price: 48.14 Smart Investing & Trading Score: 50 | |
| Day Percent Change: -2.09477% Day Change: -0.1 | |
| Week Change: -0.70132% Year-to-date Change: 12.4% | |
| BBSI Links: Profile News Message Board | |
| Charts:- Daily , Weekly | |
| Add BBSI to Watchlist: View: Get Complete BBSI Trend Analysis ➞ | |
 | DOOR Masonite International Corporation |
| Sector: Industrials | |
| SubSector: General Building Materials | |
| MarketCap: 1220.53 Millions | |
| Recent Price: 58.13 Smart Investing & Trading Score: 20 | |
| Day Percent Change: 1.39543% Day Change: -9999 | |
| Week Change: -56.2406% Year-to-date Change: 0.0% | |
| DOOR Links: Profile News Message Board | |
| Charts:- Daily , Weekly | |
| Add DOOR to Watchlist: View: Get Complete DOOR Trend Analysis ➞ | |
 | BMCH BMC Stock Holdings, Inc. |
| Sector: Industrials | |
| SubSector: General Building Materials | |
| MarketCap: 1216.93 Millions | |
| Recent Price: 5.53 Smart Investing & Trading Score: 10 | |
| Day Percent Change: -0.180505% Day Change: -9999 | |
| Week Change: -20.7736% Year-to-date Change: 0.0% | |
| BMCH Links: Profile News Message Board | |
| Charts:- Daily , Weekly | |
| Add BMCH to Watchlist: View: Get Complete BMCH Trend Analysis ➞ | |
 | BECN Beacon Roofing Supply, Inc. |
| Sector: Industrials | |
| SubSector: General Building Materials | |
| MarketCap: 1210.13 Millions | |
| Recent Price: 124.17 Smart Investing & Trading Score: 60 | |
| Day Percent Change: -0.0161044% Day Change: -9999 | |
| Week Change: 0.258377% Year-to-date Change: 23.6% | |
| BECN Links: Profile News Message Board | |
| Charts:- Daily , Weekly | |
| Add BECN to Watchlist: View: Get Complete BECN Trend Analysis ➞ | |
 | RDW Redwire Corporation |
| Sector: Industrials | |
| SubSector: Aerospace & Defense | |
| MarketCap: 1198.41 Millions | |
| Recent Price: 8.32 Smart Investing & Trading Score: 10 | |
| Day Percent Change: 1.33983% Day Change: 0 | |
| Week Change: -7.45273% Year-to-date Change: -51.2% | |
| RDW Links: Profile News Message Board | |
| Charts:- Daily , Weekly | |
| Add RDW to Watchlist: View: Get Complete RDW Trend Analysis ➞ | |
 | TASR TASER International, Inc. |
| Sector: Industrials | |
| SubSector: Aerospace/Defense Products & Services | |
| MarketCap: 1196.75 Millions | |
| Recent Price: 21.90 Smart Investing & Trading Score: 0 | |
| Day Percent Change: -0.409277% Day Change: -9999 | |
| Week Change: -3.90522% Year-to-date Change: 0.0% | |
| TASR Links: Profile News Message Board | |
| Charts:- Daily , Weekly | |
| Add TASR to Watchlist: View: Get Complete TASR Trend Analysis ➞ | |
 | PRLB Proto Labs Inc |
| Sector: Industrials | |
| SubSector: Metal Fabrication | |
| MarketCap: 1192.07 Millions | |
| Recent Price: 49.93 Smart Investing & Trading Score: 70 | |
| Day Percent Change: -0.537849% Day Change: 0.56 | |
| Week Change: -1.78993% Year-to-date Change: 28.9% | |
| PRLB Links: Profile News Message Board | |
| Charts:- Daily , Weekly | |
| Add PRLB to Watchlist: View: Get Complete PRLB Trend Analysis ➞ | |
 | ALGT Allegiant Travel |
| Sector: Industrials | |
| SubSector: Airlines | |
| MarketCap: 1184.14 Millions | |
| Recent Price: 64.53 Smart Investing & Trading Score: 70 | |
| Day Percent Change: 0.404543% Day Change: -0.04 | |
| Week Change: 3.23148% Year-to-date Change: -29.8% | |
| ALGT Links: Profile News Message Board | |
| Charts:- Daily , Weekly | |
| Add ALGT to Watchlist: View: Get Complete ALGT Trend Analysis ➞ | |
 | ULCC Frontier Group Holdings Inc |
| Sector: Industrials | |
| SubSector: Airlines | |
| MarketCap: 1181.85 Millions | |
| Recent Price: 5.18 Smart Investing & Trading Score: 60 | |
| Day Percent Change: 0% Day Change: -0.11 | |
| Week Change: 8.14196% Year-to-date Change: -28.4% | |
| ULCC Links: Profile News Message Board | |
| Charts:- Daily , Weekly | |
| Add ULCC to Watchlist: View: Get Complete ULCC Trend Analysis ➞ | |
 | EVEX Eve Holding Inc |
| Sector: Industrials | |
| SubSector: Aerospace & Defense | |
| MarketCap: 1179.46 Millions | |
| Recent Price: 3.92 Smart Investing & Trading Score: 46 | |
| Day Percent Change: -3.41% Day Change: -0.14 | |
| Week Change: -10.41% Year-to-date Change: -27.2% | |
| EVEX Links: Profile News Message Board | |
| Charts:- Daily , Weekly | |
| Add EVEX to Watchlist: View: Get Complete EVEX Trend Analysis ➞ | |
 | AIMC Altra Industrial Motion Corp. |
| Sector: Industrials | |
| SubSector: Industrial Electrical Equipment | |
| MarketCap: 1169.99 Millions | |
| Recent Price: 126.05 Smart Investing & Trading Score: 100 | |
| Day Percent Change: 1.18809% Day Change: -9999 | |
| Week Change: 103.372% Year-to-date Change: 0.0% | |
| AIMC Links: Profile News Message Board | |
| Charts:- Daily , Weekly | |
| Add AIMC to Watchlist: View: Get Complete AIMC Trend Analysis ➞ | |
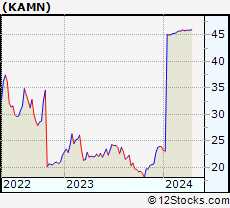 | KAMN Kaman Corporation |
| Sector: Industrials | |
| SubSector: Aerospace/Defense Products & Services | |
| MarketCap: 1154.01 Millions | |
| Recent Price: 68.05 Smart Investing & Trading Score: 70 | |
| Day Percent Change: -0.77282% Day Change: -9999 | |
| Week Change: 48.354% Year-to-date Change: 0.0% | |
| KAMN Links: Profile News Message Board | |
| Charts:- Daily , Weekly | |
| Add KAMN to Watchlist: View: Get Complete KAMN Trend Analysis ➞ | |
 | SUM Summit Materials, Inc. |
| Sector: Industrials | |
| SubSector: General Building Materials | |
| MarketCap: 1138.23 Millions | |
| Recent Price: 52.49 Smart Investing & Trading Score: 50 | |
| Day Percent Change: 0.0762631% Day Change: -9999 | |
| Week Change: 0.344102% Year-to-date Change: 3.0% | |
| SUM Links: Profile News Message Board | |
| Charts:- Daily , Weekly | |
| Add SUM to Watchlist: View: Get Complete SUM Trend Analysis ➞ | |
 | GRC Gorman-Rupp Co |
| Sector: Industrials | |
| SubSector: Specialty Industrial Machinery | |
| MarketCap: 1137.24 Millions | |
| Recent Price: 43.22 Smart Investing & Trading Score: 90 | |
| Day Percent Change: 0.0462963% Day Change: 0 | |
| Week Change: 0.39489% Year-to-date Change: 17.0% | |
| GRC Links: Profile News Message Board | |
| Charts:- Daily , Weekly | |
| Add GRC to Watchlist: View: Get Complete GRC Trend Analysis ➞ | |
| For tabular summary view of above stock list: Summary View ➞ 0 - 25 , 25 - 50 , 50 - 75 , 75 - 100 , 100 - 125 , 125 - 150 , 150 - 175 , 175 - 200 , 200 - 225 , 225 - 250 , 250 - 275 , 275 - 300 , 300 - 325 , 325 - 350 , 350 - 375 , 375 - 400 , 400 - 425 , 425 - 450 , 450 - 475 , 475 - 500 , 500 - 525 | ||
| Click To Change The Sort Order: By Market Cap or Company Size Performance: Year-to-date, Week and Day | |
| Select Chart Type: | ||
|
Best Stocks Today 12Stocks.com |
© 2025 12Stocks.com Terms & Conditions Privacy Contact Us
All Information Provided Only For Education And Not To Be Used For Investing or Trading. See Terms & Conditions


One More Thing ... Get Best Stocks Delivered Daily!
Never Ever Miss A Move With Our Top Ten Stocks Lists
Find Best Stocks In Any Market - Bull or Bear Market
Take A Peek At Our Top Ten Stocks Lists: Daily, Weekly, Year-to-Date & Top Trends
Find Best Stocks In Any Market - Bull or Bear Market
Take A Peek At Our Top Ten Stocks Lists: Daily, Weekly, Year-to-Date & Top Trends
Industrial Stocks With Best Up Trends [0-bearish to 100-bullish]: Brooge [100], CryoPort [100], Concrete Pumping[100], Mirion Technologies[100], Herc [100], Stanley Black[100], JELD-WEN Holding[100], Builders Firstsource[100], Bloom Energy[100], SiteOne Landscape[100], Embraer S.A.[100]
Best Industrial Stocks Year-to-Date:
Triumph [1432.18%], Tecogen [486.452%], GrafTech [476.744%], Power [197.092%], Lightbridge Corp[179.02%], Willdan [162.367%], Tutor Perini[159.23%], Kratos Defense[145.679%], Astronics Corp[144.965%], Bloom Energy[144.202%], Amprius Technologies[142.5%] Best Industrial Stocks This Week:
TRC [10149.1%], Advanced Emissions[3571.78%], L3 Technologies[1915.25%], Forterra [1845.47%], GrafTech [896.885%], KLX [437.488%], Allegro Merger[402.182%], LMI Aerospace[291.621%], Chicago Bridge[205.472%], Covanta Holding[148.617%], MOOG [148.377%] Best Industrial Stocks Daily:
Brooge [29.5547%], CryoPort [16.9492%], Concrete Pumping[12.188%], Tecogen [10.989%], Mirion Technologies[9.09957%], B/E Aerospace[8.86381%], Ballard Power[7.56757%], Hurco [7.494%], GrafTech [7.35931%], Herc [7.34109%], Symbotic [6.70057%]