
 Login Sign Up


| |||||
 |  | ||||

| 12Stocks.com Market Intelligence |
Best Industrial Stocks
| In a hurry? Industrial Stocks Lists: Performance Trends Table, Stock Charts
Sort Industrial stocks: Daily, Weekly, Year-to-Date, Market Cap & Trends. Filter Industrial stocks list by size:All Industrial Large Mid-Range Small |
| 12Stocks.com Industrial Stocks Performances & Trends Daily | |||||||||
|
|  The overall Smart Investing & Trading Score is 30 (0-bearish to 100-bullish) which puts Industrial sector in short term bearish to neutral trend. The Smart Investing & Trading Score from previous trading session is 60 and hence a deterioration of trend.
| ||||||||
Here are the Smart Investing & Trading Scores of the most requested Industrial stocks at 12Stocks.com (click stock name for detailed review):
|


| 12Stocks.com: Investing in Industrial sector with Stocks | |
|
The following table helps investors and traders sort through current performance and trends (as measured by Smart Investing & Trading Score) of various
stocks in the Industrial sector. Quick View: Move mouse or cursor over stock symbol (ticker) to view short-term Technical chart and over stock name to view long term chart. Click on  to add stock symbol to your watchlist and to add stock symbol to your watchlist and  to view watchlist. Click on any ticker or stock name for detailed market intelligence report for that stock. to view watchlist. Click on any ticker or stock name for detailed market intelligence report for that stock. |
12Stocks.com Performance of Stocks in Industrial Sector
| Ticker | Stock Name | Watchlist | Category | Recent Price | Smart Investing & Trading Score | Change % | YTD Change% |
| HI | Hillenbrand |   | Machinery | 25.17 | 100 | 2.66% | -12.51% |
| FLR | Fluor | | Heavy Construction | 41.88 | 10 | 40.21% | -13.52% |
| GENC | Gencor Industries | | Machinery | 15.24 | 50 | 32.72% | -13.77% |
| BOOM | DMC Global | | Fabrication | 6.23 | 20 | 6.63% | -14.83% |
| SKY | Skyline Champion | | Manufactured Housing | 73.17 | 90 | 36.51% | -15.57% |
| TH | Target Hospitality | | Conglomerates | 8.00 | 40 | 2.30% | -16.61% |
| OFLX | Omega Flex | | Equipment | 32.87 | 50 | 2.82% | -16.84% |
| AIN | Albany | | Textile Industrial | 62.94 | 30 | 2.15% | -17.60% |
| IEX | IDEX | | Machinery | 164.77 | 30 | -8.93% | -18.14% |
| NESR | National Energy | | Conglomerates | 6.96 | 50 | -2.38% | -20.76% |
| PLUG | Plug Power | | Electrical Equipment | 1.70 | 80 | -79.84% | -22.07% |
| AMN | AMN Healthcare | | Building Materials | 18.92 | 70 | 5.41% | -22.07% |
| TWIN | Twin Disc | | Machinery | 8.50 | 20 | 5.18% | -22.93% |
| HYFM | Hydrofarm | | Farm & Heavy Construction Machinery | 4.51 | 60 | 1.64% | -23.45% |
| YGMZ | MingZhu Logistics | | Trucking | 0.80 | 20 | 5.66% | -23.99% |
| AAON | AAON | | Building Materials | 79.55 | 20 | 1.91% | -24.80% |
| NNBR | NN | | Machine Tools | 2.30 | 50 | 4.77% | -25.08% |
| ADSE | ADS-TEC Energy | | Electrical Equipment & Parts | 11.75 | 60 | 1.51% | -25.21% |
| EAF | GrafTech | | Machinery | 1.28 | 60 | -82.91% | -25.43% |
| BCC | Boise Cascade | | Lumber, Wood | 85.99 | 60 | 6.85% | -25.51% |
| JELD | JELD-WEN Holding | | Building Materials | 5.78 | 100 | -11.25% | -26.86% |
| UFI | Unifi | | Textile Industrial | 4.40 | 10 | -4.35% | -27.68% |
| ATKR | Atkore | | Electrical Equipment | 57.86 | 10 | -33.93% | -28.43% |
| CNR | Cornerstone Building | | Building Materials | 71.00 | 10 | 0.00% | -29.73% |
| CULP | Culp | | Textile Industrial | 4.06 | 0 | 1.46% | -29.81% |
| For chart view version of above stock list: Chart View ➞ 0 - 25 , 25 - 50 , 50 - 75 , 75 - 100 , 100 - 125 , 125 - 150 , 150 - 175 , 175 - 200 , 200 - 225 , 225 - 250 , 250 - 275 , 275 - 300 | ||
 | Click To Change The Sort Order: By Market Cap or Company Size Performance: Year-to-date, Week and Day |  |
|
Get the most comprehensive stock market coverage daily at 12Stocks.com ➞ Best Stocks Today ➞ Best Stocks Weekly ➞ Best Stocks Year-to-Date ➞ Best Stocks Trends ➞  Best Stocks Today 12Stocks.com Best Nasdaq Stocks ➞ Best S&P 500 Stocks ➞ Best Tech Stocks ➞ Best Biotech Stocks ➞ |
| Detailed Overview of Industrial Stocks |
| Industrial Technical Overview, Leaders & Laggards, Top Industrial ETF Funds & Detailed Industrial Stocks List, Charts, Trends & More |
| Industrial Sector: Technical Analysis, Trends & YTD Performance | |
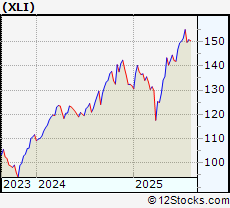
| Industrial sector is composed of stocks
from industrial machinery, aerospace, defense, farm/construction
and industrial services subsectors. Industrial sector, as represented by XLI, an exchange-traded fund [ETF] that holds basket of Industrial stocks (e.g, Caterpillar, Boeing) is up by 16.43% and is currently outperforming the overall market by 6.1% year-to-date. Below is a quick view of Technical charts and trends: |
|
 XLI Weekly Chart |
|
| Long Term Trend: Very Good | |
| Medium Term Trend: Deteriorating | |
 XLI Daily Chart |
|
| Short Term Trend: Not Good | |
| Overall Trend Score: 30 | |
| YTD Performance: 16.43% | |
| **Trend Scores & Views Are Only For Educational Purposes And Not For Investing | |
| 12Stocks.com: Top Performing Industrial Sector Stocks | ||||||||||||||||||||||||||||||||||||||||||||||||
 The top performing Industrial sector stocks year to date are
Now, more recently, over last week, the top performing Industrial sector stocks on the move are


|
||||||||||||||||||||||||||||||||||||||||||||||||
| 12Stocks.com: Investing in Industrial Sector using Exchange Traded Funds | |
|
The following table shows list of key exchange traded funds (ETF) that
help investors track Industrial Index. For detailed view, check out our ETF Funds section of our website. Quick View: Move mouse or cursor over ETF symbol (ticker) to view short-term Technical chart and over ETF name to view long term chart. Click on ticker or stock name for detailed view. Click on to add stock symbol to your watchlist and to view watchlist. |
12Stocks.com List of ETFs that track Industrial Index
| Ticker | ETF Name | Watchlist | Recent Price | Smart Investing & Trading Score | Change % | Week % | Year-to-date % |
| XLI | Industrial | | 150.44 | 30 | 1.17 | 1.03 | 16.43% |
| UXI | Industrials | | 44.33 | 30 | 31.9 | 2 | 26.16% |
| PPA | Aerospace & Defense | | 146.23 | 20 | 0.64 | 0.39 | 29.15% |
| ITA | Aerospace & Defense | | 195.08 | 20 | 0.67 | -0.3 | 35.76% |
| ITB | Home Construction | | 109.62 | 100 | 4.39 | 7.99 | 9.08% |
| XHB | Homebuilders | | 113.34 | 100 | 4.45 | 8.64 | 11.28% |
| SIJ | Short Industrials | | 12.29 | 70 | -1.1 | -1.91 | -27.73% |
| IYJ | Industrials | | 143.75 | 30 | 1.02 | 1.74 | 9.55% |
| EXI | Global Industrials | | 169.04 | 50 | 1.32 | 1.47 | 21.49% |
| VIS | Industrials | | 288.11 | 30 | 19.27 | 1.49 | 15.62% |
| PSCI | SmallCap Industrials | | 145.06 | 60 | 2.89 | 5.67 | 11.45% |
| XAR | Aerospace & Defense | | 215.51 | 30 | 0.99 | 0.99 | 32.3% |
| ARKQ | ARK Industrial Innovation | | 99.95 | 80 | 2.92 | 3.86 | 32.12% |
| 12Stocks.com: Charts, Trends, Fundamental Data and Performances of Industrial Stocks | |
|
We now take in-depth look at all Industrial stocks including charts, multi-period performances and overall trends (as measured by Smart Investing & Trading Score). One can sort Industrial stocks (click link to choose) by Daily, Weekly and by Year-to-Date performances. Also, one can sort by size of the company or by market capitalization. |
| Select Your Default Chart Type: | |||||
| |||||
| Click on stock symbol or name for detailed view. Click on to add stock symbol to your watchlist and to view watchlist. Quick View: Move mouse or cursor over "Daily" to quickly view daily Technical stock chart and over "Weekly" to view weekly Technical stock chart. | |||||

 | HI Hillenbrand, Inc. |
| Sector: Industrials | |
| SubSector: Diversified Machinery | |
| MarketCap: 1389.86 Millions | |
| Recent Price: 25.17 Smart Investing & Trading Score: 100 | |
| Day Percent Change: 2.66% Day Change: 0.87 | |
| Week Change: 34.71% Year-to-date Change: -12.5% | |
| HI Links: Profile News Message Board | |
| Charts:- Daily , Weekly | |
| Add HI to Watchlist: View: Get Complete HI Trend Analysis ➞ | |
 | FLR Fluor Corporation |
| Sector: Industrials | |
| SubSector: Heavy Construction | |
| MarketCap: 891.495 Millions | |
| Recent Price: 41.88 Smart Investing & Trading Score: 10 | |
| Day Percent Change: 40.21% Day Change: 14.23 | |
| Week Change: -2.87% Year-to-date Change: -13.5% | |
| FLR Links: Profile News Message Board | |
| Charts:- Daily , Weekly | |
| Add FLR to Watchlist: View: Get Complete FLR Trend Analysis ➞ | |
 | GENC Gencor Industries, Inc. |
| Sector: Industrials | |
| SubSector: Farm & Construction Machinery | |
| MarketCap: 147.607 Millions | |
| Recent Price: 15.24 Smart Investing & Trading Score: 50 | |
| Day Percent Change: 32.72% Day Change: 4.97 | |
| Week Change: 4.82% Year-to-date Change: -13.8% | |
| GENC Links: Profile News Message Board | |
| Charts:- Daily , Weekly | |
| Add GENC to Watchlist: View: Get Complete GENC Trend Analysis ➞ | |
 | BOOM DMC Global Inc. |
| Sector: Industrials | |
| SubSector: Metal Fabrication | |
| MarketCap: 359.15 Millions | |
| Recent Price: 6.23 Smart Investing & Trading Score: 20 | |
| Day Percent Change: 6.63% Day Change: 0.74 | |
| Week Change: -5.86% Year-to-date Change: -14.8% | |
| BOOM Links: Profile News Message Board | |
| Charts:- Daily , Weekly | |
| Add BOOM to Watchlist: View: Get Complete BOOM Trend Analysis ➞ | |
 | SKY Skyline Champion Corporation |
| Sector: Industrials | |
| SubSector: Manufactured Housing | |
| MarketCap: 915.145 Millions | |
| Recent Price: 73.17 Smart Investing & Trading Score: 90 | |
| Day Percent Change: 36.51% Day Change: 24.74 | |
| Week Change: 7.56% Year-to-date Change: -15.6% | |
| SKY Links: Profile News Message Board | |
| Charts:- Daily , Weekly | |
| Add SKY to Watchlist: View: Get Complete SKY Trend Analysis ➞ | |
 | TH Target Hospitality Corp. |
| Sector: Industrials | |
| SubSector: Conglomerates | |
| MarketCap: 218.048 Millions | |
| Recent Price: 8.00 Smart Investing & Trading Score: 40 | |
| Day Percent Change: 2.3% Day Change: 0.22 | |
| Week Change: 10.41% Year-to-date Change: -16.6% | |
| TH Links: Profile News Message Board | |
| Charts:- Daily , Weekly | |
| Add TH to Watchlist: View: Get Complete TH Trend Analysis ➞ | |
 | OFLX Omega Flex, Inc. |
| Sector: Industrials | |
| SubSector: Industrial Equipment & Components | |
| MarketCap: 590.609 Millions | |
| Recent Price: 32.87 Smart Investing & Trading Score: 50 | |
| Day Percent Change: 2.82% Day Change: 1.3 | |
| Week Change: 6.05% Year-to-date Change: -16.8% | |
| OFLX Links: Profile News Message Board | |
| Charts:- Daily , Weekly | |
| Add OFLX to Watchlist: View: Get Complete OFLX Trend Analysis ➞ | |
 | AIN Albany International Corp. |
| Sector: Industrials | |
| SubSector: Textile Industrial | |
| MarketCap: 1538.4 Millions | |
| Recent Price: 62.94 Smart Investing & Trading Score: 30 | |
| Day Percent Change: 2.15% Day Change: 1.92 | |
| Week Change: 6.9% Year-to-date Change: -17.6% | |
| AIN Links: Profile News Message Board | |
| Charts:- Daily , Weekly | |
| Add AIN to Watchlist: View: Get Complete AIN Trend Analysis ➞ | |
 | IEX IDEX Corporation |
| Sector: Industrials | |
| SubSector: Diversified Machinery | |
| MarketCap: 9721.46 Millions | |
| Recent Price: 164.77 Smart Investing & Trading Score: 30 | |
| Day Percent Change: -8.93% Day Change: -20 | |
| Week Change: 6.12% Year-to-date Change: -18.1% | |
| IEX Links: Profile News Message Board | |
| Charts:- Daily , Weekly | |
| Add IEX to Watchlist: View: Get Complete IEX Trend Analysis ➞ | |
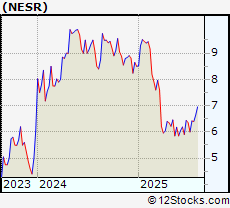 | NESR National Energy Services Reunited Corp. |
| Sector: Industrials | |
| SubSector: Conglomerates | |
| MarketCap: 603.348 Millions | |
| Recent Price: 6.96 Smart Investing & Trading Score: 50 | |
| Day Percent Change: -2.38% Day Change: -0.07 | |
| Week Change: 7.98% Year-to-date Change: -20.8% | |
| NESR Links: Profile News Message Board | |
| Charts:- Daily , Weekly | |
| Add NESR to Watchlist: View: Get Complete NESR Trend Analysis ➞ | |
 | PLUG Plug Power Inc. |
| Sector: Industrials | |
| SubSector: Industrial Electrical Equipment | |
| MarketCap: 1233.09 Millions | |
| Recent Price: 1.70 Smart Investing & Trading Score: 80 | |
| Day Percent Change: -79.84% Day Change: -8.71 | |
| Week Change: 13.7% Year-to-date Change: -22.1% | |
| PLUG Links: Profile News Message Board | |
| Charts:- Daily , Weekly | |
| Add PLUG to Watchlist: View: Get Complete PLUG Trend Analysis ➞ | |
 | AMN AMN Healthcare Services, Inc. |
| Sector: Industrials | |
| SubSector: General Building Materials | |
| MarketCap: 3064.03 Millions | |
| Recent Price: 18.92 Smart Investing & Trading Score: 70 | |
| Day Percent Change: 5.41% Day Change: 2.74 | |
| Week Change: 8.25% Year-to-date Change: -22.1% | |
| AMN Links: Profile News Message Board | |
| Charts:- Daily , Weekly | |
| Add AMN to Watchlist: View: Get Complete AMN Trend Analysis ➞ | |
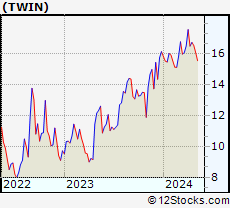 | TWIN Twin Disc, Incorporated |
| Sector: Industrials | |
| SubSector: Diversified Machinery | |
| MarketCap: 120.416 Millions | |
| Recent Price: 8.50 Smart Investing & Trading Score: 20 | |
| Day Percent Change: 5.18% Day Change: 0.65 | |
| Week Change: -0.88% Year-to-date Change: -22.9% | |
| TWIN Links: Profile News Message Board | |
| Charts:- Daily , Weekly | |
| Add TWIN to Watchlist: View: Get Complete TWIN Trend Analysis ➞ | |
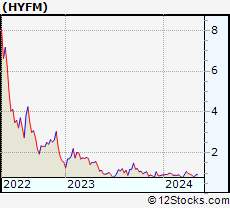 | HYFM Hydrofarm Holdings Group, Inc. |
| Sector: Industrials | |
| SubSector: Farm & Heavy Construction Machinery | |
| MarketCap: 41627 Millions | |
| Recent Price: 4.51 Smart Investing & Trading Score: 60 | |
| Day Percent Change: 1.64% Day Change: 0.01 | |
| Week Change: -1.11% Year-to-date Change: -23.5% | |
| HYFM Links: Profile News Message Board | |
| Charts:- Daily , Weekly | |
| Add HYFM to Watchlist: View: Get Complete HYFM Trend Analysis ➞ | |
 | YGMZ MingZhu Logistics Holdings Limited |
| Sector: Industrials | |
| SubSector: Trucking | |
| MarketCap: 41627 Millions | |
| Recent Price: 0.80 Smart Investing & Trading Score: 20 | |
| Day Percent Change: 5.66% Day Change: 0.06 | |
| Week Change: -7.95% Year-to-date Change: -24.0% | |
| YGMZ Links: Profile News Message Board | |
| Charts:- Daily , Weekly | |
| Add YGMZ to Watchlist: View: Get Complete YGMZ Trend Analysis ➞ | |
 | AAON AAON, Inc. |
| Sector: Industrials | |
| SubSector: General Building Materials | |
| MarketCap: 2533.63 Millions | |
| Recent Price: 79.55 Smart Investing & Trading Score: 20 | |
| Day Percent Change: 1.91% Day Change: 1.77 | |
| Week Change: 8.35% Year-to-date Change: -24.8% | |
| AAON Links: Profile News Message Board | |
| Charts:- Daily , Weekly | |
| Add AAON to Watchlist: View: Get Complete AAON Trend Analysis ➞ | |
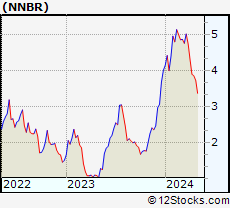 | NNBR NN, Inc. |
| Sector: Industrials | |
| SubSector: Machine Tools & Accessories | |
| MarketCap: 103.348 Millions | |
| Recent Price: 2.30 Smart Investing & Trading Score: 50 | |
| Day Percent Change: 4.77% Day Change: 0.18 | |
| Week Change: 14.49% Year-to-date Change: -25.1% | |
| NNBR Links: Profile News Message Board | |
| Charts:- Daily , Weekly | |
| Add NNBR to Watchlist: View: Get Complete NNBR Trend Analysis ➞ | |
 | ADSE ADS-TEC Energy PLC |
| Sector: Industrials | |
| SubSector: Electrical Equipment & Parts | |
| MarketCap: 329 Millions | |
| Recent Price: 11.75 Smart Investing & Trading Score: 60 | |
| Day Percent Change: 1.51% Day Change: 0.19 | |
| Week Change: 1.49% Year-to-date Change: -25.2% | |
| ADSE Links: Profile News Message Board | |
| Charts:- Daily , Weekly | |
| Add ADSE to Watchlist: View: Get Complete ADSE Trend Analysis ➞ | |
 | EAF GrafTech International Ltd. |
| Sector: Industrials | |
| SubSector: Diversified Machinery | |
| MarketCap: 2084.36 Millions | |
| Recent Price: 1.28 Smart Investing & Trading Score: 60 | |
| Day Percent Change: -82.91% Day Change: -3.56 | |
| Week Change: 11.21% Year-to-date Change: -25.4% | |
| EAF Links: Profile News Message Board | |
| Charts:- Daily , Weekly | |
| Add EAF to Watchlist: View: Get Complete EAF Trend Analysis ➞ | |
 | BCC Boise Cascade Company |
| Sector: Industrials | |
| SubSector: Lumber, Wood Production | |
| MarketCap: 963.938 Millions | |
| Recent Price: 85.99 Smart Investing & Trading Score: 60 | |
| Day Percent Change: 6.85% Day Change: 8.88 | |
| Week Change: 6.31% Year-to-date Change: -25.5% | |
| BCC Links: Profile News Message Board | |
| Charts:- Daily , Weekly | |
| Add BCC to Watchlist: View: Get Complete BCC Trend Analysis ➞ | |
 | JELD JELD-WEN Holding, Inc. |
| Sector: Industrials | |
| SubSector: General Building Materials | |
| MarketCap: 1022.53 Millions | |
| Recent Price: 5.78 Smart Investing & Trading Score: 100 | |
| Day Percent Change: -11.25% Day Change: -1.87 | |
| Week Change: 8.12% Year-to-date Change: -26.9% | |
| JELD Links: Profile News Message Board | |
| Charts:- Daily , Weekly | |
| Add JELD to Watchlist: View: Get Complete JELD Trend Analysis ➞ | |
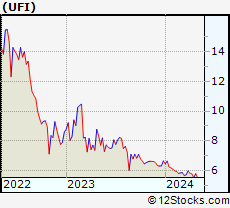 | UFI Unifi, Inc. |
| Sector: Industrials | |
| SubSector: Textile Industrial | |
| MarketCap: 165.04 Millions | |
| Recent Price: 4.40 Smart Investing & Trading Score: 10 | |
| Day Percent Change: -4.35% Day Change: -0.33 | |
| Week Change: -0.44% Year-to-date Change: -27.7% | |
| UFI Links: Profile News Message Board | |
| Charts:- Daily , Weekly | |
| Add UFI to Watchlist: View: Get Complete UFI Trend Analysis ➞ | |
 | ATKR Atkore International Group Inc. |
| Sector: Industrials | |
| SubSector: Industrial Electrical Equipment | |
| MarketCap: 1086.79 Millions | |
| Recent Price: 57.86 Smart Investing & Trading Score: 10 | |
| Day Percent Change: -33.93% Day Change: -52.76 | |
| Week Change: 3.61% Year-to-date Change: -28.4% | |
| ATKR Links: Profile News Message Board | |
| Charts:- Daily , Weekly | |
| Add ATKR to Watchlist: View: Get Complete ATKR Trend Analysis ➞ | |
 | CNR Cornerstone Building Brands, Inc. |
| Sector: Industrials | |
| SubSector: General Building Materials | |
| MarketCap: 426.253 Millions | |
| Recent Price: 71.00 Smart Investing & Trading Score: 10 | |
| Day Percent Change: 0% Day Change: 0 | |
| Week Change: -0.93% Year-to-date Change: -29.7% | |
| CNR Links: Profile News Message Board | |
| Charts:- Daily , Weekly | |
| Add CNR to Watchlist: View: Get Complete CNR Trend Analysis ➞ | |
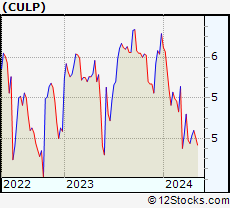 | CULP Culp, Inc. |
| Sector: Industrials | |
| SubSector: Textile Industrial | |
| MarketCap: 107.24 Millions | |
| Recent Price: 4.06 Smart Investing & Trading Score: 0 | |
| Day Percent Change: 1.46% Day Change: 0.07 | |
| Week Change: -5.07% Year-to-date Change: -29.8% | |
| CULP Links: Profile News Message Board | |
| Charts:- Daily , Weekly | |
| Add CULP to Watchlist: View: Get Complete CULP Trend Analysis ➞ | |
| For tabular summary view of above stock list: Summary View ➞ 0 - 25 , 25 - 50 , 50 - 75 , 75 - 100 , 100 - 125 , 125 - 150 , 150 - 175 , 175 - 200 , 200 - 225 , 225 - 250 , 250 - 275 , 275 - 300 | ||
| Click To Change The Sort Order: By Market Cap or Company Size Performance: Year-to-date, Week and Day | |
| Select Chart Type: | ||
|
Best Stocks Today 12Stocks.com |
© 2025 12Stocks.com Terms & Conditions Privacy Contact Us
All Information Provided Only For Education And Not To Be Used For Investing or Trading. See Terms & Conditions


One More Thing ... Get Best Stocks Delivered Daily!
Never Ever Miss A Move With Our Top Ten Stocks Lists
Find Best Stocks In Any Market - Bull or Bear Market
Take A Peek At Our Top Ten Stocks Lists: Daily, Weekly, Year-to-Date & Top Trends
Find Best Stocks In Any Market - Bull or Bear Market
Take A Peek At Our Top Ten Stocks Lists: Daily, Weekly, Year-to-Date & Top Trends
Industrial Stocks With Best Up Trends [0-bearish to 100-bullish]: Toll Brothers[100], Pulte [100], Taylor Morrison[100], Century Communities[100], Masco [100], Legacy Housing[100], Evolv Technologies[100], Solid Power[100], Meritage Homes[100], Proto Labs[100], Installed Building[100]
Best Industrial Stocks Year-to-Date:
China Yuchai[215.15%], Amprius Technologies[173.93%], Solid Power[155.03%], Tutor Perini[138.64%], Symbotic [126.4%], American Superconductor[119.61%], Joby Aviation[118.82%], Astronics [114.6%], NuScale Power[108.03%], Evolv Technologies[89.62%], Elbit Systems[79.41%] Best Industrial Stocks This Week:
Solid Power[40.52%], Frontier [37.7%], Hillenbrand [34.71%], CompoSecure [34.1%], Installed Building[28.67%], LegalZoom.com [25.35%], Construction Partners[24.32%], China Yuchai[24.26%], Montrose Environmental[23.35%], Sun Country[22.92%], Tutor Perini[22.14%] Best Industrial Stocks Daily:
Embraer S.A[128.34%], Virgin Galactic[105.78%], Graham [92.69%], Argan [92.17%], AeroVironment [91.63%], Construction Partners[90.54%], Comfort Systems[86.98%], Toll Brothers[84.15%], Granite Construction[74.15%], Eastern [68.24%], Armstrong World[62.49%]