
 Login Sign Up


| |||||
 |  | ||||

| 12Stocks.com Market Intelligence |
Best Industrial Stocks
| In a hurry? Industrial Stocks Lists: Performance Trends Table, Stock Charts
Sort Industrial stocks: Daily, Weekly, Year-to-Date, Market Cap & Trends. Filter Industrial stocks list by size:All Industrial Large Mid-Range Small |
| 12Stocks.com Industrial Stocks Performances & Trends Daily | |||||||||
|
|  The overall Smart Investing & Trading Score is 80 (0-bearish to 100-bullish) which puts Industrial sector in short term neutral to bullish trend. The Smart Investing & Trading Score from previous trading session is 80 and an improvement of trend continues.
| ||||||||
Here are the Smart Investing & Trading Scores of the most requested Industrial stocks at 12Stocks.com (click stock name for detailed review):
|

| 12Stocks.com: Investing in Industrial sector with Stocks | |
|
The following table helps investors and traders sort through current performance and trends (as measured by Smart Investing & Trading Score) of various
stocks in the Industrial sector. Quick View: Move mouse or cursor over stock symbol (ticker) to view short-term Technical chart and over stock name to view long term chart. Click on  to add stock symbol to your watchlist and to add stock symbol to your watchlist and  to view watchlist. Click on any ticker or stock name for detailed market intelligence report for that stock. to view watchlist. Click on any ticker or stock name for detailed market intelligence report for that stock. |
12Stocks.com Performance of Stocks in Industrial Sector
| Ticker | Stock Name | Watchlist | Category | Recent Price | Smart Investing & Trading Score | Change % | Weekly Change% |
| NDSN | Nordson |   | Machinery | 215.79 | 80 | 4.72% | 0.85% |
| CR | Crane Co | | Machinery | 197.31 | 80 | 2.63% | 0.82% |
| GNRC | Generac | | Machinery | 198.86 | 70 | 44.78% | 0.80% |
| LMT | Lockheed Martin | | Aerospace/Defense | 431.56 | 50 | -0.19% | 0.78% |
| GENC | Gencor Industries | | Machinery | 15.20 | 50 | 32.72% | 0.73% |
| NVR | NVR | | Residential | 7962.30 | 80 | 4.03% | 0.70% |
| PWR | Quanta Services | | Contractors | 391.57 | 50 | 2.44% | 0.63% |
| RSG | Republic Services | | Waste Mgmt | 233.53 | 0 | -0.17% | 0.62% |
| TS | Tenaris S.A | | Fabrication | 35.96 | 50 | 1.72% | 0.50% |
| WCN | Waste Connections | | Waste Mgmt | 187.40 | 20 | 33.00% | 0.48% |
| AMSC | American Superconductor | | Electrical Equipment | 55.88 | 80 | 6.29% | 0.48% |
| DOV | Dover | | Machinery | 177.99 | 60 | 1.93% | 0.46% |
| CWST | Casella Waste | | Waste Mgmt | 99.65 | 10 | 1.79% | 0.45% |
| TXT | Textron | | Aerospace/Defense | 78.54 | 60 | 1.48% | 0.41% |
| ALG | Alamo | | Machinery | 227.01 | 80 | 3.44% | 0.39% |
| TTC | Toro | | Small Tools & Accessories | 74.79 | 40 | 0.98% | 0.31% |
| RBC | Regal Beloit | | Machinery | 404.99 | 90 | 0.00% | 0.30% |
| PCT | PureCycle Technologies | | Pollution & Treatment Controls | 13.28 | 60 | -0.17% | 0.30% |
| PCH | PotlatchDeltic | | Lumber, Wood | 43.15 | 80 | 7.81% | 0.21% |
| TRS | TriMas | | Equipment | 35.67 | 70 | -4.08% | 0.11% |
| XONE | ExOne | | Machinery | 49.52 | 90 | 0.00% | 0.10% |
| GD | General Dynamics | | Aerospace/Defense | 314.01 | 40 | -0.68% | 0.08% |
| GTLS | Chart Industries | | Fabrication | 198.96 | 40 | -25.43% | 0.01% |
| PLUG | Plug Power | | Electrical Equipment | 1.54 | 40 | -79.84% | 0.00% |
| TWI | Titan | | Machinery | 8.38 | 20 | 6.70% | 0.00% |
| For chart view version of above stock list: Chart View ➞ 0 - 25 , 25 - 50 , 50 - 75 , 75 - 100 , 100 - 125 , 125 - 150 , 150 - 175 , 175 - 200 , 200 - 225 , 225 - 250 , 250 - 275 | ||
 | Click To Change The Sort Order: By Market Cap or Company Size Performance: Year-to-date, Week and Day |  |
|
Get the most comprehensive stock market coverage daily at 12Stocks.com ➞ Best Stocks Today ➞ Best Stocks Weekly ➞ Best Stocks Year-to-Date ➞ Best Stocks Trends ➞  Best Stocks Today 12Stocks.com Best Nasdaq Stocks ➞ Best S&P 500 Stocks ➞ Best Tech Stocks ➞ Best Biotech Stocks ➞ |
| Detailed Overview of Industrial Stocks |
| Industrial Technical Overview, Leaders & Laggards, Top Industrial ETF Funds & Detailed Industrial Stocks List, Charts, Trends & More |
| Industrial Sector: Technical Analysis, Trends & YTD Performance | |
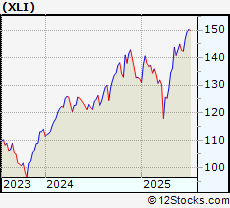
| Industrial sector is composed of stocks
from industrial machinery, aerospace, defense, farm/construction
and industrial services subsectors. Industrial sector, as represented by XLI, an exchange-traded fund [ETF] that holds basket of Industrial stocks (e.g, Caterpillar, Boeing) is up by 16.04% and is currently outperforming the overall market by 6.24% year-to-date. Below is a quick view of Technical charts and trends: |
|
 XLI Weekly Chart |
|
| Long Term Trend: Very Good | |
| Medium Term Trend: Deteriorating | |
 XLI Daily Chart |
|
| Short Term Trend: Very Good | |
| Overall Trend Score: 80 | |
| YTD Performance: 16.04% | |
| **Trend Scores & Views Are Only For Educational Purposes And Not For Investing | |
| 12Stocks.com: Top Performing Industrial Sector Stocks | ||||||||||||||||||||||||||||||||||||||||||||||||
 The top performing Industrial sector stocks year to date are
Now, more recently, over last week, the top performing Industrial sector stocks on the move are


|
||||||||||||||||||||||||||||||||||||||||||||||||
| 12Stocks.com: Investing in Industrial Sector using Exchange Traded Funds | |
|
The following table shows list of key exchange traded funds (ETF) that
help investors track Industrial Index. For detailed view, check out our ETF Funds section of our website. Quick View: Move mouse or cursor over ETF symbol (ticker) to view short-term Technical chart and over ETF name to view long term chart. Click on ticker or stock name for detailed view. Click on to add stock symbol to your watchlist and to view watchlist. |
12Stocks.com List of ETFs that track Industrial Index
| Ticker | ETF Name | Watchlist | Recent Price | Smart Investing & Trading Score | Change % | Week % | Year-to-date % |
| XLI | Industrial | | 151.97 | 80 | 1.17 | 0.77 | 16.04% |
| UXI | Industrials | | 45.17 | 80 | 31.9 | 1.12 | 24.88% |
| PPA | Aerospace & Defense | | 147.75 | 70 | 0.64 | 0.36 | 28.98% |
| ITA | Aerospace & Defense | | 198.24 | 60 | 0.67 | 0.35 | 36.74% |
| ITB | Home Construction | | 106.46 | 100 | 4.39 | 2.77 | 4.43% |
| XHB | Homebuilders | | 111.40 | 100 | 4.45 | 3.86 | 7.12% |
| SIJ | Short Industrials | | 12.04 | 30 | -1.1 | -1.23 | -27.12% |
| IYJ | Industrials | | 144.21 | 70 | 1.02 | 0.68 | 8.44% |
| EXI | Global Industrials | | 169.64 | 80 | 1.32 | 1.68 | 21.12% |
| VIS | Industrials | | 290.99 | 80 | 19.27 | 0.91 | 15.03% |
| PSCI | SmallCap Industrials | | 146.87 | 100 | 2.89 | 3.5 | 9.65% |
| ARKQ | ARK Industrial Innovation | | 101.58 | 100 | 2.92 | 9999 | NA |
| 12Stocks.com: Charts, Trends, Fundamental Data and Performances of Industrial Stocks | |
|
We now take in-depth look at all Industrial stocks including charts, multi-period performances and overall trends (as measured by Smart Investing & Trading Score). One can sort Industrial stocks (click link to choose) by Daily, Weekly and by Year-to-Date performances. Also, one can sort by size of the company or by market capitalization. |
| Select Your Default Chart Type: | |||||
| |||||
| Click on stock symbol or name for detailed view. Click on to add stock symbol to your watchlist and to view watchlist. Quick View: Move mouse or cursor over "Daily" to quickly view daily Technical stock chart and over "Weekly" to view weekly Technical stock chart. | |||||

 | NDSN Nordson Corporation |
| Sector: Industrials | |
| SubSector: Diversified Machinery | |
| MarketCap: 7117.56 Millions | |
| Recent Price: 215.79 Smart Investing & Trading Score: 80 | |
| Day Percent Change: 4.72% Day Change: 11.61 | |
| Week Change: 0.85% Year-to-date Change: 4.3% | |
| NDSN Links: Profile News Message Board | |
| Charts:- Daily , Weekly | |
| Add NDSN to Watchlist: View: Get Complete NDSN Trend Analysis ➞ | |
 | CR Crane Co. |
| Sector: Industrials | |
| SubSector: Diversified Machinery | |
| MarketCap: 2715.16 Millions | |
| Recent Price: 197.31 Smart Investing & Trading Score: 80 | |
| Day Percent Change: 2.63% Day Change: 3.97 | |
| Week Change: 0.82% Year-to-date Change: 30.4% | |
| CR Links: Profile News Message Board | |
| Charts:- Daily , Weekly | |
| Add CR to Watchlist: View: Get Complete CR Trend Analysis ➞ | |
 | GNRC Generac Holdings Inc. |
| Sector: Industrials | |
| SubSector: Diversified Machinery | |
| MarketCap: 5736.26 Millions | |
| Recent Price: 198.86 Smart Investing & Trading Score: 70 | |
| Day Percent Change: 44.78% Day Change: 48.51 | |
| Week Change: 0.8% Year-to-date Change: 28.3% | |
| GNRC Links: Profile News Message Board | |
| Charts:- Daily , Weekly | |
| Add GNRC to Watchlist: View: Get Complete GNRC Trend Analysis ➞ | |
 | LMT Lockheed Martin Corporation |
| Sector: Industrials | |
| SubSector: Aerospace/Defense Products & Services | |
| MarketCap: 94116.4 Millions | |
| Recent Price: 431.56 Smart Investing & Trading Score: 50 | |
| Day Percent Change: -0.19% Day Change: -1.06 | |
| Week Change: 0.78% Year-to-date Change: -9.9% | |
| LMT Links: Profile News Message Board | |
| Charts:- Daily , Weekly | |
| Add LMT to Watchlist: View: Get Complete LMT Trend Analysis ➞ | |
 | GENC Gencor Industries, Inc. |
| Sector: Industrials | |
| SubSector: Farm & Construction Machinery | |
| MarketCap: 147.607 Millions | |
| Recent Price: 15.20 Smart Investing & Trading Score: 50 | |
| Day Percent Change: 32.72% Day Change: 4.97 | |
| Week Change: 0.73% Year-to-date Change: -13.9% | |
| GENC Links: Profile News Message Board | |
| Charts:- Daily , Weekly | |
| Add GENC to Watchlist: View: Get Complete GENC Trend Analysis ➞ | |
 | NVR NVR, Inc. |
| Sector: Industrials | |
| SubSector: Residential Construction | |
| MarketCap: 9912.56 Millions | |
| Recent Price: 7962.30 Smart Investing & Trading Score: 80 | |
| Day Percent Change: 4.03% Day Change: 361.27 | |
| Week Change: 0.7% Year-to-date Change: -2.7% | |
| NVR Links: Profile News Message Board | |
| Charts:- Daily , Weekly | |
| Add NVR to Watchlist: View: Get Complete NVR Trend Analysis ➞ | |
 | PWR Quanta Services, Inc. |
| Sector: Industrials | |
| SubSector: General Contractors | |
| MarketCap: 3936.63 Millions | |
| Recent Price: 391.57 Smart Investing & Trading Score: 50 | |
| Day Percent Change: 2.44% Day Change: 6.51 | |
| Week Change: 0.63% Year-to-date Change: 24.0% | |
| PWR Links: Profile News Message Board | |
| Charts:- Daily , Weekly | |
| Add PWR to Watchlist: View: Get Complete PWR Trend Analysis ➞ | |
 | RSG Republic Services, Inc. |
| Sector: Industrials | |
| SubSector: Waste Management | |
| MarketCap: 26178.6 Millions | |
| Recent Price: 233.53 Smart Investing & Trading Score: 0 | |
| Day Percent Change: -0.17% Day Change: -0.36 | |
| Week Change: 0.62% Year-to-date Change: 17.0% | |
| RSG Links: Profile News Message Board | |
| Charts:- Daily , Weekly | |
| Add RSG to Watchlist: View: Get Complete RSG Trend Analysis ➞ | |
 | TS Tenaris S.A. |
| Sector: Industrials | |
| SubSector: Metal Fabrication | |
| MarketCap: 7426.8 Millions | |
| Recent Price: 35.96 Smart Investing & Trading Score: 50 | |
| Day Percent Change: 1.72% Day Change: 0.48 | |
| Week Change: 0.5% Year-to-date Change: -1.6% | |
| TS Links: Profile News Message Board | |
| Charts:- Daily , Weekly | |
| Add TS to Watchlist: View: Get Complete TS Trend Analysis ➞ | |
 | WCN Waste Connections, Inc. |
| Sector: Industrials | |
| SubSector: Waste Management | |
| MarketCap: 23055.8 Millions | |
| Recent Price: 187.40 Smart Investing & Trading Score: 20 | |
| Day Percent Change: 33% Day Change: 46.26 | |
| Week Change: 0.48% Year-to-date Change: 9.8% | |
| WCN Links: Profile News Message Board | |
| Charts:- Daily , Weekly | |
| Add WCN to Watchlist: View: Get Complete WCN Trend Analysis ➞ | |
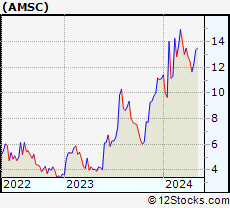 | AMSC American Superconductor Corporation |
| Sector: Industrials | |
| SubSector: Industrial Electrical Equipment | |
| MarketCap: 114.879 Millions | |
| Recent Price: 55.88 Smart Investing & Trading Score: 80 | |
| Day Percent Change: 6.29% Day Change: 1.26 | |
| Week Change: 0.48% Year-to-date Change: 126.9% | |
| AMSC Links: Profile News Message Board | |
| Charts:- Daily , Weekly | |
| Add AMSC to Watchlist: View: Get Complete AMSC Trend Analysis ➞ | |
 | DOV Dover Corporation |
| Sector: Industrials | |
| SubSector: Diversified Machinery | |
| MarketCap: 10725.6 Millions | |
| Recent Price: 177.99 Smart Investing & Trading Score: 60 | |
| Day Percent Change: 1.93% Day Change: 3.49 | |
| Week Change: 0.46% Year-to-date Change: -4.6% | |
| DOV Links: Profile News Message Board | |
| Charts:- Daily , Weekly | |
| Add DOV to Watchlist: View: Get Complete DOV Trend Analysis ➞ | |
 | CWST Casella Waste Systems, Inc. |
| Sector: Industrials | |
| SubSector: Waste Management | |
| MarketCap: 2093.38 Millions | |
| Recent Price: 99.65 Smart Investing & Trading Score: 10 | |
| Day Percent Change: 1.79% Day Change: 1.88 | |
| Week Change: 0.45% Year-to-date Change: -5.8% | |
| CWST Links: Profile News Message Board | |
| Charts:- Daily , Weekly | |
| Add CWST to Watchlist: View: Get Complete CWST Trend Analysis ➞ | |
 | TXT Textron Inc. |
| Sector: Industrials | |
| SubSector: Aerospace/Defense - Major Diversified | |
| MarketCap: 6123.09 Millions | |
| Recent Price: 78.54 Smart Investing & Trading Score: 60 | |
| Day Percent Change: 1.48% Day Change: 1.31 | |
| Week Change: 0.41% Year-to-date Change: 2.7% | |
| TXT Links: Profile News Message Board | |
| Charts:- Daily , Weekly | |
| Add TXT to Watchlist: View: Get Complete TXT Trend Analysis ➞ | |
 | ALG Alamo Group Inc. |
| Sector: Industrials | |
| SubSector: Farm & Construction Machinery | |
| MarketCap: 964.107 Millions | |
| Recent Price: 227.01 Smart Investing & Trading Score: 80 | |
| Day Percent Change: 3.44% Day Change: 6.13 | |
| Week Change: 0.39% Year-to-date Change: 22.7% | |
| ALG Links: Profile News Message Board | |
| Charts:- Daily , Weekly | |
| Add ALG to Watchlist: View: Get Complete ALG Trend Analysis ➞ | |
 | TTC The Toro Company |
| Sector: Industrials | |
| SubSector: Small Tools & Accessories | |
| MarketCap: 6426.96 Millions | |
| Recent Price: 74.79 Smart Investing & Trading Score: 40 | |
| Day Percent Change: 0.98% Day Change: 0.88 | |
| Week Change: 0.31% Year-to-date Change: -5.6% | |
| TTC Links: Profile News Message Board | |
| Charts:- Daily , Weekly | |
| Add TTC to Watchlist: View: Get Complete TTC Trend Analysis ➞ | |
 | RBC Regal Beloit Corporation |
| Sector: Industrials | |
| SubSector: Diversified Machinery | |
| MarketCap: 2681.76 Millions | |
| Recent Price: 404.99 Smart Investing & Trading Score: 90 | |
| Day Percent Change: 0% Day Change: 0 | |
| Week Change: 0.3% Year-to-date Change: 35.4% | |
| RBC Links: Profile News Message Board | |
| Charts:- Daily , Weekly | |
| Add RBC to Watchlist: View: Get Complete RBC Trend Analysis ➞ | |
 | PCT PureCycle Technologies, Inc. |
| Sector: Industrials | |
| SubSector: Pollution & Treatment Controls | |
| MarketCap: 1610 Millions | |
| Recent Price: 13.28 Smart Investing & Trading Score: 60 | |
| Day Percent Change: -0.17% Day Change: -0.01 | |
| Week Change: 0.3% Year-to-date Change: 29.6% | |
| PCT Links: Profile News Message Board | |
| Charts:- Daily , Weekly | |
| Add PCT to Watchlist: View: Get Complete PCT Trend Analysis ➞ | |
 | PCH PotlatchDeltic Corporation |
| Sector: Industrials | |
| SubSector: Lumber, Wood Production | |
| MarketCap: 2314.68 Millions | |
| Recent Price: 43.15 Smart Investing & Trading Score: 80 | |
| Day Percent Change: 7.81% Day Change: 3.2 | |
| Week Change: 0.21% Year-to-date Change: 12.3% | |
| PCH Links: Profile News Message Board | |
| Charts:- Daily , Weekly | |
| Add PCH to Watchlist: View: Get Complete PCH Trend Analysis ➞ | |
 | TRS TriMas Corporation |
| Sector: Industrials | |
| SubSector: Industrial Equipment & Components | |
| MarketCap: 963.509 Millions | |
| Recent Price: 35.67 Smart Investing & Trading Score: 70 | |
| Day Percent Change: -4.08% Day Change: -1.04 | |
| Week Change: 0.11% Year-to-date Change: 45.8% | |
| TRS Links: Profile News Message Board | |
| Charts:- Daily , Weekly | |
| Add TRS to Watchlist: View: Get Complete TRS Trend Analysis ➞ | |
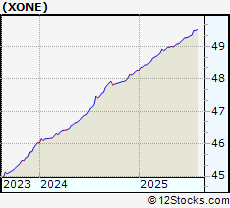 | XONE The ExOne Company |
| Sector: Industrials | |
| SubSector: Diversified Machinery | |
| MarketCap: 102.316 Millions | |
| Recent Price: 49.52 Smart Investing & Trading Score: 90 | |
| Day Percent Change: 0% Day Change: 0 | |
| Week Change: 0.1% Year-to-date Change: 2.6% | |
| XONE Links: Profile News Message Board | |
| Charts:- Daily , Weekly | |
| Add XONE to Watchlist: View: Get Complete XONE Trend Analysis ➞ | |
 | GD General Dynamics Corporation |
| Sector: Industrials | |
| SubSector: Aerospace/Defense Products & Services | |
| MarketCap: 37063.8 Millions | |
| Recent Price: 314.01 Smart Investing & Trading Score: 40 | |
| Day Percent Change: -0.68% Day Change: -2 | |
| Week Change: 0.08% Year-to-date Change: 21.1% | |
| GD Links: Profile News Message Board | |
| Charts:- Daily , Weekly | |
| Add GD to Watchlist: View: Get Complete GD Trend Analysis ➞ | |
 | GTLS Chart Industries, Inc. |
| Sector: Industrials | |
| SubSector: Metal Fabrication | |
| MarketCap: 751.15 Millions | |
| Recent Price: 198.96 Smart Investing & Trading Score: 40 | |
| Day Percent Change: -25.43% Day Change: -42.16 | |
| Week Change: 0.01% Year-to-date Change: 4.3% | |
| GTLS Links: Profile News Message Board | |
| Charts:- Daily , Weekly | |
| Add GTLS to Watchlist: View: Get Complete GTLS Trend Analysis ➞ | |
 | PLUG Plug Power Inc. |
| Sector: Industrials | |
| SubSector: Industrial Electrical Equipment | |
| MarketCap: 1233.09 Millions | |
| Recent Price: 1.54 Smart Investing & Trading Score: 40 | |
| Day Percent Change: -79.84% Day Change: -8.71 | |
| Week Change: 0% Year-to-date Change: -27.7% | |
| PLUG Links: Profile News Message Board | |
| Charts:- Daily , Weekly | |
| Add PLUG to Watchlist: View: Get Complete PLUG Trend Analysis ➞ | |
 | TWI Titan International, Inc. |
| Sector: Industrials | |
| SubSector: Farm & Construction Machinery | |
| MarketCap: 104.607 Millions | |
| Recent Price: 8.38 Smart Investing & Trading Score: 20 | |
| Day Percent Change: 6.7% Day Change: 0.52 | |
| Week Change: 0% Year-to-date Change: 23.4% | |
| TWI Links: Profile News Message Board | |
| Charts:- Daily , Weekly | |
| Add TWI to Watchlist: View: Get Complete TWI Trend Analysis ➞ | |
| For tabular summary view of above stock list: Summary View ➞ 0 - 25 , 25 - 50 , 50 - 75 , 75 - 100 , 100 - 125 , 125 - 150 , 150 - 175 , 175 - 200 , 200 - 225 , 225 - 250 , 250 - 275 | ||
| Click To Change The Sort Order: By Market Cap or Company Size Performance: Year-to-date, Week and Day | |
| Select Chart Type: | ||
|
Best Stocks Today 12Stocks.com |
© 2025 12Stocks.com Terms & Conditions Privacy Contact Us
All Information Provided Only For Education And Not To Be Used For Investing or Trading. See Terms & Conditions


One More Thing ... Get Best Stocks Delivered Daily!
Never Ever Miss A Move With Our Top Ten Stocks Lists
Find Best Stocks In Any Market - Bull or Bear Market
Take A Peek At Our Top Ten Stocks Lists: Daily, Weekly, Year-to-Date & Top Trends
Find Best Stocks In Any Market - Bull or Bear Market
Take A Peek At Our Top Ten Stocks Lists: Daily, Weekly, Year-to-Date & Top Trends
Industrial Stocks With Best Up Trends [0-bearish to 100-bullish]: Construction Partners[100], Comfort Systems[100], Granite Construction[100], Armstrong World[100], Federal Signal[100], Legacy Housing[100], Arcosa [100], Donaldson [100], Evolv Technologies[100], Powell Industries[100], TopBuild [100]
Best Industrial Stocks Year-to-Date:
China Yuchai[204.95%], Amprius Technologies[177.14%], Tutor Perini[142.85%], American Superconductor[126.9%], Joby Aviation[121.53%], Solid Power[118.52%], NuScale Power[112.88%], Astronics [105.58%], Evolv Technologies[89.87%], Sterling Construction[83.08%], IES [76.01%] Best Industrial Stocks This Week:
CompoSecure [33.1%], LegalZoom.com [26.63%], Frontier [24.53%], Tutor Perini[23.31%], Installed Building[22.1%], Construction Partners[21.29%], China Yuchai[21.11%], JELD-WEN Holding[20.69%], Montrose Environmental[20.11%], Sun Country[17.38%], Arcosa [16.57%] Best Industrial Stocks Daily:
Embraer S.A[128.34%], Virgin Galactic[105.78%], Graham [92.69%], Argan [92.17%], AeroVironment [91.63%], Construction Partners[90.54%], Comfort Systems[86.98%], Toll Brothers[84.15%], Granite Construction[74.15%], Eastern [68.24%], Armstrong World[62.49%]