
 Login Sign Up


| |||||
 |  | ||||

| 12Stocks.com Market Intelligence |
Best Industrial Stocks
| In a hurry? Industrial Stocks Lists: Performance Trends Table, Stock Charts
Sort Industrial stocks: Daily, Weekly, Year-to-Date, Market Cap & Trends. Filter Industrial stocks list by size:All Industrial Large Mid-Range Small |
| 12Stocks.com Industrial Stocks Performances & Trends Daily | |||||||||
|
|  The overall Smart Investing & Trading Score is 30 (0-bearish to 100-bullish) which puts Industrial sector in short term bearish to neutral trend. The Smart Investing & Trading Score from previous trading session is 60 and hence a deterioration of trend.
| ||||||||
Here are the Smart Investing & Trading Scores of the most requested Industrial stocks at 12Stocks.com (click stock name for detailed review):
|


| 12Stocks.com: Investing in Industrial sector with Stocks | |
|
The following table helps investors and traders sort through current performance and trends (as measured by Smart Investing & Trading Score) of various
stocks in the Industrial sector. Quick View: Move mouse or cursor over stock symbol (ticker) to view short-term Technical chart and over stock name to view long term chart. Click on  to add stock symbol to your watchlist and to add stock symbol to your watchlist and  to view watchlist. Click on any ticker or stock name for detailed market intelligence report for that stock. to view watchlist. Click on any ticker or stock name for detailed market intelligence report for that stock. |
12Stocks.com Performance of Stocks in Industrial Sector
| Ticker | Stock Name | Watchlist | Category | Recent Price | Smart Investing & Trading Score | Change % | YTD Change% |
| TILE | Interface |   | Textile Industrial | 26.62 | 80 | 5.76% | 11.94% |
| SXI | Standex | | Equipment | 202.35 | 80 | 2.93% | 11.91% |
| CVCO | Cavco Industries | | Residential | 480.22 | 70 | 4.85% | 11.05% |
| SITE | SiteOne Landscape | | Small Tools & Accessories | 139.61 | 70 | 5.48% | 10.95% |
| CRGO | Freightos | | Integrated Freight & Logistics | 3.25 | 53 | 7.74% | 10.16% |
| EMR | Emerson Electric | | Electrical Equipment | 131.75 | 20 | 8.44% | 9.87% |
| CAE | CAE | | Aerospace/Defense | 27.48 | 20 | 1.10% | 9.85% |
| SWP | Stanley Black | | Machine Tools | 27.14 | 80 | 0.00% | 9.85% |
| AOS | A. O. | | Electrical Equipment | 72.21 | 80 | 12.70% | 9.59% |
| LEGH | Legacy Housing | | Residential | 26.74 | 100 | 23.64% | 9.28% |
| ENS | EnerSys | | Electrical Equipment | 98.33 | 70 | 2.10% | 9.21% |
| PNR | Pentair | | Equipment | 104.98 | 60 | 21.05% | 9.17% |
| EAGL | Double Eagle | | Conglomerates | 30.63 | 100 | 0.00% | 9.03% |
| LEN | Lennar | | Residential | 131.95 | 100 | 3.50% | 8.96% |
| MHO | M/I Homes | | Residential | 142.37 | 100 | 5.64% | 8.88% |
| CLH | Clean Harbors | | Waste Mgmt | 243.13 | 60 | 0.59% | 8.82% |
| ETN | Eaton | | Machinery | 351.03 | 10 | 36.24% | 8.81% |
| WCN | Waste Connections | | Waste Mgmt | 184.77 | 0 | 33.00% | 8.79% |
| HAYW | Hayward | | Electrical Equipment & Parts | 15.89 | 70 | 4.27% | 7.98% |
| NPK | National Presto | | Aerospace/Defense | 101.68 | 30 | -8.24% | 7.86% |
| MTW | Manitowoc | | Machinery | 9.14 | 0 | 2.53% | 7.78% |
| EVEX | Eve Holding | | Aerospace & Defense | 4.62 | 46 | 6.35% | 7.72% |
| NDSN | Nordson | | Machinery | 213.44 | 30 | 4.72% | 7.08% |
| ITW | Illinois Tool | | Machinery | 258.64 | 50 | -0.70% | 6.72% |
| TOL | Toll Brothers | | Residential | 130.50 | 100 | 84.15% | 6.58% |
| For chart view version of above stock list: Chart View ➞ 0 - 25 , 25 - 50 , 50 - 75 , 75 - 100 , 100 - 125 , 125 - 150 , 150 - 175 , 175 - 200 , 200 - 225 , 225 - 250 , 250 - 275 , 275 - 300 | ||
 | Click To Change The Sort Order: By Market Cap or Company Size Performance: Year-to-date, Week and Day |  |
|
Get the most comprehensive stock market coverage daily at 12Stocks.com ➞ Best Stocks Today ➞ Best Stocks Weekly ➞ Best Stocks Year-to-Date ➞ Best Stocks Trends ➞  Best Stocks Today 12Stocks.com Best Nasdaq Stocks ➞ Best S&P 500 Stocks ➞ Best Tech Stocks ➞ Best Biotech Stocks ➞ |
| Detailed Overview of Industrial Stocks |
| Industrial Technical Overview, Leaders & Laggards, Top Industrial ETF Funds & Detailed Industrial Stocks List, Charts, Trends & More |
| Industrial Sector: Technical Analysis, Trends & YTD Performance | |
| Industrial sector is composed of stocks
from industrial machinery, aerospace, defense, farm/construction
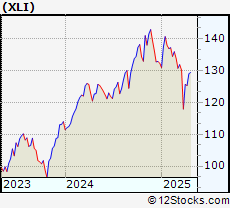
and industrial services subsectors. Industrial sector, as represented by XLI, an exchange-traded fund [ETF] that holds basket of Industrial stocks (e.g, Caterpillar, Boeing) is up by 16.43% and is currently outperforming the overall market by 6.1% year-to-date. Below is a quick view of Technical charts and trends: |
|
 XLI Weekly Chart |
|
| Long Term Trend: Very Good | |
| Medium Term Trend: Deteriorating | |
 XLI Daily Chart |
|
| Short Term Trend: Not Good | |
| Overall Trend Score: 30 | |
| YTD Performance: 16.43% | |
| **Trend Scores & Views Are Only For Educational Purposes And Not For Investing | |
| 12Stocks.com: Top Performing Industrial Sector Stocks | ||||||||||||||||||||||||||||||||||||||||||||||||
 The top performing Industrial sector stocks year to date are
Now, more recently, over last week, the top performing Industrial sector stocks on the move are


|
||||||||||||||||||||||||||||||||||||||||||||||||
| 12Stocks.com: Investing in Industrial Sector using Exchange Traded Funds | |
|
The following table shows list of key exchange traded funds (ETF) that
help investors track Industrial Index. For detailed view, check out our ETF Funds section of our website. Quick View: Move mouse or cursor over ETF symbol (ticker) to view short-term Technical chart and over ETF name to view long term chart. Click on ticker or stock name for detailed view. Click on to add stock symbol to your watchlist and to view watchlist. |
12Stocks.com List of ETFs that track Industrial Index
| Ticker | ETF Name | Watchlist | Recent Price | Smart Investing & Trading Score | Change % | Week % | Year-to-date % |
| XLI | Industrial | | 150.44 | 30 | 1.17 | 1.03 | 16.43% |
| UXI | Industrials | | 44.33 | 30 | 31.9 | 2 | 26.16% |
| PPA | Aerospace & Defense | | 146.23 | 20 | 0.64 | 0.39 | 29.15% |
| ITA | Aerospace & Defense | | 195.08 | 20 | 0.67 | -0.3 | 35.76% |
| ITB | Home Construction | | 109.62 | 100 | 4.39 | 7.99 | 9.08% |
| XHB | Homebuilders | | 113.34 | 100 | 4.45 | 8.64 | 11.28% |
| SIJ | Short Industrials | | 12.29 | 70 | -1.1 | -1.91 | -27.73% |
| IYJ | Industrials | | 143.75 | 30 | 1.02 | 1.74 | 9.55% |
| EXI | Global Industrials | | 169.04 | 50 | 1.32 | 1.47 | 21.49% |
| VIS | Industrials | | 288.11 | 30 | 19.27 | 1.49 | 15.62% |
| PSCI | SmallCap Industrials | | 145.06 | 60 | 2.89 | 5.67 | 11.45% |
| XAR | Aerospace & Defense | | 215.51 | 30 | 0.99 | 0.99 | 32.3% |
| ARKQ | ARK Industrial Innovation | | 99.95 | 80 | 2.92 | 3.86 | 32.12% |
| 12Stocks.com: Charts, Trends, Fundamental Data and Performances of Industrial Stocks | |
|
We now take in-depth look at all Industrial stocks including charts, multi-period performances and overall trends (as measured by Smart Investing & Trading Score). One can sort Industrial stocks (click link to choose) by Daily, Weekly and by Year-to-Date performances. Also, one can sort by size of the company or by market capitalization. |
| Select Your Default Chart Type: | |||||
| |||||
| Click on stock symbol or name for detailed view. Click on to add stock symbol to your watchlist and to view watchlist. Quick View: Move mouse or cursor over "Daily" to quickly view daily Technical stock chart and over "Weekly" to view weekly Technical stock chart. | |||||

 | TILE Interface, Inc. |
| Sector: Industrials | |
| SubSector: Textile Industrial | |
| MarketCap: 478 Millions | |
| Recent Price: 26.62 Smart Investing & Trading Score: 80 | |
| Day Percent Change: 5.76% Day Change: 1.02 | |
| Week Change: 5.91% Year-to-date Change: 11.9% | |
| TILE Links: Profile News Message Board | |
| Charts:- Daily , Weekly | |
| Add TILE to Watchlist: View: Get Complete TILE Trend Analysis ➞ | |
 | SXI Standex International Corporation |
| Sector: Industrials | |
| SubSector: Industrial Equipment & Components | |
| MarketCap: 644.109 Millions | |
| Recent Price: 202.35 Smart Investing & Trading Score: 80 | |
| Day Percent Change: 2.93% Day Change: 5.02 | |
| Week Change: 7.68% Year-to-date Change: 11.9% | |
| SXI Links: Profile News Message Board | |
| Charts:- Daily , Weekly | |
| Add SXI to Watchlist: View: Get Complete SXI Trend Analysis ➞ | |
 | CVCO Cavco Industries, Inc. |
| Sector: Industrials | |
| SubSector: Residential Construction | |
| MarketCap: 1375.86 Millions | |
| Recent Price: 480.22 Smart Investing & Trading Score: 70 | |
| Day Percent Change: 4.85% Day Change: 18.91 | |
| Week Change: 9.95% Year-to-date Change: 11.1% | |
| CVCO Links: Profile News Message Board | |
| Charts:- Daily , Weekly | |
| Add CVCO to Watchlist: View: Get Complete CVCO Trend Analysis ➞ | |
 | SITE SiteOne Landscape Supply, Inc. |
| Sector: Industrials | |
| SubSector: Small Tools & Accessories | |
| MarketCap: 2733.56 Millions | |
| Recent Price: 139.61 Smart Investing & Trading Score: 70 | |
| Day Percent Change: 5.48% Day Change: 7.51 | |
| Week Change: 7.4% Year-to-date Change: 11.0% | |
| SITE Links: Profile News Message Board | |
| Charts:- Daily , Weekly | |
| Add SITE to Watchlist: View: Get Complete SITE Trend Analysis ➞ | |
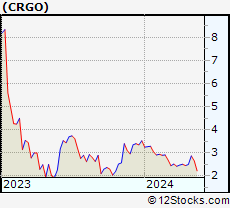 | CRGO Freightos Limited |
| Sector: Industrials | |
| SubSector: Integrated Freight & Logistics | |
| MarketCap: 149 Millions | |
| Recent Price: 3.25 Smart Investing & Trading Score: 53 | |
| Day Percent Change: 7.74% Day Change: 0.12 | |
| Week Change: 8.74% Year-to-date Change: 10.2% | |
| CRGO Links: Profile News Message Board | |
| Charts:- Daily , Weekly | |
| Add CRGO to Watchlist: View: Get Complete CRGO Trend Analysis ➞ | |
 | EMR Emerson Electric Co. |
| Sector: Industrials | |
| SubSector: Industrial Electrical Equipment | |
| MarketCap: 30457.9 Millions | |
| Recent Price: 131.75 Smart Investing & Trading Score: 20 | |
| Day Percent Change: 8.44% Day Change: 8.14 | |
| Week Change: 0.8% Year-to-date Change: 9.9% | |
| EMR Links: Profile News Message Board | |
| Charts:- Daily , Weekly | |
| Add EMR to Watchlist: View: Get Complete EMR Trend Analysis ➞ | |
 | CAE CAE Inc. |
| Sector: Industrials | |
| SubSector: Aerospace/Defense Products & Services | |
| MarketCap: 3739.61 Millions | |
| Recent Price: 27.48 Smart Investing & Trading Score: 20 | |
| Day Percent Change: 1.1% Day Change: 0.2 | |
| Week Change: -3.7% Year-to-date Change: 9.9% | |
| CAE Links: Profile News Message Board | |
| Charts:- Daily , Weekly | |
| Add CAE to Watchlist: View: Get Complete CAE Trend Analysis ➞ | |
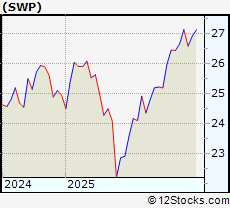 | SWP Stanley Black & Decker, Inc. CORP UNIT 2017 |
| Sector: Industrials | |
| SubSector: Machine Tools & Accessories | |
| MarketCap: 8939.58 Millions | |
| Recent Price: 27.14 Smart Investing & Trading Score: 80 | |
| Day Percent Change: 0% Day Change: 0 | |
| Week Change: 1.3% Year-to-date Change: 9.9% | |
| SWP Links: Profile News Message Board | |
| Charts:- Daily , Weekly | |
| Add SWP to Watchlist: View: Get Complete SWP Trend Analysis ➞ | |
 | AOS A. O. Smith Corporation |
| Sector: Industrials | |
| SubSector: Industrial Electrical Equipment | |
| MarketCap: 5809.89 Millions | |
| Recent Price: 72.21 Smart Investing & Trading Score: 80 | |
| Day Percent Change: 12.7% Day Change: 9.3 | |
| Week Change: 4.37% Year-to-date Change: 9.6% | |
| AOS Links: Profile News Message Board | |
| Charts:- Daily , Weekly | |
| Add AOS to Watchlist: View: Get Complete AOS Trend Analysis ➞ | |
 | LEGH Legacy Housing Corporation |
| Sector: Industrials | |
| SubSector: Residential Construction | |
| MarketCap: 298.006 Millions | |
| Recent Price: 26.74 Smart Investing & Trading Score: 100 | |
| Day Percent Change: 23.64% Day Change: 5.32 | |
| Week Change: 13.94% Year-to-date Change: 9.3% | |
| LEGH Links: Profile News Message Board | |
| Charts:- Daily , Weekly | |
| Add LEGH to Watchlist: View: Get Complete LEGH Trend Analysis ➞ | |
 | ENS EnerSys |
| Sector: Industrials | |
| SubSector: Industrial Electrical Equipment | |
| MarketCap: 2068.79 Millions | |
| Recent Price: 98.33 Smart Investing & Trading Score: 70 | |
| Day Percent Change: 2.1% Day Change: 2.03 | |
| Week Change: 10.18% Year-to-date Change: 9.2% | |
| ENS Links: Profile News Message Board | |
| Charts:- Daily , Weekly | |
| Add ENS to Watchlist: View: Get Complete ENS Trend Analysis ➞ | |
 | PNR Pentair plc |
| Sector: Industrials | |
| SubSector: Industrial Equipment & Components | |
| MarketCap: 4326.59 Millions | |
| Recent Price: 104.98 Smart Investing & Trading Score: 60 | |
| Day Percent Change: 21.05% Day Change: 15.1 | |
| Week Change: 6.3% Year-to-date Change: 9.2% | |
| PNR Links: Profile News Message Board | |
| Charts:- Daily , Weekly | |
| Add PNR to Watchlist: View: Get Complete PNR Trend Analysis ➞ | |
 | EAGL Double Eagle Acquisition Corp. |
| Sector: Industrials | |
| SubSector: Conglomerates | |
| MarketCap: 625 Millions | |
| Recent Price: 30.63 Smart Investing & Trading Score: 100 | |
| Day Percent Change: 0% Day Change: 0 | |
| Week Change: 2.34% Year-to-date Change: 9.0% | |
| EAGL Links: Profile News Message Board | |
| Charts:- Daily , Weekly | |
| Add EAGL to Watchlist: View: Get Complete EAGL Trend Analysis ➞ | |
 | LEN Lennar Corporation |
| Sector: Industrials | |
| SubSector: Residential Construction | |
| MarketCap: 11926.6 Millions | |
| Recent Price: 131.95 Smart Investing & Trading Score: 100 | |
| Day Percent Change: 3.5% Day Change: 6.26 | |
| Week Change: 9.67% Year-to-date Change: 9.0% | |
| LEN Links: Profile News Message Board | |
| Charts:- Daily , Weekly | |
| Add LEN to Watchlist: View: Get Complete LEN Trend Analysis ➞ | |
 | MHO M/I Homes, Inc. |
| Sector: Industrials | |
| SubSector: Residential Construction | |
| MarketCap: 437.106 Millions | |
| Recent Price: 142.37 Smart Investing & Trading Score: 100 | |
| Day Percent Change: 5.64% Day Change: 8.73 | |
| Week Change: 11.78% Year-to-date Change: 8.9% | |
| MHO Links: Profile News Message Board | |
| Charts:- Daily , Weekly | |
| Add MHO to Watchlist: View: Get Complete MHO Trend Analysis ➞ | |
 | CLH Clean Harbors, Inc. |
| Sector: Industrials | |
| SubSector: Waste Management | |
| MarketCap: 2391.28 Millions | |
| Recent Price: 243.13 Smart Investing & Trading Score: 60 | |
| Day Percent Change: 0.59% Day Change: 1.44 | |
| Week Change: 3.31% Year-to-date Change: 8.8% | |
| CLH Links: Profile News Message Board | |
| Charts:- Daily , Weekly | |
| Add CLH to Watchlist: View: Get Complete CLH Trend Analysis ➞ | |
 | ETN Eaton Corporation plc |
| Sector: Industrials | |
| SubSector: Diversified Machinery | |
| MarketCap: 29829.4 Millions | |
| Recent Price: 351.03 Smart Investing & Trading Score: 10 | |
| Day Percent Change: 36.24% Day Change: 79.8 | |
| Week Change: 0.1% Year-to-date Change: 8.8% | |
| ETN Links: Profile News Message Board | |
| Charts:- Daily , Weekly | |
| Add ETN to Watchlist: View: Get Complete ETN Trend Analysis ➞ | |
 | WCN Waste Connections, Inc. |
| Sector: Industrials | |
| SubSector: Waste Management | |
| MarketCap: 23055.8 Millions | |
| Recent Price: 184.77 Smart Investing & Trading Score: 0 | |
| Day Percent Change: 33% Day Change: 46.26 | |
| Week Change: -1.13% Year-to-date Change: 8.8% | |
| WCN Links: Profile News Message Board | |
| Charts:- Daily , Weekly | |
| Add WCN to Watchlist: View: Get Complete WCN Trend Analysis ➞ | |
 | HAYW Hayward Holdings, Inc. |
| Sector: Industrials | |
| SubSector: Electrical Equipment & Parts | |
| MarketCap: 2670 Millions | |
| Recent Price: 15.89 Smart Investing & Trading Score: 70 | |
| Day Percent Change: 4.27% Day Change: 0.62 | |
| Week Change: 6.17% Year-to-date Change: 8.0% | |
| HAYW Links: Profile News Message Board | |
| Charts:- Daily , Weekly | |
| Add HAYW to Watchlist: View: Get Complete HAYW Trend Analysis ➞ | |
 | NPK National Presto Industries, Inc. |
| Sector: Industrials | |
| SubSector: Aerospace/Defense Products & Services | |
| MarketCap: 540.401 Millions | |
| Recent Price: 101.68 Smart Investing & Trading Score: 30 | |
| Day Percent Change: -8.24% Day Change: -6.68 | |
| Week Change: 5.09% Year-to-date Change: 7.9% | |
| NPK Links: Profile News Message Board | |
| Charts:- Daily , Weekly | |
| Add NPK to Watchlist: View: Get Complete NPK Trend Analysis ➞ | |
 | MTW The Manitowoc Company, Inc. |
| Sector: Industrials | |
| SubSector: Farm & Construction Machinery | |
| MarketCap: 373.707 Millions | |
| Recent Price: 9.14 Smart Investing & Trading Score: 0 | |
| Day Percent Change: 2.53% Day Change: 0.25 | |
| Week Change: -21.09% Year-to-date Change: 7.8% | |
| MTW Links: Profile News Message Board | |
| Charts:- Daily , Weekly | |
| Add MTW to Watchlist: View: Get Complete MTW Trend Analysis ➞ | |
 | EVEX Eve Holding, Inc. |
| Sector: Industrials | |
| SubSector: Aerospace & Defense | |
| MarketCap: 2830 Millions | |
| Recent Price: 4.62 Smart Investing & Trading Score: 46 | |
| Day Percent Change: 6.35% Day Change: 0.16 | |
| Week Change: -2.17% Year-to-date Change: 7.7% | |
| EVEX Links: Profile News Message Board | |
| Charts:- Daily , Weekly | |
| Add EVEX to Watchlist: View: Get Complete EVEX Trend Analysis ➞ | |
 | NDSN Nordson Corporation |
| Sector: Industrials | |
| SubSector: Diversified Machinery | |
| MarketCap: 7117.56 Millions | |
| Recent Price: 213.44 Smart Investing & Trading Score: 30 | |
| Day Percent Change: 4.72% Day Change: 11.61 | |
| Week Change: 4.95% Year-to-date Change: 7.1% | |
| NDSN Links: Profile News Message Board | |
| Charts:- Daily , Weekly | |
| Add NDSN to Watchlist: View: Get Complete NDSN Trend Analysis ➞ | |
 | ITW Illinois Tool Works Inc. |
| Sector: Industrials | |
| SubSector: Diversified Machinery | |
| MarketCap: 45324.8 Millions | |
| Recent Price: 258.64 Smart Investing & Trading Score: 50 | |
| Day Percent Change: -0.7% Day Change: -1.75 | |
| Week Change: 3.81% Year-to-date Change: 6.7% | |
| ITW Links: Profile News Message Board | |
| Charts:- Daily , Weekly | |
| Add ITW to Watchlist: View: Get Complete ITW Trend Analysis ➞ | |
 | TOL Toll Brothers, Inc. |
| Sector: Industrials | |
| SubSector: Residential Construction | |
| MarketCap: 2278.26 Millions | |
| Recent Price: 130.50 Smart Investing & Trading Score: 100 | |
| Day Percent Change: 84.15% Day Change: 67.96 | |
| Week Change: 5.94% Year-to-date Change: 6.6% | |
| TOL Links: Profile News Message Board | |
| Charts:- Daily , Weekly | |
| Add TOL to Watchlist: View: Get Complete TOL Trend Analysis ➞ | |
| For tabular summary view of above stock list: Summary View ➞ 0 - 25 , 25 - 50 , 50 - 75 , 75 - 100 , 100 - 125 , 125 - 150 , 150 - 175 , 175 - 200 , 200 - 225 , 225 - 250 , 250 - 275 , 275 - 300 | ||
| Click To Change The Sort Order: By Market Cap or Company Size Performance: Year-to-date, Week and Day | |
| Select Chart Type: | ||
|
Best Stocks Today 12Stocks.com |
© 2025 12Stocks.com Terms & Conditions Privacy Contact Us
All Information Provided Only For Education And Not To Be Used For Investing or Trading. See Terms & Conditions


One More Thing ... Get Best Stocks Delivered Daily!
Never Ever Miss A Move With Our Top Ten Stocks Lists
Find Best Stocks In Any Market - Bull or Bear Market
Take A Peek At Our Top Ten Stocks Lists: Daily, Weekly, Year-to-Date & Top Trends
Find Best Stocks In Any Market - Bull or Bear Market
Take A Peek At Our Top Ten Stocks Lists: Daily, Weekly, Year-to-Date & Top Trends
Industrial Stocks With Best Up Trends [0-bearish to 100-bullish]: Toll Brothers[100], Pulte [100], Taylor Morrison[100], Century Communities[100], Masco [100], Legacy Housing[100], Evolv Technologies[100], Solid Power[100], Meritage Homes[100], Proto Labs[100], Installed Building[100]
Best Industrial Stocks Year-to-Date:
China Yuchai[215.15%], Amprius Technologies[173.93%], Solid Power[155.03%], Tutor Perini[138.64%], Symbotic [126.4%], American Superconductor[119.61%], Joby Aviation[118.82%], Astronics [114.6%], NuScale Power[108.03%], Evolv Technologies[89.62%], Elbit Systems[79.41%] Best Industrial Stocks This Week:
Solid Power[40.52%], Frontier [37.7%], Hillenbrand [34.71%], CompoSecure [34.1%], Installed Building[28.67%], LegalZoom.com [25.35%], Construction Partners[24.32%], China Yuchai[24.26%], Montrose Environmental[23.35%], Sun Country[22.92%], Tutor Perini[22.14%] Best Industrial Stocks Daily:
Embraer S.A[128.34%], Virgin Galactic[105.78%], Graham [92.69%], Argan [92.17%], AeroVironment [91.63%], Construction Partners[90.54%], Comfort Systems[86.98%], Toll Brothers[84.15%], Granite Construction[74.15%], Eastern [68.24%], Armstrong World[62.49%]