
 Login Sign Up


| |||||
 |  | ||||

| 12Stocks.com Market Intelligence |
Best Industrial Stocks
| In a hurry? Industrial Stocks Lists: Performance Trends Table, Stock Charts
Sort Industrial stocks: Daily, Weekly, Year-to-Date, Market Cap & Trends. Filter Industrial stocks list by size:All Industrial Large Mid-Range Small |
| 12Stocks.com Industrial Stocks Performances & Trends Daily | |||||||||
|
|  The overall Smart Investing & Trading Score is 30 (0-bearish to 100-bullish) which puts Industrial sector in short term bearish to neutral trend. The Smart Investing & Trading Score from previous trading session is 40 and hence a deterioration of trend.
| ||||||||
Here are the Smart Investing & Trading Scores of the most requested Industrial stocks at 12Stocks.com (click stock name for detailed review):
|


| 12Stocks.com: Investing in Industrial sector with Stocks | |
|
The following table helps investors and traders sort through current performance and trends (as measured by Smart Investing & Trading Score) of various
stocks in the Industrial sector. Quick View: Move mouse or cursor over stock symbol (ticker) to view short-term Technical chart and over stock name to view long term chart. Click on  to add stock symbol to your watchlist and to add stock symbol to your watchlist and  to view watchlist. Click on any ticker or stock name for detailed market intelligence report for that stock. to view watchlist. Click on any ticker or stock name for detailed market intelligence report for that stock. |
12Stocks.com Performance of Stocks in Industrial Sector
| Ticker | Stock Name | Watchlist | Category | Recent Price | Smart Investing & Trading Score | Change % | YTD Change% |
| AMPX | Amprius Technologies |   | Electrical Equipment & Parts | 7.09 | 51 | 0.74% | 142.50% |
| GRAF | Graf | | Conglomerates | 10.46 | 51 | 0.10% | 3.96% |
| PLPC | Preformed Line | | Electrical Equipment | 191.07 | 50 | 2.55% | 45.05% |
| POWL | Powell Industries | | Machinery | 266.16 | 50 | 1.79% | 13.52% |
| SWIM | Latham | | Building Products & Equipment | 8.03 | 50 | 1.72% | 10.34% |
| LZ | LegalZoom.com | | Specialty | 11.08 | 50 | 1.52% | 42.34% |
| PRLB | Proto Labs | | Machine Tools | 49.81 | 50 | 1.17% | 23.46% |
| STRL | Sterling Construction | | Heavy Construction | 278.53 | 50 | 1.14% | 65.05% |
| HLIO | Helios Technologies | | Machinery | 54.24 | 50 | 0.95% | 17.04% |
| GFL | GFL Environmental | | Waste Mgmt | 50.04 | 50 | 0.71% | 14.25% |
| ESLT | Elbit Systems | | Aerospace/Defense | 480.21 | 50 | 0.50% | 78.50% |
| SXI | Standex | | Equipment | 204.07 | 50 | 0.35% | 8.24% |
| GFF | Griffon | | Building Materials | 76.16 | 50 | 0.19% | 1.93% |
| SSD | Simpson | | Small Tools & Accessories | 191.12 | 50 | 0.16% | 14.37% |
| HEI | HEICO | | Aerospace/Defense | 312.02 | 50 | 0.16% | 29.54% |
| HLMN | Hillman | | Tools & Accessories | 9.88 | 50 | 0.10% | -0.51% |
| THR | Thermon | | Machinery | 26.52 | 50 | 0.08% | -12.76% |
| PATK | Patrick Industries | | Lumber, Wood | 111.85 | 50 | -0.04% | 34.91% |
| FELE | Franklin Electric | | Electrical Equipment | 97.86 | 50 | -0.05% | -0.89% |
| CRH | CRH | | Cement | 112.95 | 50 | -0.05% | 20.61% |
| EAGL | Double Eagle | | Conglomerates | 30.99 | 50 | -0.10% | 8.98% |
| SKYH | Sky Harbour | | Aerospace & Defense | 10.54 | 50 | -0.10% | -13.50% |
| MIR | Mirion Technologies | | Specialty Industrial Machinery | 20.50 | 50 | -0.15% | 15.82% |
| SKY | Skyline Champion | | Manufactured Housing | 75.46 | 50 | -0.17% | -18.88% |
| LEN | Lennar | | Residential | 132.77 | 50 | -0.28% | 2.08% |
| For chart view version of above stock list: Chart View ➞ 0 - 25 , 25 - 50 , 50 - 75 , 75 - 100 , 100 - 125 , 125 - 150 , 150 - 175 , 175 - 200 , 200 - 225 , 225 - 250 , 250 - 275 , 275 - 300 | ||
 | Click To Change The Sort Order: By Market Cap or Company Size Performance: Year-to-date, Week and Day |  |
|
Get the most comprehensive stock market coverage daily at 12Stocks.com ➞ Best Stocks Today ➞ Best Stocks Weekly ➞ Best Stocks Year-to-Date ➞ Best Stocks Trends ➞  Best Stocks Today 12Stocks.com Best Nasdaq Stocks ➞ Best S&P 500 Stocks ➞ Best Tech Stocks ➞ Best Biotech Stocks ➞ |
| Detailed Overview of Industrial Stocks |
| Industrial Technical Overview, Leaders & Laggards, Top Industrial ETF Funds & Detailed Industrial Stocks List, Charts, Trends & More |
| Industrial Sector: Technical Analysis, Trends & YTD Performance | |
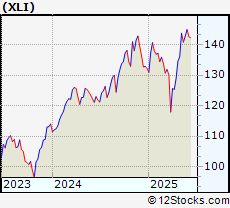
| Industrial sector is composed of stocks
from industrial machinery, aerospace, defense, farm/construction
and industrial services subsectors. Industrial sector, as represented by XLI, an exchange-traded fund [ETF] that holds basket of Industrial stocks (e.g, Caterpillar, Boeing) is up by 11.44% and is currently outperforming the overall market by 4.92% year-to-date. Below is a quick view of Technical charts and trends: |
|
 XLI Weekly Chart |
|
| Long Term Trend: Very Good | |
| Medium Term Trend: Very Good | |
 XLI Daily Chart |
|
| Short Term Trend: Not Good | |
| Overall Trend Score: 30 | |
| YTD Performance: 11.44% | |
| **Trend Scores & Views Are Only For Educational Purposes And Not For Investing | |
| 12Stocks.com: Top Performing Industrial Sector Stocks | ||||||||||||||||||||||||||||||||||||||||||||||||
 The top performing Industrial sector stocks year to date are
Now, more recently, over last week, the top performing Industrial sector stocks on the move are


|
||||||||||||||||||||||||||||||||||||||||||||||||
| 12Stocks.com: Investing in Industrial Sector using Exchange Traded Funds | |
|
The following table shows list of key exchange traded funds (ETF) that
help investors track Industrial Index. For detailed view, check out our ETF Funds section of our website. Quick View: Move mouse or cursor over ETF symbol (ticker) to view short-term Technical chart and over ETF name to view long term chart. Click on ticker or stock name for detailed view. Click on to add stock symbol to your watchlist and to view watchlist. |
12Stocks.com List of ETFs that track Industrial Index
| Ticker | ETF Name | Watchlist | Recent Price | Smart Investing & Trading Score | Change % | Week % | Year-to-date % |
| XLI | Industrial | | 152.01 | 30 | 1.7 | 1.86 | 11.44% |
| UXI | Industrials | | 45.12 | 20 | 3.19 | 3.54 | 16.37% |
| PPA | Aerospace & Defense | | 147.97 | 50 | 0.88 | 0.4 | 21.93% |
| ITA | Aerospace & Defense | | 198.42 | 50 | 0.53 | 0.47 | 25.5% |
| ITB | Home Construction | | 110.70 | 60 | 5.42 | 3.17 | 6.94% |
| XHB | Homebuilders | | 113.0 | 40 | -0.88 | -0.88 | 4.75% |
| SIJ | Short Industrials | | 11.97 | 70 | -3.12 | -3.42 | -20.76% |
| IYJ | Industrials | | 146.17 | 30 | -0.24 | -0.58 | 8.12% |
| EXI | Global Industrials | | 168.86 | 20 | -0.42 | -0.57 | 20.04% |
| VIS | Industrials | | 291.31 | 30 | -0.33 | -0.59 | 13.79% |
| PSCI | SmallCap Industrials | | 147.86 | 50 | -0.02 | -1.17 | 7.75% |
| XAR | Aerospace & Defense | | 217.44 | 40 | 0.62 | -1.47 | 28.91% |
| ARKQ | ARK Industrial Innovation | | 97.96 | 20 | 0.08 | -5.38 | 23.44% |
| 12Stocks.com: Charts, Trends, Fundamental Data and Performances of Industrial Stocks | |
|
We now take in-depth look at all Industrial stocks including charts, multi-period performances and overall trends (as measured by Smart Investing & Trading Score). One can sort Industrial stocks (click link to choose) by Daily, Weekly and by Year-to-Date performances. Also, one can sort by size of the company or by market capitalization. |
| Select Your Default Chart Type: | |||||
| |||||
| Click on stock symbol or name for detailed view. Click on to add stock symbol to your watchlist and to view watchlist. Quick View: Move mouse or cursor over "Daily" to quickly view daily Technical stock chart and over "Weekly" to view weekly Technical stock chart. | |||||

 | AMPX Amprius Technologies, Inc. |
| Sector: Industrials | |
| SubSector: Electrical Equipment & Parts | |
| MarketCap: 608 Millions | |
| Recent Price: 7.09 Smart Investing & Trading Score: 51 | |
| Day Percent Change: 0.74% Day Change: 0.05 | |
| Week Change: -8.74% Year-to-date Change: 142.5% | |
| AMPX Links: Profile News Message Board | |
| Charts:- Daily , Weekly | |
| Add AMPX to Watchlist: View: Get Complete AMPX Trend Analysis ➞ | |
 | GRAF Graf Industrial Corp. |
| Sector: Industrials | |
| SubSector: Conglomerates | |
| MarketCap: 308.648 Millions | |
| Recent Price: 10.46 Smart Investing & Trading Score: 51 | |
| Day Percent Change: 0.1% Day Change: 0.01 | |
| Week Change: 0% Year-to-date Change: 4.0% | |
| GRAF Links: Profile News Message Board | |
| Charts:- Daily , Weekly | |
| Add GRAF to Watchlist: View: Get Complete GRAF Trend Analysis ➞ | |
 | PLPC Preformed Line Products Company |
| Sector: Industrials | |
| SubSector: Industrial Electrical Equipment | |
| MarketCap: 221.779 Millions | |
| Recent Price: 191.07 Smart Investing & Trading Score: 50 | |
| Day Percent Change: 2.55% Day Change: 4.59 | |
| Week Change: 0.5% Year-to-date Change: 45.1% | |
| PLPC Links: Profile News Message Board | |
| Charts:- Daily , Weekly | |
| Add PLPC to Watchlist: View: Get Complete PLPC Trend Analysis ➞ | |
 | POWL Powell Industries, Inc. |
| Sector: Industrials | |
| SubSector: Diversified Machinery | |
| MarketCap: 257.216 Millions | |
| Recent Price: 266.16 Smart Investing & Trading Score: 50 | |
| Day Percent Change: 1.79% Day Change: 4.41 | |
| Week Change: -1.79% Year-to-date Change: 13.5% | |
| POWL Links: Profile News Message Board | |
| Charts:- Daily , Weekly | |
| Add POWL to Watchlist: View: Get Complete POWL Trend Analysis ➞ | |
 | SWIM Latham Group, Inc. |
| Sector: Industrials | |
| SubSector: Building Products & Equipment | |
| MarketCap: 388 Millions | |
| Recent Price: 8.03 Smart Investing & Trading Score: 50 | |
| Day Percent Change: 1.72% Day Change: 0.13 | |
| Week Change: -2.78% Year-to-date Change: 10.3% | |
| SWIM Links: Profile News Message Board | |
| Charts:- Daily , Weekly | |
| Add SWIM to Watchlist: View: Get Complete SWIM Trend Analysis ➞ | |
 | LZ LegalZoom.com, Inc. |
| Sector: Industrials | |
| SubSector: Specialty Business Services | |
| MarketCap: 2330 Millions | |
| Recent Price: 11.08 Smart Investing & Trading Score: 50 | |
| Day Percent Change: 1.52% Day Change: 0.16 | |
| Week Change: 0.19% Year-to-date Change: 42.3% | |
| LZ Links: Profile News Message Board | |
| Charts:- Daily , Weekly | |
| Add LZ to Watchlist: View: Get Complete LZ Trend Analysis ➞ | |
 | PRLB Proto Labs, Inc. |
| Sector: Industrials | |
| SubSector: Machine Tools & Accessories | |
| MarketCap: 1944.78 Millions | |
| Recent Price: 49.81 Smart Investing & Trading Score: 50 | |
| Day Percent Change: 1.17% Day Change: 0.56 | |
| Week Change: 0.86% Year-to-date Change: 23.5% | |
| PRLB Links: Profile News Message Board | |
| Charts:- Daily , Weekly | |
| Add PRLB to Watchlist: View: Get Complete PRLB Trend Analysis ➞ | |
 | STRL Sterling Construction Company, Inc. |
| Sector: Industrials | |
| SubSector: Heavy Construction | |
| MarketCap: 237.395 Millions | |
| Recent Price: 278.53 Smart Investing & Trading Score: 50 | |
| Day Percent Change: 1.14% Day Change: 3.14 | |
| Week Change: -1.46% Year-to-date Change: 65.1% | |
| STRL Links: Profile News Message Board | |
| Charts:- Daily , Weekly | |
| Add STRL to Watchlist: View: Get Complete STRL Trend Analysis ➞ | |
 | HLIO Helios Technologies, Inc. |
| Sector: Industrials | |
| SubSector: Diversified Machinery | |
| MarketCap: 1455.66 Millions | |
| Recent Price: 54.24 Smart Investing & Trading Score: 50 | |
| Day Percent Change: 0.95% Day Change: 0.49 | |
| Week Change: -2.57% Year-to-date Change: 17.0% | |
| HLIO Links: Profile News Message Board | |
| Charts:- Daily , Weekly | |
| Add HLIO to Watchlist: View: Get Complete HLIO Trend Analysis ➞ | |
 | GFL GFL Environmental Inc. |
| Sector: Industrials | |
| SubSector: Waste Management | |
| MarketCap: 87627 Millions | |
| Recent Price: 50.04 Smart Investing & Trading Score: 50 | |
| Day Percent Change: 0.71% Day Change: 0.36 | |
| Week Change: 1.27% Year-to-date Change: 14.3% | |
| GFL Links: Profile News Message Board | |
| Charts:- Daily , Weekly | |
| Add GFL to Watchlist: View: Get Complete GFL Trend Analysis ➞ | |
 | ESLT Elbit Systems Ltd. |
| Sector: Industrials | |
| SubSector: Aerospace/Defense Products & Services | |
| MarketCap: 5770.01 Millions | |
| Recent Price: 480.21 Smart Investing & Trading Score: 50 | |
| Day Percent Change: 0.5% Day Change: 2.3 | |
| Week Change: -0.1% Year-to-date Change: 78.5% | |
| ESLT Links: Profile News Message Board | |
| Charts:- Daily , Weekly | |
| Add ESLT to Watchlist: View: Get Complete ESLT Trend Analysis ➞ | |
 | SXI Standex International Corporation |
| Sector: Industrials | |
| SubSector: Industrial Equipment & Components | |
| MarketCap: 644.109 Millions | |
| Recent Price: 204.07 Smart Investing & Trading Score: 50 | |
| Day Percent Change: 0.35% Day Change: 0.71 | |
| Week Change: -1.31% Year-to-date Change: 8.2% | |
| SXI Links: Profile News Message Board | |
| Charts:- Daily , Weekly | |
| Add SXI to Watchlist: View: Get Complete SXI Trend Analysis ➞ | |
 | GFF Griffon Corporation |
| Sector: Industrials | |
| SubSector: General Building Materials | |
| MarketCap: 616 Millions | |
| Recent Price: 76.16 Smart Investing & Trading Score: 50 | |
| Day Percent Change: 0.19% Day Change: 0.14 | |
| Week Change: -2.35% Year-to-date Change: 1.9% | |
| GFF Links: Profile News Message Board | |
| Charts:- Daily , Weekly | |
| Add GFF to Watchlist: View: Get Complete GFF Trend Analysis ➞ | |
 | SSD Simpson Manufacturing Co., Inc. |
| Sector: Industrials | |
| SubSector: Small Tools & Accessories | |
| MarketCap: 2850.16 Millions | |
| Recent Price: 191.12 Smart Investing & Trading Score: 50 | |
| Day Percent Change: 0.16% Day Change: 0.3 | |
| Week Change: -1.31% Year-to-date Change: 14.4% | |
| SSD Links: Profile News Message Board | |
| Charts:- Daily , Weekly | |
| Add SSD to Watchlist: View: Get Complete SSD Trend Analysis ➞ | |
 | HEI HEICO Corporation |
| Sector: Industrials | |
| SubSector: Aerospace/Defense Products & Services | |
| MarketCap: 10023.1 Millions | |
| Recent Price: 312.02 Smart Investing & Trading Score: 50 | |
| Day Percent Change: 0.16% Day Change: 0.49 | |
| Week Change: -1.12% Year-to-date Change: 29.5% | |
| HEI Links: Profile News Message Board | |
| Charts:- Daily , Weekly | |
| Add HEI to Watchlist: View: Get Complete HEI Trend Analysis ➞ | |
 | HLMN Hillman Solutions Corp. |
| Sector: Industrials | |
| SubSector: Tools & Accessories | |
| MarketCap: 1720 Millions | |
| Recent Price: 9.88 Smart Investing & Trading Score: 50 | |
| Day Percent Change: 0.1% Day Change: 0.01 | |
| Week Change: -2.81% Year-to-date Change: -0.5% | |
| HLMN Links: Profile News Message Board | |
| Charts:- Daily , Weekly | |
| Add HLMN to Watchlist: View: Get Complete HLMN Trend Analysis ➞ | |
 | THR Thermon Group Holdings, Inc. |
| Sector: Industrials | |
| SubSector: Diversified Machinery | |
| MarketCap: 492.816 Millions | |
| Recent Price: 26.52 Smart Investing & Trading Score: 50 | |
| Day Percent Change: 0.08% Day Change: 0.02 | |
| Week Change: -0.79% Year-to-date Change: -12.8% | |
| THR Links: Profile News Message Board | |
| Charts:- Daily , Weekly | |
| Add THR to Watchlist: View: Get Complete THR Trend Analysis ➞ | |
 | PATK Patrick Industries, Inc. |
| Sector: Industrials | |
| SubSector: Lumber, Wood Production | |
| MarketCap: 565.838 Millions | |
| Recent Price: 111.85 Smart Investing & Trading Score: 50 | |
| Day Percent Change: -0.04% Day Change: -0.05 | |
| Week Change: -1.24% Year-to-date Change: 34.9% | |
| PATK Links: Profile News Message Board | |
| Charts:- Daily , Weekly | |
| Add PATK to Watchlist: View: Get Complete PATK Trend Analysis ➞ | |
 | FELE Franklin Electric Co., Inc. |
| Sector: Industrials | |
| SubSector: Industrial Electrical Equipment | |
| MarketCap: 2397.89 Millions | |
| Recent Price: 97.86 Smart Investing & Trading Score: 50 | |
| Day Percent Change: -0.05% Day Change: -0.05 | |
| Week Change: -0.71% Year-to-date Change: -0.9% | |
| FELE Links: Profile News Message Board | |
| Charts:- Daily , Weekly | |
| Add FELE to Watchlist: View: Get Complete FELE Trend Analysis ➞ | |
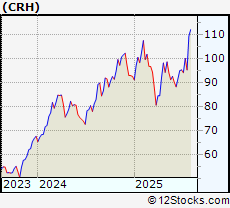 | CRH CRH plc |
| Sector: Industrials | |
| SubSector: Cement | |
| MarketCap: 17732.3 Millions | |
| Recent Price: 112.95 Smart Investing & Trading Score: 50 | |
| Day Percent Change: -0.05% Day Change: -0.05 | |
| Week Change: -0.92% Year-to-date Change: 20.6% | |
| CRH Links: Profile News Message Board | |
| Charts:- Daily , Weekly | |
| Add CRH to Watchlist: View: Get Complete CRH Trend Analysis ➞ | |
 | EAGL Double Eagle Acquisition Corp. |
| Sector: Industrials | |
| SubSector: Conglomerates | |
| MarketCap: 625 Millions | |
| Recent Price: 30.99 Smart Investing & Trading Score: 50 | |
| Day Percent Change: -0.1% Day Change: -0.03 | |
| Week Change: -0.15% Year-to-date Change: 9.0% | |
| EAGL Links: Profile News Message Board | |
| Charts:- Daily , Weekly | |
| Add EAGL to Watchlist: View: Get Complete EAGL Trend Analysis ➞ | |
 | SKYH Sky Harbour Group Corporation |
| Sector: Industrials | |
| SubSector: Aerospace & Defense | |
| MarketCap: 271 Millions | |
| Recent Price: 10.54 Smart Investing & Trading Score: 50 | |
| Day Percent Change: -0.1% Day Change: -0.01 | |
| Week Change: -3.55% Year-to-date Change: -13.5% | |
| SKYH Links: Profile News Message Board | |
| Charts:- Daily , Weekly | |
| Add SKYH to Watchlist: View: Get Complete SKYH Trend Analysis ➞ | |
 | MIR Mirion Technologies, Inc. |
| Sector: Industrials | |
| SubSector: Specialty Industrial Machinery | |
| MarketCap: 1920 Millions | |
| Recent Price: 20.50 Smart Investing & Trading Score: 50 | |
| Day Percent Change: -0.15% Day Change: -0.03 | |
| Week Change: -2.08% Year-to-date Change: 15.8% | |
| MIR Links: Profile News Message Board | |
| Charts:- Daily , Weekly | |
| Add MIR to Watchlist: View: Get Complete MIR Trend Analysis ➞ | |
 | SKY Skyline Champion Corporation |
| Sector: Industrials | |
| SubSector: Manufactured Housing | |
| MarketCap: 915.145 Millions | |
| Recent Price: 75.46 Smart Investing & Trading Score: 50 | |
| Day Percent Change: -0.17% Day Change: -0.12 | |
| Week Change: -2.76% Year-to-date Change: -18.9% | |
| SKY Links: Profile News Message Board | |
| Charts:- Daily , Weekly | |
| Add SKY to Watchlist: View: Get Complete SKY Trend Analysis ➞ | |
 | LEN Lennar Corporation |
| Sector: Industrials | |
| SubSector: Residential Construction | |
| MarketCap: 11926.6 Millions | |
| Recent Price: 132.77 Smart Investing & Trading Score: 50 | |
| Day Percent Change: -0.28% Day Change: -0.37 | |
| Week Change: -0.28% Year-to-date Change: 2.1% | |
| LEN Links: Profile News Message Board | |
| Charts:- Daily , Weekly | |
| Add LEN to Watchlist: View: Get Complete LEN Trend Analysis ➞ | |
| For tabular summary view of above stock list: Summary View ➞ 0 - 25 , 25 - 50 , 50 - 75 , 75 - 100 , 100 - 125 , 125 - 150 , 150 - 175 , 175 - 200 , 200 - 225 , 225 - 250 , 250 - 275 , 275 - 300 | ||
| Click To Change The Sort Order: By Market Cap or Company Size Performance: Year-to-date, Week and Day | |
| Select Chart Type: | ||
|
Best Stocks Today 12Stocks.com |
© 2025 12Stocks.com Terms & Conditions Privacy Contact Us
All Information Provided Only For Education And Not To Be Used For Investing or Trading. See Terms & Conditions


One More Thing ... Get Best Stocks Delivered Daily!
Never Ever Miss A Move With Our Top Ten Stocks Lists
Find Best Stocks In Any Market - Bull or Bear Market
Take A Peek At Our Top Ten Stocks Lists: Daily, Weekly, Year-to-Date & Top Trends
Find Best Stocks In Any Market - Bull or Bear Market
Take A Peek At Our Top Ten Stocks Lists: Daily, Weekly, Year-to-Date & Top Trends
Industrial Stocks With Best Up Trends [0-bearish to 100-bullish]: Kanzhun [100], Xometry [100], Cementos Pacasmayo[100], Barnes [100], Hexcel [100], National Energy[100], Montrose Environmental[100], Seaboard [100], CEMEX S.A.B.[100], REX American[100], Eos Energy[100]
Best Industrial Stocks Year-to-Date:
LanzaTech Global[1484.67%], China Yuchai[231.9%], Amprius Technologies[142.5%], Tutor Perini[135.62%], Solid Power[128.57%], Astronics [123.06%], Evolv Technologies[98.23%], American Superconductor[97.28%], NuScale Power[86.78%], Symbotic [85.15%], Elbit Systems[78.5%] Best Industrial Stocks This Week:
LanzaTech Global[5701.71%], Twin Disc[25.39%], National Energy[23.8%], System1 [11.61%], Target Hospitality[10.9%], Kanzhun [10.41%], China Yuchai[8.53%], Astronics [8.27%], Barnes [8.09%], BiomX [7.55%], Cool [6.45%] Best Industrial Stocks Daily:
Twin Disc[30.05%], Bioceres Crop[8.89%], Novonix [7.08%], Kanzhun [6.61%], James Hardie[6.12%], Satellogic [5.65%], Solid Power[4.85%], System1 [4.83%], Xometry [4.58%], BiomX [4.06%], Astronics [3.46%]