
 Login Sign Up


| |||||
 |  | ||||

| 12Stocks.com Market Intelligence |
Best Industrial Stocks
| In a hurry? Industrial Stocks Lists: Performance Trends Table, Stock Charts
Sort Industrial stocks: Daily, Weekly, Year-to-Date, Market Cap & Trends. Filter Industrial stocks list by size:All Industrial Large Mid-Range Small |
| 12Stocks.com Industrial Stocks Performances & Trends Daily | |||||||||
|
|  The overall Smart Investing & Trading Score is 30 (0-bearish to 100-bullish) which puts Industrial sector in short term bearish to neutral trend. The Smart Investing & Trading Score from previous trading session is 60 and hence a deterioration of trend.
| ||||||||
Here are the Smart Investing & Trading Scores of the most requested Industrial stocks at 12Stocks.com (click stock name for detailed review):
|


| 12Stocks.com: Investing in Industrial sector with Stocks | |
|
The following table helps investors and traders sort through current performance and trends (as measured by Smart Investing & Trading Score) of various
stocks in the Industrial sector. Quick View: Move mouse or cursor over stock symbol (ticker) to view short-term Technical chart and over stock name to view long term chart. Click on  to add stock symbol to your watchlist and to add stock symbol to your watchlist and  to view watchlist. Click on any ticker or stock name for detailed market intelligence report for that stock. to view watchlist. Click on any ticker or stock name for detailed market intelligence report for that stock. |
12Stocks.com Performance of Stocks in Industrial Sector
| Ticker | Stock Name | Watchlist | Category | Recent Price | Smart Investing & Trading Score | Change % | YTD Change% |
| ERJ | Embraer S.A |   | Aerospace/Defense | 57.52 | 40 | 128.34 | 60.22% |
| SPCE | Virgin Galactic | | Conglomerates | 2.99 | 20 | 105.78 | -48.30% |
| AVAV | AeroVironment | | Aerospace/Defense | 246.65 | 40 | 91.63 | 65.58% |
| FIX | Comfort Systems | | Contractors | 680.86 | 30 | 86.98 | 65.93% |
| TOL | Toll Brothers | | Residential | 130.50 | 100 | 84.15 | 6.58% |
| AWI | Armstrong World | | Building Materials | 194.13 | 60 | 62.49 | 39.68% |
| PHM | Pulte | | Residential | 128.69 | 100 | 57.11 | 19.85% |
| FSS | Federal Signal | | Pollution & Treatment Controls | 124.44 | 60 | 56.94 | 40.86% |
| EPAC | Enerpac Tool | | Machinery | 41.76 | 70 | 50.55 | 4.67% |
| CW | Curtiss-Wright | | Machinery | 487.37 | 30 | 49.39 | 40.15% |
| GNRC | Generac | | Machinery | 198.80 | 80 | 44.78 | 30.83% |
| TPH | TRI Pointe | | Residential | 34.91 | 90 | 41.33 | -1.74% |
| GTES | Gates | | Machinery | 24.10 | 30 | 40.85 | 23.14% |
| EXP | Eagle Materials | | Cement | 233.47 | 60 | 40.27 | -2.01% |
| TMHC | Taylor Morrison | | Residential | 67.98 | 100 | 39.81 | 13.27% |
| WWD | Woodward | | Aerospace/Defense | 245.31 | 20 | 27.35 | 48.75% |
| PNR | Pentair | | Equipment | 104.98 | 60 | 21.05 | 9.17% |
| OC | Owens Corning | | Building Materials | 150.27 | 90 | 20.25 | -7.49% |
| BLDR | Builders FirstSource | | Building Materials | 136.88 | 50 | 20.11 | 1.03% |
| ACA | Arcosa | | Machinery | 96.63 | 70 | 19.85 | 3.79% |
| DCI | Donaldson | | Machinery | 73.38 | 60 | 19.22 | 13.83% |
| JHX | James Hardie | | Cement | 29.01 | 80 | 15.05 | -3.73% |
| AOS | A. O. | | Electrical Equipment | 72.21 | 80 | 12.70 | 9.59% |
| LNZA | LanzaTech Global | | Waste Mgmt | 0.26 | 74 | 10.19 | -70.53% |
| SNCY | Sun Country | | Airlines | 12.20 | 70 | 8.46 | -10.97% |
| For chart view version of above stock list: Chart View ➞ 0 - 25 , 25 - 50 , 50 - 75 , 75 - 100 , 100 - 125 | ||
 | Click To Change The Sort Order: By Market Cap or Company Size Performance: Year-to-date, Week and Day |  |
|
Get the most comprehensive stock market coverage daily at 12Stocks.com ➞ Best Stocks Today ➞ Best Stocks Weekly ➞ Best Stocks Year-to-Date ➞ Best Stocks Trends ➞  Best Stocks Today 12Stocks.com Best Nasdaq Stocks ➞ Best S&P 500 Stocks ➞ Best Tech Stocks ➞ Best Biotech Stocks ➞ |
| Detailed Overview of Industrial Stocks |
| Industrial Technical Overview, Leaders & Laggards, Top Industrial ETF Funds & Detailed Industrial Stocks List, Charts, Trends & More |
| Industrial Sector: Technical Analysis, Trends & YTD Performance | |
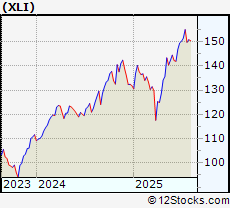
| Industrial sector is composed of stocks
from industrial machinery, aerospace, defense, farm/construction
and industrial services subsectors. Industrial sector, as represented by XLI, an exchange-traded fund [ETF] that holds basket of Industrial stocks (e.g, Caterpillar, Boeing) is up by 16.43% and is currently outperforming the overall market by 6.1% year-to-date. Below is a quick view of Technical charts and trends: |
|
 XLI Weekly Chart |
|
| Long Term Trend: Very Good | |
| Medium Term Trend: Deteriorating | |
 XLI Daily Chart |
|
| Short Term Trend: Not Good | |
| Overall Trend Score: 30 | |
| YTD Performance: 16.43% | |
| **Trend Scores & Views Are Only For Educational Purposes And Not For Investing | |
| 12Stocks.com: Top Performing Industrial Sector Stocks | ||||||||||||||||||||||||||||||||||||||||||||||||
 The top performing Industrial sector stocks year to date are
Now, more recently, over last week, the top performing Industrial sector stocks on the move are


|
||||||||||||||||||||||||||||||||||||||||||||||||
| 12Stocks.com: Investing in Industrial Sector using Exchange Traded Funds | |
|
The following table shows list of key exchange traded funds (ETF) that
help investors track Industrial Index. For detailed view, check out our ETF Funds section of our website. Quick View: Move mouse or cursor over ETF symbol (ticker) to view short-term Technical chart and over ETF name to view long term chart. Click on ticker or stock name for detailed view. Click on to add stock symbol to your watchlist and to view watchlist. |
12Stocks.com List of ETFs that track Industrial Index
| Ticker | ETF Name | Watchlist | Recent Price | Smart Investing & Trading Score | Change % | Week % | Year-to-date % |
| XLI | Industrial | | 150.44 | 30 | 1.17 | 1.03 | 16.43% |
| UXI | Industrials | | 44.33 | 30 | 31.9 | 2 | 26.16% |
| PPA | Aerospace & Defense | | 146.23 | 20 | 0.64 | 0.39 | 29.15% |
| ITA | Aerospace & Defense | | 195.08 | 20 | 0.67 | -0.3 | 35.76% |
| ITB | Home Construction | | 109.62 | 100 | 4.39 | 7.99 | 9.08% |
| XHB | Homebuilders | | 113.34 | 100 | 4.45 | 8.64 | 11.28% |
| SIJ | Short Industrials | | 12.29 | 70 | -1.1 | -1.91 | -27.73% |
| IYJ | Industrials | | 143.75 | 30 | 1.02 | 1.74 | 9.55% |
| EXI | Global Industrials | | 169.04 | 50 | 1.32 | 1.47 | 21.49% |
| VIS | Industrials | | 288.11 | 30 | 19.27 | 1.49 | 15.62% |
| PSCI | SmallCap Industrials | | 145.06 | 60 | 2.89 | 5.67 | 11.45% |
| XAR | Aerospace & Defense | | 215.51 | 30 | 0.99 | 0.99 | 32.3% |
| ARKQ | ARK Industrial Innovation | | 99.95 | 80 | 2.92 | 3.86 | 32.12% |
| 12Stocks.com: Charts, Trends, Fundamental Data and Performances of Industrial Stocks | |
|
We now take in-depth look at all Industrial stocks including charts, multi-period performances and overall trends (as measured by Smart Investing & Trading Score). One can sort Industrial stocks (click link to choose) by Daily, Weekly and by Year-to-Date performances. Also, one can sort by size of the company or by market capitalization. |
| Select Your Default Chart Type: | |||||
| |||||
| Click on stock symbol or name for detailed view. Click on to add stock symbol to your watchlist and to view watchlist. Quick View: Move mouse or cursor over "Daily" to quickly view daily Technical stock chart and over "Weekly" to view weekly Technical stock chart. | |||||

 | ERJ Embraer S.A. |
| Sector: Industrials | |
| SubSector: Aerospace/Defense Products & Services | |
| MarketCap: 1623.71 Millions | |
| Recent Price: 57.52 Smart Investing & Trading Score: 40 | |
| Day Percent Change: 128.34% Day Change: 18.93 | |
| Week Change: 2.75% Year-to-date Change: 60.2% | |
| ERJ Links: Profile News Message Board | |
| Charts:- Daily , Weekly | |
| Add ERJ to Watchlist: View: Get Complete ERJ Trend Analysis ➞ | |
 | SPCE Virgin Galactic Holdings, Inc. |
| Sector: Industrials | |
| SubSector: Conglomerates | |
| MarketCap: 2612.48 Millions | |
| Recent Price: 2.99 Smart Investing & Trading Score: 20 | |
| Day Percent Change: 105.78% Day Change: 3.66 | |
| Week Change: -19.58% Year-to-date Change: -48.3% | |
| SPCE Links: Profile News Message Board | |
| Charts:- Daily , Weekly | |
| Add SPCE to Watchlist: View: Get Complete SPCE Trend Analysis ➞ | |
 | AVAV AeroVironment, Inc. |
| Sector: Industrials | |
| SubSector: Aerospace/Defense Products & Services | |
| MarketCap: 1502.41 Millions | |
| Recent Price: 246.65 Smart Investing & Trading Score: 40 | |
| Day Percent Change: 91.63% Day Change: 88.76 | |
| Week Change: -3.15% Year-to-date Change: 65.6% | |
| AVAV Links: Profile News Message Board | |
| Charts:- Daily , Weekly | |
| Add AVAV to Watchlist: View: Get Complete AVAV Trend Analysis ➞ | |
 | FIX Comfort Systems USA, Inc. |
| Sector: Industrials | |
| SubSector: General Contractors | |
| MarketCap: 1440.63 Millions | |
| Recent Price: 680.86 Smart Investing & Trading Score: 30 | |
| Day Percent Change: 86.98% Day Change: 157.46 | |
| Week Change: 1.69% Year-to-date Change: 65.9% | |
| FIX Links: Profile News Message Board | |
| Charts:- Daily , Weekly | |
| Add FIX to Watchlist: View: Get Complete FIX Trend Analysis ➞ | |
 | TOL Toll Brothers, Inc. |
| Sector: Industrials | |
| SubSector: Residential Construction | |
| MarketCap: 2278.26 Millions | |
| Recent Price: 130.50 Smart Investing & Trading Score: 100 | |
| Day Percent Change: 84.15% Day Change: 67.96 | |
| Week Change: 5.94% Year-to-date Change: 6.6% | |
| TOL Links: Profile News Message Board | |
| Charts:- Daily , Weekly | |
| Add TOL to Watchlist: View: Get Complete TOL Trend Analysis ➞ | |
 | AWI Armstrong World Industries, Inc. |
| Sector: Industrials | |
| SubSector: General Building Materials | |
| MarketCap: 3609.53 Millions | |
| Recent Price: 194.13 Smart Investing & Trading Score: 60 | |
| Day Percent Change: 62.49% Day Change: 48.42 | |
| Week Change: 3% Year-to-date Change: 39.7% | |
| AWI Links: Profile News Message Board | |
| Charts:- Daily , Weekly | |
| Add AWI to Watchlist: View: Get Complete AWI Trend Analysis ➞ | |
 | PHM PulteGroup, Inc. |
| Sector: Industrials | |
| SubSector: Residential Construction | |
| MarketCap: 6186.46 Millions | |
| Recent Price: 128.69 Smart Investing & Trading Score: 100 | |
| Day Percent Change: 57.11% Day Change: 49.12 | |
| Week Change: 8.09% Year-to-date Change: 19.9% | |
| PHM Links: Profile News Message Board | |
| Charts:- Daily , Weekly | |
| Add PHM to Watchlist: View: Get Complete PHM Trend Analysis ➞ | |
 | FSS Federal Signal Corporation |
| Sector: Industrials | |
| SubSector: Pollution & Treatment Controls | |
| MarketCap: 1694.05 Millions | |
| Recent Price: 124.44 Smart Investing & Trading Score: 60 | |
| Day Percent Change: 56.94% Day Change: 34.09 | |
| Week Change: 3.47% Year-to-date Change: 40.9% | |
| FSS Links: Profile News Message Board | |
| Charts:- Daily , Weekly | |
| Add FSS to Watchlist: View: Get Complete FSS Trend Analysis ➞ | |
 | EPAC Enerpac Tool Group Corp. |
| Sector: Industrials | |
| SubSector: Diversified Machinery | |
| MarketCap: 1044.16 Millions | |
| Recent Price: 41.76 Smart Investing & Trading Score: 70 | |
| Day Percent Change: 50.55% Day Change: 13.67 | |
| Week Change: 7.1% Year-to-date Change: 4.7% | |
| EPAC Links: Profile News Message Board | |
| Charts:- Daily , Weekly | |
| Add EPAC to Watchlist: View: Get Complete EPAC Trend Analysis ➞ | |
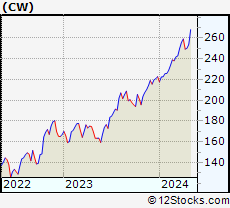 | CW Curtiss-Wright Corporation |
| Sector: Industrials | |
| SubSector: Diversified Machinery | |
| MarketCap: 4057.56 Millions | |
| Recent Price: 487.37 Smart Investing & Trading Score: 30 | |
| Day Percent Change: 49.39% Day Change: 102.49 | |
| Week Change: -2.46% Year-to-date Change: 40.2% | |
| CW Links: Profile News Message Board | |
| Charts:- Daily , Weekly | |
| Add CW to Watchlist: View: Get Complete CW Trend Analysis ➞ | |
 | GNRC Generac Holdings Inc. |
| Sector: Industrials | |
| SubSector: Diversified Machinery | |
| MarketCap: 5736.26 Millions | |
| Recent Price: 198.80 Smart Investing & Trading Score: 80 | |
| Day Percent Change: 44.78% Day Change: 48.51 | |
| Week Change: 4.61% Year-to-date Change: 30.8% | |
| GNRC Links: Profile News Message Board | |
| Charts:- Daily , Weekly | |
| Add GNRC to Watchlist: View: Get Complete GNRC Trend Analysis ➞ | |
 | TPH TRI Pointe Group, Inc. |
| Sector: Industrials | |
| SubSector: Residential Construction | |
| MarketCap: 1140.06 Millions | |
| Recent Price: 34.91 Smart Investing & Trading Score: 90 | |
| Day Percent Change: 41.33% Day Change: 13.42 | |
| Week Change: 7.81% Year-to-date Change: -1.7% | |
| TPH Links: Profile News Message Board | |
| Charts:- Daily , Weekly | |
| Add TPH to Watchlist: View: Get Complete TPH Trend Analysis ➞ | |
 | GTES Gates Industrial Corporation plc |
| Sector: Industrials | |
| SubSector: Diversified Machinery | |
| MarketCap: 2152.36 Millions | |
| Recent Price: 24.10 Smart Investing & Trading Score: 30 | |
| Day Percent Change: 40.85% Day Change: 5.22 | |
| Week Change: 4.93% Year-to-date Change: 23.1% | |
| GTES Links: Profile News Message Board | |
| Charts:- Daily , Weekly | |
| Add GTES to Watchlist: View: Get Complete GTES Trend Analysis ➞ | |
 | EXP Eagle Materials Inc. |
| Sector: Industrials | |
| SubSector: Cement | |
| MarketCap: 2234.73 Millions | |
| Recent Price: 233.47 Smart Investing & Trading Score: 60 | |
| Day Percent Change: 40.27% Day Change: 76.32 | |
| Week Change: 9.28% Year-to-date Change: -2.0% | |
| EXP Links: Profile News Message Board | |
| Charts:- Daily , Weekly | |
| Add EXP to Watchlist: View: Get Complete EXP Trend Analysis ➞ | |
 | TMHC Taylor Morrison Home Corporation |
| Sector: Industrials | |
| SubSector: Residential Construction | |
| MarketCap: 1336.76 Millions | |
| Recent Price: 67.98 Smart Investing & Trading Score: 100 | |
| Day Percent Change: 39.81% Day Change: 19.55 | |
| Week Change: 7.41% Year-to-date Change: 13.3% | |
| TMHC Links: Profile News Message Board | |
| Charts:- Daily , Weekly | |
| Add TMHC to Watchlist: View: Get Complete TMHC Trend Analysis ➞ | |
 | WWD Woodward, Inc. |
| Sector: Industrials | |
| SubSector: Aerospace/Defense Products & Services | |
| MarketCap: 3764.01 Millions | |
| Recent Price: 245.31 Smart Investing & Trading Score: 20 | |
| Day Percent Change: 27.35% Day Change: 34.9 | |
| Week Change: -1.92% Year-to-date Change: 48.8% | |
| WWD Links: Profile News Message Board | |
| Charts:- Daily , Weekly | |
| Add WWD to Watchlist: View: Get Complete WWD Trend Analysis ➞ | |
 | PNR Pentair plc |
| Sector: Industrials | |
| SubSector: Industrial Equipment & Components | |
| MarketCap: 4326.59 Millions | |
| Recent Price: 104.98 Smart Investing & Trading Score: 60 | |
| Day Percent Change: 21.05% Day Change: 15.1 | |
| Week Change: 6.3% Year-to-date Change: 9.2% | |
| PNR Links: Profile News Message Board | |
| Charts:- Daily , Weekly | |
| Add PNR to Watchlist: View: Get Complete PNR Trend Analysis ➞ | |
 | OC Owens Corning |
| Sector: Industrials | |
| SubSector: General Building Materials | |
| MarketCap: 3686.73 Millions | |
| Recent Price: 150.27 Smart Investing & Trading Score: 90 | |
| Day Percent Change: 20.25% Day Change: 28.92 | |
| Week Change: 5.2% Year-to-date Change: -7.5% | |
| OC Links: Profile News Message Board | |
| Charts:- Daily , Weekly | |
| Add OC to Watchlist: View: Get Complete OC Trend Analysis ➞ | |
 | BLDR Builders FirstSource, Inc. |
| Sector: Industrials | |
| SubSector: General Building Materials | |
| MarketCap: 1714.63 Millions | |
| Recent Price: 136.88 Smart Investing & Trading Score: 50 | |
| Day Percent Change: 20.11% Day Change: 30.51 | |
| Week Change: 10.45% Year-to-date Change: 1.0% | |
| BLDR Links: Profile News Message Board | |
| Charts:- Daily , Weekly | |
| Add BLDR to Watchlist: View: Get Complete BLDR Trend Analysis ➞ | |
 | ACA Arcosa, Inc. |
| Sector: Industrials | |
| SubSector: Farm & Construction Machinery | |
| MarketCap: 1692.57 Millions | |
| Recent Price: 96.63 Smart Investing & Trading Score: 70 | |
| Day Percent Change: 19.85% Day Change: 15.14 | |
| Week Change: 18.34% Year-to-date Change: 3.8% | |
| ACA Links: Profile News Message Board | |
| Charts:- Daily , Weekly | |
| Add ACA to Watchlist: View: Get Complete ACA Trend Analysis ➞ | |
 | DCI Donaldson Company, Inc. |
| Sector: Industrials | |
| SubSector: Diversified Machinery | |
| MarketCap: 4993.46 Millions | |
| Recent Price: 73.38 Smart Investing & Trading Score: 60 | |
| Day Percent Change: 19.22% Day Change: 12.06 | |
| Week Change: 5.43% Year-to-date Change: 13.8% | |
| DCI Links: Profile News Message Board | |
| Charts:- Daily , Weekly | |
| Add DCI to Watchlist: View: Get Complete DCI Trend Analysis ➞ | |
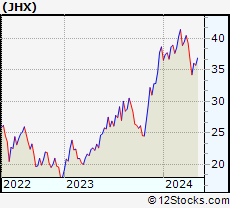 | JHX James Hardie Industries plc |
| Sector: Industrials | |
| SubSector: Cement | |
| MarketCap: 5521 Millions | |
| Recent Price: 29.01 Smart Investing & Trading Score: 80 | |
| Day Percent Change: 15.05% Day Change: 4.67 | |
| Week Change: 7% Year-to-date Change: -3.7% | |
| JHX Links: Profile News Message Board | |
| Charts:- Daily , Weekly | |
| Add JHX to Watchlist: View: Get Complete JHX Trend Analysis ➞ | |
 | AOS A. O. Smith Corporation |
| Sector: Industrials | |
| SubSector: Industrial Electrical Equipment | |
| MarketCap: 5809.89 Millions | |
| Recent Price: 72.21 Smart Investing & Trading Score: 80 | |
| Day Percent Change: 12.7% Day Change: 9.3 | |
| Week Change: 4.37% Year-to-date Change: 9.6% | |
| AOS Links: Profile News Message Board | |
| Charts:- Daily , Weekly | |
| Add AOS to Watchlist: View: Get Complete AOS Trend Analysis ➞ | |
 | LNZA LanzaTech Global, Inc. |
| Sector: Industrials | |
| SubSector: Waste Management | |
| MarketCap: 1340 Millions | |
| Recent Price: 0.26 Smart Investing & Trading Score: 74 | |
| Day Percent Change: 10.19% Day Change: 0.16 | |
| Week Change: 2% Year-to-date Change: -70.5% | |
| LNZA Links: Profile News Message Board | |
| Charts:- Daily , Weekly | |
| Add LNZA to Watchlist: View: Get Complete LNZA Trend Analysis ➞ | |
 | SNCY Sun Country Airlines Holdings, Inc. |
| Sector: Industrials | |
| SubSector: Airlines | |
| MarketCap: 1230 Millions | |
| Recent Price: 12.20 Smart Investing & Trading Score: 70 | |
| Day Percent Change: 8.46% Day Change: 0.79 | |
| Week Change: 22.92% Year-to-date Change: -11.0% | |
| SNCY Links: Profile News Message Board | |
| Charts:- Daily , Weekly | |
| Add SNCY to Watchlist: View: Get Complete SNCY Trend Analysis ➞ | |
| For tabular summary view of above stock list: Summary View ➞ 0 - 25 , 25 - 50 , 50 - 75 , 75 - 100 , 100 - 125 | ||
| Click To Change The Sort Order: By Market Cap or Company Size Performance: Year-to-date, Week and Day | |
| Select Chart Type: | ||
|
Best Stocks Today 12Stocks.com |
© 2025 12Stocks.com Terms & Conditions Privacy Contact Us
All Information Provided Only For Education And Not To Be Used For Investing or Trading. See Terms & Conditions


One More Thing ... Get Best Stocks Delivered Daily!
Never Ever Miss A Move With Our Top Ten Stocks Lists
Find Best Stocks In Any Market - Bull or Bear Market
Take A Peek At Our Top Ten Stocks Lists: Daily, Weekly, Year-to-Date & Top Trends
Find Best Stocks In Any Market - Bull or Bear Market
Take A Peek At Our Top Ten Stocks Lists: Daily, Weekly, Year-to-Date & Top Trends
Industrial Stocks With Best Up Trends [0-bearish to 100-bullish]: Toll Brothers[100], Pulte [100], Taylor Morrison[100], Century Communities[100], Masco [100], Legacy Housing[100], Evolv Technologies[100], Solid Power[100], Meritage Homes[100], Proto Labs[100], Installed Building[100]
Best Industrial Stocks Year-to-Date:
China Yuchai[215.15%], Amprius Technologies[173.93%], Solid Power[155.03%], Tutor Perini[138.64%], Symbotic [126.4%], American Superconductor[119.61%], Joby Aviation[118.82%], Astronics [114.6%], NuScale Power[108.03%], Evolv Technologies[89.62%], Elbit Systems[79.41%] Best Industrial Stocks This Week:
Solid Power[40.52%], Frontier [37.7%], Hillenbrand [34.71%], CompoSecure [34.1%], Installed Building[28.67%], LegalZoom.com [25.35%], Construction Partners[24.32%], China Yuchai[24.26%], Montrose Environmental[23.35%], Sun Country[22.92%], Tutor Perini[22.14%] Best Industrial Stocks Daily:
Embraer S.A[128.34%], Virgin Galactic[105.78%], Graham [92.69%], Argan [92.17%], AeroVironment [91.63%], Construction Partners[90.54%], Comfort Systems[86.98%], Toll Brothers[84.15%], Granite Construction[74.15%], Eastern [68.24%], Armstrong World[62.49%]