
 Login Sign Up


| |||||
 |  | ||||

| 12Stocks.com Market Intelligence |
Best Healthcare Stocks
 | "Discover best trending healthcare stocks with 12Stocks.com." |
| - Subu Vdaygiri, Founder, 12Stocks.com |
| In a hurry? Healthcare Stocks Lists: Performance Trends Table, Stock Charts
Sort Healthcare stocks: Daily, Weekly, Year-to-Date, Market Cap & Trends. Filter Healthcare stocks list by size:All Healthcare Large Mid-Range Small |
| 12Stocks.com Healthcare Stocks Performances & Trends Daily | |||||||||
|
|  The overall Smart Investing & Trading Score is 70 (0-bearish to 100-bullish) which puts Healthcare sector in short term neutral to bullish trend. The Smart Investing & Trading Score from previous trading session is 90 and hence a deterioration of trend.
| ||||||||
Here are the Smart Investing & Trading Scores of the most requested Healthcare stocks at 12Stocks.com (click stock name for detailed review):
|


| 12Stocks.com: Investing in Healthcare sector with Stocks | |
|
The following table helps investors and traders sort through current performance and trends (as measured by Smart Investing & Trading Score) of various
stocks in the Healthcare sector. Quick View: Move mouse or cursor over stock symbol (ticker) to view short-term Technical chart and over stock name to view long term chart. Click on  to add stock symbol to your watchlist and to add stock symbol to your watchlist and  to view watchlist. Click on any ticker or stock name for detailed market intelligence report for that stock. to view watchlist. Click on any ticker or stock name for detailed market intelligence report for that stock. |
12Stocks.com Performance of Stocks in Healthcare Sector
| Ticker | Stock Name | Watchlist | Category | Recent Price | Smart Investing & Trading Score | Change % | YTD Change% |
| MOH | Molina |   | Healthcare Plans | 180.88 | 40 | -4.01 | -37.03% |
| VCEL | Vericel Corp | | Biotechnology | 32.18 | 30 | -4.03 | -41.61% |
| IRMD | Iradimed Corp | | Medical Devices | 71.27 | 40 | -4.04 | 30.53% |
| TNDM | Tandem Diabetes | | Medical Devices | 12.27 | 30 | -4.07 | -65.76% |
| PSNL | Personalis | | Diagnostics & Research | 5.85 | 80 | -4.10 | -6.70% |
| CYTK | Cytokinetics | | Biotechnology | 51.13 | 60 | -4.11 | 4.50% |
| DNA | Ginkgo Bioworks | | Biotechnology | 10.01 | 0 | -4.12 | -2.05% |
| VOR | Vor Biopharma | | Biotechnology | 1.74 | 10 | -4.13 | 55.36% |
| RMTI | Rockwell | | Drug Manufacturers - Specialty & Generic | 1.62 | 50 | -4.14 | -27.03% |
| NEOG | Neogen Corp | | Diagnostics & Research | 5.50 | 40 | -4.18 | -53.94% |
| ALEC | Alector | | Biotechnology | 2.75 | 50 | -4.18 | 45.50% |
| ILMN | Illumina | | Diagnostics & Research | 95.12 | 10 | -4.22 | -27.35% |
| DNLI | Denali | | Biotechnology | 14.19 | 30 | -4.25 | -31.91% |
| EOLS | Evolus | | Drug Manufacturers - Specialty & Generic | 7.19 | 20 | -4.26 | -35.28% |
| JANX | Janux | | Biotechnology | 24.05 | 50 | -4.26 | -54.83% |
| CRL | Charles River | | Diagnostics & Research | 152.89 | 20 | -4.29 | -16.29% |
| CGEN | Compugen | | Biotechnology | 1.34 | 0 | -4.29 | -18.79% |
| MRVI | Maravai LifeSciences | | Biotechnology | 2.67 | 80 | -4.30 | -51.37% |
| CTMX | CytomX | | Biotechnology | 2.00 | 10 | -4.31 | 88.68% |
| GHRS | GH Research | | Biotechnology | 11.94 | 0 | -4.33 | 50.95% |
| PRAX | Praxis Precision | | Biotechnology | 37.70 | 0 | -4.35 | -52.58% |
| OMCL | Omnicell | | Health Information | 31.83 | 20 | -4.36 | -28.18% |
| CYCCP | Cyclacel | | Biotechnology | 5.05 | 30 | -4.36 | -35.65% |
| ENTA | Enanta | | Biotechnology | 8.28 | 30 | -4.39 | 48.12% |
| CELC | Celcuity | | Biotechnology | 54.91 | 50 | -4.39 | 318.20% |
| For chart view version of above stock list: Chart View ➞ 0 - 25 , 25 - 50 , 50 - 75 , 75 - 100 , 100 - 125 , 125 - 150 , 150 - 175 , 175 - 200 , 200 - 225 , 225 - 250 , 250 - 275 , 275 - 300 , 300 - 325 , 325 - 350 , 350 - 375 , 375 - 400 , 400 - 425 , 425 - 450 , 450 - 475 , 475 - 500 , 500 - 525 , 525 - 550 , 550 - 575 , 575 - 600 , 600 - 625 , 625 - 650 , 650 - 675 , 675 - 700 , 700 - 725 , 725 - 750 , 750 - 775 , 775 - 800 , 800 - 825 , 825 - 850 , 850 - 875 , 875 - 900 , 900 - 925 , 925 - 950 , 950 - 975 , 975 - 1000 | ||
 | Click To Change The Sort Order: By Market Cap or Company Size Performance: Year-to-date, Week and Day |  |
|
Get the most comprehensive stock market coverage daily at 12Stocks.com ➞ Best Stocks Today ➞ Best Stocks Weekly ➞ Best Stocks Year-to-Date ➞ Best Stocks Trends ➞  Best Stocks Today 12Stocks.com Best Nasdaq Stocks ➞ Best S&P 500 Stocks ➞ Best Tech Stocks ➞ Best Biotech Stocks ➞ |
| Detailed Overview of Healthcare Stocks |
| Healthcare Technical Overview, Leaders & Laggards, Top Healthcare ETF Funds & Detailed Healthcare Stocks List, Charts, Trends & More |
| Healthcare Sector: Technical Analysis, Trends & YTD Performance | |
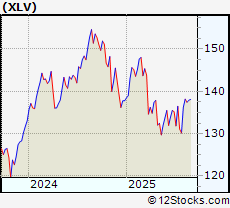
| Healthcare sector is composed of stocks
from pharmaceutical, biotech, diagnostics labs, insurance providers
and healthcare services. Healthcare sector, as represented by XLV, an exchange-traded fund [ETF] that holds basket of Healthcare stocks (e.g, Merck, Amgen) is up by 1.23288% and is currently underperforming the overall market by -11.61812% year-to-date. Below is a quick view of Technical charts and trends: |
|
 XLV Weekly Chart |
|
| Long Term Trend: Very Good | |
| Medium Term Trend: Deteriorating | |
 XLV Daily Chart |
|
| Short Term Trend: Not Good | |
| Overall Trend Score: 70 | |
| YTD Performance: 1.23288% | |
| **Trend Scores & Views Are Only For Educational Purposes And Not For Investing | |
| 12Stocks.com: Top Performing Healthcare Sector Stocks | ||||||||||||||||||||||||||||||||||||||||||||||
 The top performing Healthcare sector stocks year to date are
Now, more recently, over last week, the top performing Healthcare sector stocks on the move are


|
||||||||||||||||||||||||||||||||||||||||||||||
| 12Stocks.com: Investing in Healthcare Sector using Exchange Traded Funds | |
|
The following table shows list of key exchange traded funds (ETF) that
help investors track Healthcare Index. For detailed view, check out our ETF Funds section of our website. Quick View: Move mouse or cursor over ETF symbol (ticker) to view short-term Technical chart and over ETF name to view long term chart. Click on ticker or stock name for detailed view. Click on to add stock symbol to your watchlist and to view watchlist. |
12Stocks.com List of ETFs that track Healthcare Index
| Ticker | ETF Name | Watchlist | Recent Price | Smart Investing & Trading Score | Change % | Week % | Year-to-date % |
| BTEC | Principal Healthcare Innovators | | 39.49 | 30 | 0 | 1.02328 | 0% |
| 12Stocks.com: Charts, Trends, Fundamental Data and Performances of Healthcare Stocks | |
|
We now take in-depth look at all Healthcare stocks including charts, multi-period performances and overall trends (as measured by Smart Investing & Trading Score). One can sort Healthcare stocks (click link to choose) by Daily, Weekly and by Year-to-Date performances. Also, one can sort by size of the company or by market capitalization. |
| Select Your Default Chart Type: | |||||
| |||||
| Click on stock symbol or name for detailed view. Click on to add stock symbol to your watchlist and to view watchlist. Quick View: Move mouse or cursor over "Daily" to quickly view daily Technical stock chart and over "Weekly" to view weekly Technical stock chart. | |||||

 | MOH Molina Healthcare Inc |
| Sector: Health Care | |
| SubSector: Healthcare Plans | |
| MarketCap: 9466.03 Millions | |
| Recent Price: 180.88 Smart Investing & Trading Score: 40 | |
| Day Percent Change: -4.01189% Day Change: -5.79 | |
| Week Change: 5.88304% Year-to-date Change: -37.0% | |
| MOH Links: Profile News Message Board | |
| Charts:- Daily , Weekly | |
| Add MOH to Watchlist: View: Get Complete MOH Trend Analysis ➞ | |
 | VCEL Vericel Corp |
| Sector: Health Care | |
| SubSector: Biotechnology | |
| MarketCap: 1718.17 Millions | |
| Recent Price: 32.18 Smart Investing & Trading Score: 30 | |
| Day Percent Change: -4.02625% Day Change: 0.08 | |
| Week Change: -4.4253% Year-to-date Change: -41.6% | |
| VCEL Links: Profile News Message Board | |
| Charts:- Daily , Weekly | |
| Add VCEL to Watchlist: View: Get Complete VCEL Trend Analysis ➞ | |
 | IRMD Iradimed Corp |
| Sector: Health Care | |
| SubSector: Medical Devices | |
| MarketCap: 915.71 Millions | |
| Recent Price: 71.27 Smart Investing & Trading Score: 40 | |
| Day Percent Change: -4.03932% Day Change: 0.71 | |
| Week Change: -1.20599% Year-to-date Change: 30.5% | |
| IRMD Links: Profile News Message Board | |
| Charts:- Daily , Weekly | |
| Add IRMD to Watchlist: View: Get Complete IRMD Trend Analysis ➞ | |
 | TNDM Tandem Diabetes Care Inc |
| Sector: Health Care | |
| SubSector: Medical Devices | |
| MarketCap: 850.02 Millions | |
| Recent Price: 12.27 Smart Investing & Trading Score: 30 | |
| Day Percent Change: -4.06568% Day Change: -0.67 | |
| Week Change: -0.968523% Year-to-date Change: -65.8% | |
| TNDM Links: Profile News Message Board | |
| Charts:- Daily , Weekly | |
| Add TNDM to Watchlist: View: Get Complete TNDM Trend Analysis ➞ | |
 | PSNL Personalis Inc |
| Sector: Health Care | |
| SubSector: Diagnostics & Research | |
| MarketCap: 464.67 Millions | |
| Recent Price: 5.85 Smart Investing & Trading Score: 80 | |
| Day Percent Change: -4.09836% Day Change: 0.02 | |
| Week Change: 22.3849% Year-to-date Change: -6.7% | |
| PSNL Links: Profile News Message Board | |
| Charts:- Daily , Weekly | |
| Add PSNL to Watchlist: View: Get Complete PSNL Trend Analysis ➞ | |
 | CYTK Cytokinetics Inc |
| Sector: Health Care | |
| SubSector: Biotechnology | |
| MarketCap: 6343.03 Millions | |
| Recent Price: 51.13 Smart Investing & Trading Score: 60 | |
| Day Percent Change: -4.10728% Day Change: 0.73 | |
| Week Change: 2.77387% Year-to-date Change: 4.5% | |
| CYTK Links: Profile News Message Board | |
| Charts:- Daily , Weekly | |
| Add CYTK to Watchlist: View: Get Complete CYTK Trend Analysis ➞ | |
 | DNA Ginkgo Bioworks Holdings Inc |
| Sector: Health Care | |
| SubSector: Biotechnology | |
| MarketCap: 660.08 Millions | |
| Recent Price: 10.01 Smart Investing & Trading Score: 0 | |
| Day Percent Change: -4.11877% Day Change: -0.37 | |
| Week Change: -14.2979% Year-to-date Change: -2.1% | |
| DNA Links: Profile News Message Board | |
| Charts:- Daily , Weekly | |
| Add DNA to Watchlist: View: Get Complete DNA Trend Analysis ➞ | |
 | VOR Vor Biopharma Inc |
| Sector: Health Care | |
| SubSector: Biotechnology | |
| MarketCap: 248.3 Millions | |
| Recent Price: 1.74 Smart Investing & Trading Score: 10 | |
| Day Percent Change: -4.13223% Day Change: -0.03 | |
| Week Change: -10.3093% Year-to-date Change: 55.4% | |
| VOR Links: Profile News Message Board | |
| Charts:- Daily , Weekly | |
| Add VOR to Watchlist: View: Get Complete VOR Trend Analysis ➞ | |
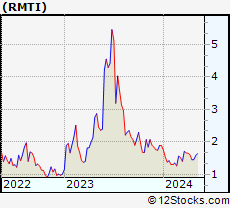 | RMTI Rockwell Medical Inc |
| Sector: Health Care | |
| SubSector: Drug Manufacturers - Specialty & Generic | |
| MarketCap: 55.78 Millions | |
| Recent Price: 1.62 Smart Investing & Trading Score: 50 | |
| Day Percent Change: -4.14201% Day Change: 0.1 | |
| Week Change: -3.57143% Year-to-date Change: -27.0% | |
| RMTI Links: Profile News Message Board | |
| Charts:- Daily , Weekly | |
| Add RMTI to Watchlist: View: Get Complete RMTI Trend Analysis ➞ | |
 | NEOG Neogen Corp |
| Sector: Health Care | |
| SubSector: Diagnostics & Research | |
| MarketCap: 1248.93 Millions | |
| Recent Price: 5.50 Smart Investing & Trading Score: 40 | |
| Day Percent Change: -4.18118% Day Change: 0.03 | |
| Week Change: -4.18118% Year-to-date Change: -53.9% | |
| NEOG Links: Profile News Message Board | |
| Charts:- Daily , Weekly | |
| Add NEOG to Watchlist: View: Get Complete NEOG Trend Analysis ➞ | |
 | ALEC Alector Inc |
| Sector: Health Care | |
| SubSector: Biotechnology | |
| MarketCap: 304.65 Millions | |
| Recent Price: 2.75 Smart Investing & Trading Score: 50 | |
| Day Percent Change: -4.18118% Day Change: 0.07 | |
| Week Change: -2.48227% Year-to-date Change: 45.5% | |
| ALEC Links: Profile News Message Board | |
| Charts:- Daily , Weekly | |
| Add ALEC to Watchlist: View: Get Complete ALEC Trend Analysis ➞ | |
 | ILMN Illumina Inc |
| Sector: Health Care | |
| SubSector: Diagnostics & Research | |
| MarketCap: 15205.5 Millions | |
| Recent Price: 95.12 Smart Investing & Trading Score: 10 | |
| Day Percent Change: -4.21911% Day Change: -2.88 | |
| Week Change: -2.6208% Year-to-date Change: -27.4% | |
| ILMN Links: Profile News Message Board | |
| Charts:- Daily , Weekly | |
| Add ILMN to Watchlist: View: Get Complete ILMN Trend Analysis ➞ | |
 | DNLI Denali Therapeutics Inc |
| Sector: Health Care | |
| SubSector: Biotechnology | |
| MarketCap: 2256.06 Millions | |
| Recent Price: 14.19 Smart Investing & Trading Score: 30 | |
| Day Percent Change: -4.25101% Day Change: 0.72 | |
| Week Change: -4.0568% Year-to-date Change: -31.9% | |
| DNLI Links: Profile News Message Board | |
| Charts:- Daily , Weekly | |
| Add DNLI to Watchlist: View: Get Complete DNLI Trend Analysis ➞ | |
 | EOLS Evolus Inc |
| Sector: Health Care | |
| SubSector: Drug Manufacturers - Specialty & Generic | |
| MarketCap: 495.49 Millions | |
| Recent Price: 7.19 Smart Investing & Trading Score: 20 | |
| Day Percent Change: -4.26099% Day Change: 0.19 | |
| Week Change: -4.26099% Year-to-date Change: -35.3% | |
| EOLS Links: Profile News Message Board | |
| Charts:- Daily , Weekly | |
| Add EOLS to Watchlist: View: Get Complete EOLS Trend Analysis ➞ | |
 | JANX Janux Therapeutics Inc |
| Sector: Health Care | |
| SubSector: Biotechnology | |
| MarketCap: 1441.05 Millions | |
| Recent Price: 24.05 Smart Investing & Trading Score: 50 | |
| Day Percent Change: -4.25955% Day Change: -0.87 | |
| Week Change: 0.459482% Year-to-date Change: -54.8% | |
| JANX Links: Profile News Message Board | |
| Charts:- Daily , Weekly | |
| Add JANX to Watchlist: View: Get Complete JANX Trend Analysis ➞ | |
 | CRL Charles River Laboratories International Inc |
| Sector: Health Care | |
| SubSector: Diagnostics & Research | |
| MarketCap: 8070.63 Millions | |
| Recent Price: 152.89 Smart Investing & Trading Score: 20 | |
| Day Percent Change: -4.28822% Day Change: -6.32 | |
| Week Change: -5.80371% Year-to-date Change: -16.3% | |
| CRL Links: Profile News Message Board | |
| Charts:- Daily , Weekly | |
| Add CRL to Watchlist: View: Get Complete CRL Trend Analysis ➞ | |
 | CGEN Compugen Ltd |
| Sector: Health Care | |
| SubSector: Biotechnology | |
| MarketCap: 133.76 Millions | |
| Recent Price: 1.34 Smart Investing & Trading Score: 0 | |
| Day Percent Change: -4.28571% Day Change: -0.01 | |
| Week Change: -4.96454% Year-to-date Change: -18.8% | |
| CGEN Links: Profile News Message Board | |
| Charts:- Daily , Weekly | |
| Add CGEN to Watchlist: View: Get Complete CGEN Trend Analysis ➞ | |
 | MRVI Maravai LifeSciences Holdings Inc |
| Sector: Health Care | |
| SubSector: Biotechnology | |
| MarketCap: 640.96 Millions | |
| Recent Price: 2.67 Smart Investing & Trading Score: 80 | |
| Day Percent Change: -4.30108% Day Change: -0.07 | |
| Week Change: 13.1356% Year-to-date Change: -51.4% | |
| MRVI Links: Profile News Message Board | |
| Charts:- Daily , Weekly | |
| Add MRVI to Watchlist: View: Get Complete MRVI Trend Analysis ➞ | |
 | CTMX CytomX Therapeutics Inc |
| Sector: Health Care | |
| SubSector: Biotechnology | |
| MarketCap: 376 Millions | |
| Recent Price: 2.00 Smart Investing & Trading Score: 10 | |
| Day Percent Change: -4.30622% Day Change: 0.06 | |
| Week Change: -4.7619% Year-to-date Change: 88.7% | |
| CTMX Links: Profile News Message Board | |
| Charts:- Daily , Weekly | |
| Add CTMX to Watchlist: View: Get Complete CTMX Trend Analysis ➞ | |
 | GHRS GH Research PLC |
| Sector: Health Care | |
| SubSector: Biotechnology | |
| MarketCap: 873.98 Millions | |
| Recent Price: 11.94 Smart Investing & Trading Score: 0 | |
| Day Percent Change: -4.32692% Day Change: 0.21 | |
| Week Change: -15.0178% Year-to-date Change: 50.9% | |
| GHRS Links: Profile News Message Board | |
| Charts:- Daily , Weekly | |
| Add GHRS to Watchlist: View: Get Complete GHRS Trend Analysis ➞ | |
 | PRAX Praxis Precision Medicines Inc |
| Sector: Health Care | |
| SubSector: Biotechnology | |
| MarketCap: 985.99 Millions | |
| Recent Price: 37.70 Smart Investing & Trading Score: 0 | |
| Day Percent Change: -4.35058% Day Change: 1.13 | |
| Week Change: -18.1927% Year-to-date Change: -52.6% | |
| PRAX Links: Profile News Message Board | |
| Charts:- Daily , Weekly | |
| Add PRAX to Watchlist: View: Get Complete PRAX Trend Analysis ➞ | |
 | OMCL Omnicell, Inc |
| Sector: Health Care | |
| SubSector: Health Information Services | |
| MarketCap: 1474.95 Millions | |
| Recent Price: 31.83 Smart Investing & Trading Score: 20 | |
| Day Percent Change: -4.35697% Day Change: 0.14 | |
| Week Change: -3.89493% Year-to-date Change: -28.2% | |
| OMCL Links: Profile News Message Board | |
| Charts:- Daily , Weekly | |
| Add OMCL to Watchlist: View: Get Complete OMCL Trend Analysis ➞ | |
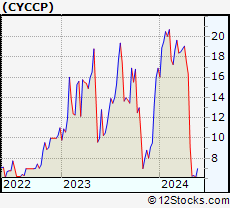 | CYCCP Cyclacel Pharmaceuticals, Inc. |
| Sector: Health Care | |
| SubSector: Biotechnology | |
| MarketCap: 74.9785 Millions | |
| Recent Price: 5.05 Smart Investing & Trading Score: 30 | |
| Day Percent Change: -4.35606% Day Change: -5.42 | |
| Week Change: 5.20833% Year-to-date Change: -35.7% | |
| CYCCP Links: Profile News Message Board | |
| Charts:- Daily , Weekly | |
| Add CYCCP to Watchlist: View: Get Complete CYCCP Trend Analysis ➞ | |
 | ENTA Enanta Pharmaceuticals Inc |
| Sector: Health Care | |
| SubSector: Biotechnology | |
| MarketCap: 189.19 Millions | |
| Recent Price: 8.28 Smart Investing & Trading Score: 30 | |
| Day Percent Change: -4.38799% Day Change: -0.23 | |
| Week Change: -6.86164% Year-to-date Change: 48.1% | |
| ENTA Links: Profile News Message Board | |
| Charts:- Daily , Weekly | |
| Add ENTA to Watchlist: View: Get Complete ENTA Trend Analysis ➞ | |
 | CELC Celcuity Inc |
| Sector: Health Care | |
| SubSector: Biotechnology | |
| MarketCap: 2362.53 Millions | |
| Recent Price: 54.91 Smart Investing & Trading Score: 50 | |
| Day Percent Change: -4.38795% Day Change: 1.61 | |
| Week Change: 0.807784% Year-to-date Change: 318.2% | |
| CELC Links: Profile News Message Board | |
| Charts:- Daily , Weekly | |
| Add CELC to Watchlist: View: Get Complete CELC Trend Analysis ➞ | |
| For tabular summary view of above stock list: Summary View ➞ 0 - 25 , 25 - 50 , 50 - 75 , 75 - 100 , 100 - 125 , 125 - 150 , 150 - 175 , 175 - 200 , 200 - 225 , 225 - 250 , 250 - 275 , 275 - 300 , 300 - 325 , 325 - 350 , 350 - 375 , 375 - 400 , 400 - 425 , 425 - 450 , 450 - 475 , 475 - 500 , 500 - 525 , 525 - 550 , 550 - 575 , 575 - 600 , 600 - 625 , 625 - 650 , 650 - 675 , 675 - 700 , 700 - 725 , 725 - 750 , 750 - 775 , 775 - 800 , 800 - 825 , 825 - 850 , 850 - 875 , 875 - 900 , 900 - 925 , 925 - 950 , 950 - 975 , 975 - 1000 | ||
| Click To Change The Sort Order: By Market Cap or Company Size Performance: Year-to-date, Week and Day | |
| Select Chart Type: | ||
|
Best Stocks Today 12Stocks.com |
© 2025 12Stocks.com Terms & Conditions Privacy Contact Us
All Information Provided Only For Education And Not To Be Used For Investing or Trading. See Terms & Conditions


One More Thing ... Get Best Stocks Delivered Daily!
Never Ever Miss A Move With Our Top Ten Stocks Lists
Find Best Stocks In Any Market - Bull or Bear Market
Take A Peek At Our Top Ten Stocks Lists: Daily, Weekly, Year-to-Date & Top Trends
Find Best Stocks In Any Market - Bull or Bear Market
Take A Peek At Our Top Ten Stocks Lists: Daily, Weekly, Year-to-Date & Top Trends
Healthcare Stocks With Best Up Trends [0-bearish to 100-bullish]: AlloVir [100], Cara [100], Spruce Biosciences[100], Kala Bio[100], Protalix Bio[100], Microbot [100], Kindred [100], Lineage Cell[100], Scilex Holding[100], Immuneering Corp[100], RAPT [100]
Best Healthcare Stocks Year-to-Date:
Regencell Bioscience[11493.1%], Kaleido BioSciences[9900%], Eagle [664.286%], So-Young [375.53%], Galectin [358.974%], I-Mab ADR[351.435%], Celcuity [318.203%], Immuneering Corp[284.163%], Biosig Technologies[270%], Gossamer Bio[256.701%], Microbot [255.263%] Best Healthcare Stocks This Week:
Athersys [193287%], Nobilis Health[101349%], VBI Vaccines[86898.5%], ContraFect [47677.8%], Clovis Oncology[39610.5%], Endo [28369.6%], NanoString Technologies[17224.7%], Neptune Wellness[14100%], ViewRay [11470.2%], Mallkrodt [11382.1%], Achillion [10033.3%] Best Healthcare Stocks Daily:
Kaleido BioSciences[9900%], Neoleukin [332.665%], Syros [226.23%], Athenex [103.333%], Accelerate Diagnostics[17.6471%], Aptose Biosciences[17.5439%], AlloVir [16.9215%], China SXT[15.1163%], Cara [14.3396%], Tyra Biosciences[14.26%], Prenetics Global[13.7133%]