
 Login Sign Up


| |||||
 |  | ||||

| 12Stocks.com Market Intelligence |
Best Healthcare Stocks
 | "Discover best trending healthcare stocks with 12Stocks.com." |
| - Subu Vdaygiri, Founder, 12Stocks.com |
| In a hurry? Healthcare Stocks Lists: Performance Trends Table, Stock Charts
Sort Healthcare stocks: Daily, Weekly, Year-to-Date, Market Cap & Trends. Filter Healthcare stocks list by size:All Healthcare Large Mid-Range Small |
| 12Stocks.com Healthcare Stocks Performances & Trends Daily | |||||||||
|
|  The overall Smart Investing & Trading Score is 100 (0-bearish to 100-bullish) which puts Healthcare sector in short term bullish trend. The Smart Investing & Trading Score from previous trading session is 70 and an improvement of trend continues.
| ||||||||
Here are the Smart Investing & Trading Scores of the most requested Healthcare stocks at 12Stocks.com (click stock name for detailed review):
|


| 12Stocks.com: Investing in Healthcare sector with Stocks | |
|
The following table helps investors and traders sort through current performance and trends (as measured by Smart Investing & Trading Score) of various
stocks in the Healthcare sector. Quick View: Move mouse or cursor over stock symbol (ticker) to view short-term Technical chart and over stock name to view long term chart. Click on  to add stock symbol to your watchlist and to add stock symbol to your watchlist and  to view watchlist. Click on any ticker or stock name for detailed market intelligence report for that stock. to view watchlist. Click on any ticker or stock name for detailed market intelligence report for that stock. |
12Stocks.com Performance of Stocks in Healthcare Sector
| Ticker | Stock Name | Watchlist | Category | Recent Price | Smart Investing & Trading Score | Change % | Weekly Change% |
| ATRC | Atricure |   | Instruments | 34.29 | 0 | 0.18% | -4.99% |
| XBIT | XBiotech | | Biotechnology | 2.64 | 20 | 0.00% | -5.04% |
| MBOT | Microbot | | Instruments | 3.18 | 30 | 0.63% | -5.07% |
| KIDS | OrthoPediatrics corp | | Medical Devices | 17.93 | 0 | -2.66% | -5.08% |
| ODT | Odonate | | Biotechnology | 12900.00 | 10 | 0.00% | -5.15% |
| HSTM | Healthstream | | Health Information | 27.50 | 20 | 0.07% | -5.17% |
| URGN | UroGen Pharma | | Biotechnology | 17.06 | 20 | -4.24% | -5.17% |
| CNTG | Centogene N.V | | Laboratories | 0.06 | 20 | 0.00% | -5.21% |
| HALO | Halozyme | | Biotechnology | 71.69 | 30 | -4.34% | -5.22% |
| PGNY | Progyny | | Healthcare Plans | 20.55 | 0 | -3.16% | -5.30% |
| MDXG | Mimedx | | Biotechnology | 6.71 | 0 | -1.76% | -5.36% |
| BLTE | Belite Bio | | Biotechnology | 74.06 | 43 | 2.81% | -5.48% |
| EGLT | Egalet | | Biotechnology | 17.16 | 10 | -0.98% | -5.61% |
| AIRS | Airsculpt Technologies | | Medical Care Facilities | 7.95 | 61 | -9.24% | -5.61% |
| PCRX | Pacira BioSciences | | Drug Manufacturers - Specialty & Generic | 24.58 | 20 | -2.73% | -5.64% |
| APHA | Aphria | | Pharmaceutical | 17.23 | 10 | -3.39% | -5.64% |
| BCRX | Biocryst | | Drug Manufacturers - Specialty & Generic | 7.33 | 0 | -0.54% | -5.66% |
| ALVO | Alvotech | | Drug Manufacturers - Specialty & Generic | 8.20 | 40 | 0.12% | -5.75% |
| ALGS | Aligos | | Biotechnology | 10.13 | 70 | -1.55% | -5.77% |
| CYH | Community Health | | Medical Care Facilities | 3.01 | 60 | -3.83% | -5.94% |
| AVRO | AVROBIO | | Biotechnology | 1.40 | 10 | -1.41% | -6.04% |
| JYNT | Joint Corp | | Medical Care Facilities | 9.30 | 0 | 0.32% | -6.06% |
| AGL | Agilon Health | | Medical Care Facilities | 1.08 | 60 | 8.00% | -6.09% |
| PMVP | PMV | | Biotechnology | 1.38 | 20 | 1.47% | -6.12% |
| ANIP | ANI | | Drug Manufacturers - Specialty & Generic | 89.08 | 20 | -1.21% | -6.22% |
| For chart view version of above stock list: Chart View ➞ 0 - 25 , 25 - 50 , 50 - 75 , 75 - 100 , 100 - 125 , 125 - 150 , 150 - 175 , 175 - 200 , 200 - 225 , 225 - 250 , 250 - 275 , 275 - 300 , 300 - 325 , 325 - 350 , 350 - 375 , 375 - 400 , 400 - 425 , 425 - 450 , 450 - 475 , 475 - 500 , 500 - 525 , 525 - 550 , 550 - 575 , 575 - 600 , 600 - 625 , 625 - 650 , 650 - 675 , 675 - 700 , 700 - 725 , 725 - 750 , 750 - 775 , 775 - 800 , 800 - 825 , 825 - 850 , 850 - 875 , 875 - 900 , 900 - 925 , 925 - 950 , 950 - 975 , 975 - 1000 | ||
 | Click To Change The Sort Order: By Market Cap or Company Size Performance: Year-to-date, Week and Day |  |
|
Get the most comprehensive stock market coverage daily at 12Stocks.com ➞ Best Stocks Today ➞ Best Stocks Weekly ➞ Best Stocks Year-to-Date ➞ Best Stocks Trends ➞  Best Stocks Today 12Stocks.com Best Nasdaq Stocks ➞ Best S&P 500 Stocks ➞ Best Tech Stocks ➞ Best Biotech Stocks ➞ |
| Detailed Overview of Healthcare Stocks |
| Healthcare Technical Overview, Leaders & Laggards, Top Healthcare ETF Funds & Detailed Healthcare Stocks List, Charts, Trends & More |
| Healthcare Sector: Technical Analysis, Trends & YTD Performance | |
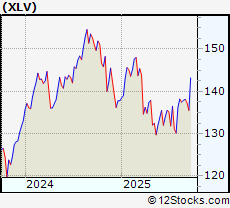
| Healthcare sector is composed of stocks
from pharmaceutical, biotech, diagnostics labs, insurance providers
and healthcare services. Healthcare sector, as represented by XLV, an exchange-traded fund [ETF] that holds basket of Healthcare stocks (e.g, Merck, Amgen) is up by 4.95646% and is currently underperforming the overall market by -9.80144% year-to-date. Below is a quick view of Technical charts and trends: |
|
 XLV Weekly Chart |
|
| Long Term Trend: Very Good | |
| Medium Term Trend: Very Good | |
 XLV Daily Chart |
|
| Short Term Trend: Very Good | |
| Overall Trend Score: 100 | |
| YTD Performance: 4.95646% | |
| **Trend Scores & Views Are Only For Educational Purposes And Not For Investing | |
| 12Stocks.com: Top Performing Healthcare Sector Stocks | ||||||||||||||||||||||||||||||||||||||||||||||
 The top performing Healthcare sector stocks year to date are
Now, more recently, over last week, the top performing Healthcare sector stocks on the move are


|
||||||||||||||||||||||||||||||||||||||||||||||
| 12Stocks.com: Investing in Healthcare Sector using Exchange Traded Funds | |
|
The following table shows list of key exchange traded funds (ETF) that
help investors track Healthcare Index. For detailed view, check out our ETF Funds section of our website. Quick View: Move mouse or cursor over ETF symbol (ticker) to view short-term Technical chart and over ETF name to view long term chart. Click on ticker or stock name for detailed view. Click on to add stock symbol to your watchlist and to view watchlist. |
12Stocks.com List of ETFs that track Healthcare Index
| Ticker | ETF Name | Watchlist | Recent Price | Smart Investing & Trading Score | Change % | Week % | Year-to-date % |
| BTEC | Principal Healthcare Innovators | | 39.49 | 30 | 0 | 1.02328 | 0% |
| 12Stocks.com: Charts, Trends, Fundamental Data and Performances of Healthcare Stocks | |
|
We now take in-depth look at all Healthcare stocks including charts, multi-period performances and overall trends (as measured by Smart Investing & Trading Score). One can sort Healthcare stocks (click link to choose) by Daily, Weekly and by Year-to-Date performances. Also, one can sort by size of the company or by market capitalization. |
| Select Your Default Chart Type: | |||||
| |||||
| Click on stock symbol or name for detailed view. Click on to add stock symbol to your watchlist and to view watchlist. Quick View: Move mouse or cursor over "Daily" to quickly view daily Technical stock chart and over "Weekly" to view weekly Technical stock chart. | |||||

 | ATRC Atricure Inc |
| Sector: Health Care | |
| SubSector: Medical Instruments & Supplies | |
| MarketCap: 1758.44 Millions | |
| Recent Price: 34.29 Smart Investing & Trading Score: 0 | |
| Day Percent Change: 0.175285% Day Change: -0.34 | |
| Week Change: -4.98753% Year-to-date Change: 12.8% | |
| ATRC Links: Profile News Message Board | |
| Charts:- Daily , Weekly | |
| Add ATRC to Watchlist: View: Get Complete ATRC Trend Analysis ➞ | |
 | XBIT XBiotech Inc |
| Sector: Health Care | |
| SubSector: Biotechnology | |
| MarketCap: 89.02 Millions | |
| Recent Price: 2.64 Smart Investing & Trading Score: 20 | |
| Day Percent Change: 0% Day Change: -0.02 | |
| Week Change: -5.03597% Year-to-date Change: -36.7% | |
| XBIT Links: Profile News Message Board | |
| Charts:- Daily , Weekly | |
| Add XBIT to Watchlist: View: Get Complete XBIT Trend Analysis ➞ | |
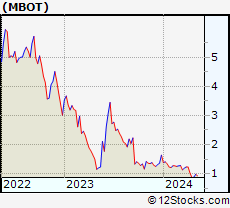 | MBOT Microbot Medical Inc |
| Sector: Health Care | |
| SubSector: Medical Instruments & Supplies | |
| MarketCap: 166.7 Millions | |
| Recent Price: 3.18 Smart Investing & Trading Score: 30 | |
| Day Percent Change: 0.632911% Day Change: 0.25 | |
| Week Change: -5.07463% Year-to-date Change: 178.9% | |
| MBOT Links: Profile News Message Board | |
| Charts:- Daily , Weekly | |
| Add MBOT to Watchlist: View: Get Complete MBOT Trend Analysis ➞ | |
 | KIDS OrthoPediatrics corp |
| Sector: Health Care | |
| SubSector: Medical Devices | |
| MarketCap: 524.29 Millions | |
| Recent Price: 17.93 Smart Investing & Trading Score: 0 | |
| Day Percent Change: -2.66015% Day Change: -0.33 | |
| Week Change: -5.08205% Year-to-date Change: -21.6% | |
| KIDS Links: Profile News Message Board | |
| Charts:- Daily , Weekly | |
| Add KIDS to Watchlist: View: Get Complete KIDS Trend Analysis ➞ | |
 | ODT Odonate Therapeutics, Inc. |
| Sector: Health Care | |
| SubSector: Biotechnology | |
| MarketCap: 684.485 Millions | |
| Recent Price: 12900.00 Smart Investing & Trading Score: 10 | |
| Day Percent Change: 0% Day Change: -9999 | |
| Week Change: -5.14706% Year-to-date Change: 0.0% | |
| ODT Links: Profile News Message Board | |
| Charts:- Daily , Weekly | |
| Add ODT to Watchlist: View: Get Complete ODT Trend Analysis ➞ | |
 | HSTM Healthstream Inc |
| Sector: Health Care | |
| SubSector: Health Information Services | |
| MarketCap: 834.1 Millions | |
| Recent Price: 27.50 Smart Investing & Trading Score: 20 | |
| Day Percent Change: 0.0727802% Day Change: 0.13 | |
| Week Change: -5.17241% Year-to-date Change: -13.1% | |
| HSTM Links: Profile News Message Board | |
| Charts:- Daily , Weekly | |
| Add HSTM to Watchlist: View: Get Complete HSTM Trend Analysis ➞ | |
 | URGN UroGen Pharma Ltd |
| Sector: Health Care | |
| SubSector: Biotechnology | |
| MarketCap: 873.47 Millions | |
| Recent Price: 17.06 Smart Investing & Trading Score: 20 | |
| Day Percent Change: -4.238% Day Change: 0.47 | |
| Week Change: -5.16954% Year-to-date Change: 59.4% | |
| URGN Links: Profile News Message Board | |
| Charts:- Daily , Weekly | |
| Add URGN to Watchlist: View: Get Complete URGN Trend Analysis ➞ | |
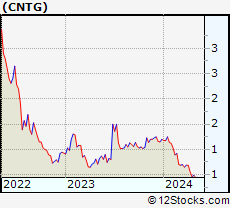 | CNTG Centogene N.V. |
| Sector: Health Care | |
| SubSector: Medical Laboratories & Research | |
| MarketCap: 455.8 Millions | |
| Recent Price: 0.06 Smart Investing & Trading Score: 20 | |
| Day Percent Change: 0% Day Change: -9999 | |
| Week Change: -5.21327% Year-to-date Change: -53.8% | |
| CNTG Links: Profile News Message Board | |
| Charts:- Daily , Weekly | |
| Add CNTG to Watchlist: View: Get Complete CNTG Trend Analysis ➞ | |
 | HALO Halozyme Therapeutics Inc |
| Sector: Health Care | |
| SubSector: Biotechnology | |
| MarketCap: 8764.26 Millions | |
| Recent Price: 71.69 Smart Investing & Trading Score: 30 | |
| Day Percent Change: -4.3368% Day Change: 0.48 | |
| Week Change: -5.2221% Year-to-date Change: 49.3% | |
| HALO Links: Profile News Message Board | |
| Charts:- Daily , Weekly | |
| Add HALO to Watchlist: View: Get Complete HALO Trend Analysis ➞ | |
 | PGNY Progyny Inc |
| Sector: Health Care | |
| SubSector: Healthcare Plans | |
| MarketCap: 1938.9 Millions | |
| Recent Price: 20.55 Smart Investing & Trading Score: 0 | |
| Day Percent Change: -3.1574% Day Change: 0.57 | |
| Week Change: -5.29954% Year-to-date Change: 15.9% | |
| PGNY Links: Profile News Message Board | |
| Charts:- Daily , Weekly | |
| Add PGNY to Watchlist: View: Get Complete PGNY Trend Analysis ➞ | |
 | MDXG Mimedx Group Inc |
| Sector: Health Care | |
| SubSector: Biotechnology | |
| MarketCap: 1056.43 Millions | |
| Recent Price: 6.71 Smart Investing & Trading Score: 0 | |
| Day Percent Change: -1.75695% Day Change: -0.14 | |
| Week Change: -5.35966% Year-to-date Change: -27.7% | |
| MDXG Links: Profile News Message Board | |
| Charts:- Daily , Weekly | |
| Add MDXG to Watchlist: View: Get Complete MDXG Trend Analysis ➞ | |
 | BLTE Belite Bio Inc ADR |
| Sector: Health Care | |
| SubSector: Biotechnology | |
| MarketCap: 2143.12 Millions | |
| Recent Price: 74.06 Smart Investing & Trading Score: 43 | |
| Day Percent Change: 2.81% Day Change: 1.78 | |
| Week Change: -5.48% Year-to-date Change: 3.3% | |
| BLTE Links: Profile News Message Board | |
| Charts:- Daily , Weekly | |
| Add BLTE to Watchlist: View: Get Complete BLTE Trend Analysis ➞ | |
 | EGLT Egalet Corporation |
| Sector: Health Care | |
| SubSector: Biotechnology | |
| MarketCap: 118.55 Millions | |
| Recent Price: 17.16 Smart Investing & Trading Score: 10 | |
| Day Percent Change: -0.980958% Day Change: -9999 | |
| Week Change: -5.61056% Year-to-date Change: 0.0% | |
| EGLT Links: Profile News Message Board | |
| Charts:- Daily , Weekly | |
| Add EGLT to Watchlist: View: Get Complete EGLT Trend Analysis ➞ | |
 | AIRS Airsculpt Technologies Inc |
| Sector: Health Care | |
| SubSector: Medical Care Facilities | |
| MarketCap: 367.13 Millions | |
| Recent Price: 7.95 Smart Investing & Trading Score: 61 | |
| Day Percent Change: -9.24% Day Change: -0.6 | |
| Week Change: -5.61% Year-to-date Change: 13.5% | |
| AIRS Links: Profile News Message Board | |
| Charts:- Daily , Weekly | |
| Add AIRS to Watchlist: View: Get Complete AIRS Trend Analysis ➞ | |
 | PCRX Pacira BioSciences Inc |
| Sector: Health Care | |
| SubSector: Drug Manufacturers - Specialty & Generic | |
| MarketCap: 1188.47 Millions | |
| Recent Price: 24.58 Smart Investing & Trading Score: 20 | |
| Day Percent Change: -2.73051% Day Change: 0.4 | |
| Week Change: -5.64299% Year-to-date Change: 34.1% | |
| PCRX Links: Profile News Message Board | |
| Charts:- Daily , Weekly | |
| Add PCRX to Watchlist: View: Get Complete PCRX Trend Analysis ➞ | |
 | APHA Aphria Inc. |
| Sector: Health Care | |
| SubSector: Drug Manufacturers - Other | |
| MarketCap: 670.533 Millions | |
| Recent Price: 17.23 Smart Investing & Trading Score: 10 | |
| Day Percent Change: -3.39221% Day Change: -9999 | |
| Week Change: -5.64074% Year-to-date Change: 0.0% | |
| APHA Links: Profile News Message Board | |
| Charts:- Daily , Weekly | |
| Add APHA to Watchlist: View: Get Complete APHA Trend Analysis ➞ | |
 | BCRX Biocryst Pharmaceuticals Inc |
| Sector: Health Care | |
| SubSector: Drug Manufacturers - Specialty & Generic | |
| MarketCap: 1736.04 Millions | |
| Recent Price: 7.33 Smart Investing & Trading Score: 0 | |
| Day Percent Change: -0.542741% Day Change: 0 | |
| Week Change: -5.66281% Year-to-date Change: -6.4% | |
| BCRX Links: Profile News Message Board | |
| Charts:- Daily , Weekly | |
| Add BCRX to Watchlist: View: Get Complete BCRX Trend Analysis ➞ | |
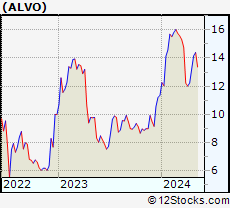 | ALVO Alvotech |
| Sector: Health Care | |
| SubSector: Drug Manufacturers - Specialty & Generic | |
| MarketCap: 2514.04 Millions | |
| Recent Price: 8.20 Smart Investing & Trading Score: 40 | |
| Day Percent Change: 0.1221% Day Change: 0.25 | |
| Week Change: -5.74713% Year-to-date Change: -37.7% | |
| ALVO Links: Profile News Message Board | |
| Charts:- Daily , Weekly | |
| Add ALVO to Watchlist: View: Get Complete ALVO Trend Analysis ➞ | |
 | ALGS Aligos Therapeutics Inc |
| Sector: Health Care | |
| SubSector: Biotechnology | |
| MarketCap: 69.76 Millions | |
| Recent Price: 10.13 Smart Investing & Trading Score: 70 | |
| Day Percent Change: -1.55491% Day Change: 0.99 | |
| Week Change: -5.76744% Year-to-date Change: -74.6% | |
| ALGS Links: Profile News Message Board | |
| Charts:- Daily , Weekly | |
| Add ALGS to Watchlist: View: Get Complete ALGS Trend Analysis ➞ | |
 | CYH Community Health Systems, Inc |
| Sector: Health Care | |
| SubSector: Medical Care Facilities | |
| MarketCap: 409.15 Millions | |
| Recent Price: 3.01 Smart Investing & Trading Score: 60 | |
| Day Percent Change: -3.83387% Day Change: -0.04 | |
| Week Change: -5.9375% Year-to-date Change: -2.0% | |
| CYH Links: Profile News Message Board | |
| Charts:- Daily , Weekly | |
| Add CYH to Watchlist: View: Get Complete CYH Trend Analysis ➞ | |
 | AVRO AVROBIO, Inc. |
| Sector: Health Care | |
| SubSector: Biotechnology | |
| MarketCap: 626.185 Millions | |
| Recent Price: 1.40 Smart Investing & Trading Score: 10 | |
| Day Percent Change: -1.40845% Day Change: -9999 | |
| Week Change: -6.04027% Year-to-date Change: 0.0% | |
| AVRO Links: Profile News Message Board | |
| Charts:- Daily , Weekly | |
| Add AVRO to Watchlist: View: Get Complete AVRO Trend Analysis ➞ | |
 | JYNT Joint Corp |
| Sector: Health Care | |
| SubSector: Medical Care Facilities | |
| MarketCap: 163.25 Millions | |
| Recent Price: 9.30 Smart Investing & Trading Score: 0 | |
| Day Percent Change: 0.323625% Day Change: 0.2 | |
| Week Change: -6.06061% Year-to-date Change: -10.8% | |
| JYNT Links: Profile News Message Board | |
| Charts:- Daily , Weekly | |
| Add JYNT to Watchlist: View: Get Complete JYNT Trend Analysis ➞ | |
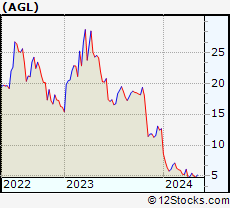 | AGL Agilon Health Inc |
| Sector: Health Care | |
| SubSector: Medical Care Facilities | |
| MarketCap: 497.31 Millions | |
| Recent Price: 1.08 Smart Investing & Trading Score: 60 | |
| Day Percent Change: 8% Day Change: 0.05 | |
| Week Change: -6.08696% Year-to-date Change: -43.8% | |
| AGL Links: Profile News Message Board | |
| Charts:- Daily , Weekly | |
| Add AGL to Watchlist: View: Get Complete AGL Trend Analysis ➞ | |
 | PMVP PMV Pharmaceuticals Inc |
| Sector: Health Care | |
| SubSector: Biotechnology | |
| MarketCap: 77.37 Millions | |
| Recent Price: 1.38 Smart Investing & Trading Score: 20 | |
| Day Percent Change: 1.47059% Day Change: -0.01 | |
| Week Change: -6.12245% Year-to-date Change: -9.8% | |
| PMVP Links: Profile News Message Board | |
| Charts:- Daily , Weekly | |
| Add PMVP to Watchlist: View: Get Complete PMVP Trend Analysis ➞ | |
 | ANIP ANI Pharmaceuticals Inc |
| Sector: Health Care | |
| SubSector: Drug Manufacturers - Specialty & Generic | |
| MarketCap: 2069.06 Millions | |
| Recent Price: 89.08 Smart Investing & Trading Score: 20 | |
| Day Percent Change: -1.21431% Day Change: 0.52 | |
| Week Change: -6.22171% Year-to-date Change: 60.7% | |
| ANIP Links: Profile News Message Board | |
| Charts:- Daily , Weekly | |
| Add ANIP to Watchlist: View: Get Complete ANIP Trend Analysis ➞ | |
| For tabular summary view of above stock list: Summary View ➞ 0 - 25 , 25 - 50 , 50 - 75 , 75 - 100 , 100 - 125 , 125 - 150 , 150 - 175 , 175 - 200 , 200 - 225 , 225 - 250 , 250 - 275 , 275 - 300 , 300 - 325 , 325 - 350 , 350 - 375 , 375 - 400 , 400 - 425 , 425 - 450 , 450 - 475 , 475 - 500 , 500 - 525 , 525 - 550 , 550 - 575 , 575 - 600 , 600 - 625 , 625 - 650 , 650 - 675 , 675 - 700 , 700 - 725 , 725 - 750 , 750 - 775 , 775 - 800 , 800 - 825 , 825 - 850 , 850 - 875 , 875 - 900 , 900 - 925 , 925 - 950 , 950 - 975 , 975 - 1000 | ||
| Click To Change The Sort Order: By Market Cap or Company Size Performance: Year-to-date, Week and Day | |
| Select Chart Type: | ||
|
Best Stocks Today 12Stocks.com |
© 2025 12Stocks.com Terms & Conditions Privacy Contact Us
All Information Provided Only For Education And Not To Be Used For Investing or Trading. See Terms & Conditions


One More Thing ... Get Best Stocks Delivered Daily!
Never Ever Miss A Move With Our Top Ten Stocks Lists
Find Best Stocks In Any Market - Bull or Bear Market
Take A Peek At Our Top Ten Stocks Lists: Daily, Weekly, Year-to-Date & Top Trends
Find Best Stocks In Any Market - Bull or Bear Market
Take A Peek At Our Top Ten Stocks Lists: Daily, Weekly, Year-to-Date & Top Trends
Healthcare Stocks With Best Up Trends [0-bearish to 100-bullish]: Taysha Gene[100], DBV Technologies[100], Valneva SE[100], ClearPoint Neuro[100], Prime Medicine[100], AlloVir [100], Sarepta [100], Monopar [100], Cara [100], Absci Corp[100], Spruce Biosciences[100]
Best Healthcare Stocks Year-to-Date:
Regencell Bioscience[12636.6%], Kaleido BioSciences[9900%], Vor Biopharma[3175%], Nanobiotix ADR[581.379%], Eagle [542.857%], So-Young [395.711%], I-Mab ADR[357.506%], Monopar [337.489%], Nektar [319.84%], 908 Devices[299.543%], DBV Technologies[276.923%] Best Healthcare Stocks This Week:
Athersys [193287%], Nobilis Health[101349%], VBI Vaccines[86898.5%], ContraFect [47677.8%], Clovis Oncology[39610.5%], Endo [28369.6%], NanoString Technologies[17224.7%], Neptune Wellness[14100%], ViewRay [11470.2%], Mallkrodt [11382.1%], Achillion [10033.3%] Best Healthcare Stocks Daily:
Kaleido BioSciences[9900%], Neoleukin [332.665%], Syros [226.23%], Athenex [103.333%], Taysha Gene[53.4591%], DBV Technologies[21.6485%], Valneva SE[20.197%], ClearPoint Neuro[19.7991%], Prime Medicine[19.4097%], Accelerate Diagnostics[17.6471%], Aptose Biosciences[17.5439%]