
 Login Sign Up


| |||||
 |  | ||||

| 12Stocks.com Market Intelligence |
Best Healthcare Stocks
 | "Discover best trending healthcare stocks with 12Stocks.com." |
| - Subu Vdaygiri, Founder, 12Stocks.com |
| In a hurry? Healthcare Stocks Lists: Performance Trends Table, Stock Charts
Sort Healthcare stocks: Daily, Weekly, Year-to-Date, Market Cap & Trends. Filter Healthcare stocks list by size:All Healthcare Large Mid-Range Small |
| 12Stocks.com Healthcare Stocks Performances & Trends Daily | |||||||||
|
|  The overall Smart Investing & Trading Score is 70 (0-bearish to 100-bullish) which puts Healthcare sector in short term neutral to bullish trend. The Smart Investing & Trading Score from previous trading session is 70 and an improvement of trend continues.
| ||||||||
Here are the Smart Investing & Trading Scores of the most requested Healthcare stocks at 12Stocks.com (click stock name for detailed review):
|


| 12Stocks.com: Investing in Healthcare sector with Stocks | |
|
The following table helps investors and traders sort through current performance and trends (as measured by Smart Investing & Trading Score) of various
stocks in the Healthcare sector. Quick View: Move mouse or cursor over stock symbol (ticker) to view short-term Technical chart and over stock name to view long term chart. Click on  to add stock symbol to your watchlist and to add stock symbol to your watchlist and  to view watchlist. Click on any ticker or stock name for detailed market intelligence report for that stock. to view watchlist. Click on any ticker or stock name for detailed market intelligence report for that stock. |
12Stocks.com Performance of Stocks in Healthcare Sector
| Ticker | Stock Name | Watchlist | Category | Recent Price | Smart Investing & Trading Score | Change % | YTD Change% |
| LMAT | LeMaitre Vascular |   | Instruments | 95.15 | 90 | 6.68% | 3.77% |
| LMAT | LeMaitre Vascular | | Instruments | 95.81 | 90 | 6.68% | 3.77% |
| ETNB | 89bio | | Biotechnology | 9.10 | 30 | 3.96% | 16.88% |
| OFIX | Orthofix | | Equipment | 14.10 | 100 | 3.59% | -19.24% |
| OFIX | Orthofix | | Equipment | 14.02 | 100 | 3.59% | -19.24% |
| RLMD | Relmada | | Biotechnology | 0.61 | 60 | 10.24% | 9.27% |
| AIRS | AirSculpt Technologies | | Medical Care Facilities | 6.24 | 61 | 3.70% | 40.66% |
| JANX | Janux | | Biotechnology | 24.97 | 60 | 4.25% | -53.38% |
| EWTX | Edgewise | | Biotechnology | 13.93 | 50 | -1.43% | -48.58% |
| ANIP | ANI | | Biotechnology | 88.74 | 100 | 10.28% | 60.53% |
| ANIP | ANI | | Biotechnology | 90.00 | 100 | 10.28% | 60.53% |
| BTAI | BioXcel | | Biotechnology | 4.75 | 60 | 2.81% | -6.39% |
| CVM | CEL-SCI | | Biotechnology | 8.35 | 60 | -0.88% | -30.42% |
| CVM | CEL-SCI | | Biotechnology | 8.14 | 60 | -0.88% | -30.42% |
| RCEL | Avita | | Equipment | 5.80 | 80 | 4.57% | -55.00% |
| TRDA | Entrada | | Biotechnology | 5.25 | 25 | 1.35% | -69.23% |
| APLM | Apollomics | | Biotechnology | 5.91 | 68 | 10.22% | -40.51% |
| PHVS | Pharvaris N.V | | Biotechnology | 22.99 | 90 | -1.11% | 11.79% |
| RDNT | RadNet | | Laboratories | 68.41 | 100 | 1.79% | -2.05% |
| RDNT | RadNet | | Laboratories | 68.75 | 100 | 1.79% | -2.05% |
| MESO | Mesoblast | | Biotechnology | 15.19 | 70 | 378.83% | -23.28% |
| MESO | Mesoblast | | Biotechnology | 15.86 | 70 | 378.83% | -23.28% |
| PACB | Pacific Biosciences | | Biotechnology | 1.28 | 20 | 9.47% | -30.05% |
| PACB | Pacific Biosciences | | Biotechnology | 1.23 | 20 | 9.47% | -30.05% |
| AURA | Aura Biosciences | | Biotechnology | 7.00 | 46 | 1.74% | -12.04% |
| For chart view version of above stock list: Chart View ➞ 0 - 25 , 25 - 50 , 50 - 75 , 75 - 100 , 100 - 125 , 125 - 150 , 150 - 175 , 175 - 200 , 200 - 225 , 225 - 250 , 250 - 275 , 275 - 300 , 300 - 325 , 325 - 350 , 350 - 375 , 375 - 400 , 400 - 425 , 425 - 450 , 450 - 475 , 475 - 500 , 500 - 525 , 525 - 550 , 550 - 575 , 575 - 600 , 600 - 625 , 625 - 650 | ||
 | Click To Change The Sort Order: By Market Cap or Company Size Performance: Year-to-date, Week and Day |  |
|
Get the most comprehensive stock market coverage daily at 12Stocks.com ➞ Best Stocks Today ➞ Best Stocks Weekly ➞ Best Stocks Year-to-Date ➞ Best Stocks Trends ➞  Best Stocks Today 12Stocks.com Best Nasdaq Stocks ➞ Best S&P 500 Stocks ➞ Best Tech Stocks ➞ Best Biotech Stocks ➞ |
| Detailed Overview of Healthcare Stocks |
| Healthcare Technical Overview, Leaders & Laggards, Top Healthcare ETF Funds & Detailed Healthcare Stocks List, Charts, Trends & More |
| Healthcare Sector: Technical Analysis, Trends & YTD Performance | |
| Healthcare sector is composed of stocks
from pharmaceutical, biotech, diagnostics labs, insurance providers
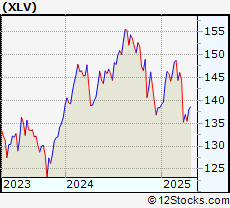
and healthcare services. Healthcare sector, as represented by XLV, an exchange-traded fund [ETF] that holds basket of Healthcare stocks (e.g, Merck, Amgen) is down by -2.27% and is currently underperforming the overall market by -12.6% year-to-date. Below is a quick view of Technical charts and trends: |
|
 XLV Weekly Chart |
|
| Long Term Trend: Good | |
| Medium Term Trend: Not Good | |
 XLV Daily Chart |
|
| Short Term Trend: Very Good | |
| Overall Trend Score: 70 | |
| YTD Performance: -2.27% | |
| **Trend Scores & Views Are Only For Educational Purposes And Not For Investing | |
| 12Stocks.com: Top Performing Healthcare Sector Stocks | |||||||||||||||||||||||||
 The top performing Healthcare sector stocks year to date are Now, more recently, over last week, the top performing Healthcare sector stocks on the move are


|
|||||||||||||||||||||||||
| 12Stocks.com: Investing in Healthcare Sector using Exchange Traded Funds | |
|
The following table shows list of key exchange traded funds (ETF) that
help investors track Healthcare Index. For detailed view, check out our ETF Funds section of our website. Quick View: Move mouse or cursor over ETF symbol (ticker) to view short-term Technical chart and over ETF name to view long term chart. Click on ticker or stock name for detailed view. Click on to add stock symbol to your watchlist and to view watchlist. |
12Stocks.com List of ETFs that track Healthcare Index
| Ticker | ETF Name | Watchlist | Recent Price | Smart Investing & Trading Score | Change % | Week % | Year-to-date % |
| XLV | Health Care | | 133.29 | 70 | 0.63 | 2.13 | -2.27% |
| XLV | Health Care | | 133.96 | 70 | 0.63 | 2.13 | -2.27% |
| XBI | Biotech | | 89.52 | 100 | 27.96 | 3.94 | -0.58% |
| XBI | Biotech | | 89.57 | 100 | 27.96 | 3.94 | -0.58% |
| IBB | Biotechnology | | 137.10 | 100 | 16.19 | 4.27 | 3.79% |
| IBB | Biotechnology | | 137.27 | 100 | 16.19 | 4.27 | 3.79% |
| BBH | Biotech | | 164.79 | 80 | 13.23 | 4.48 | 4.98% |
| BBH | Biotech | | 165.04 | 80 | 13.23 | 4.48 | 4.98% |
| VHT | Health Care | | 247.64 | 70 | 0.9 | 2.5 | -1.66% |
| VHT | Health Care | | 248.61 | 70 | 0.9 | 2.5 | -1.66% |
| IYH | Healthcare | | 56.22 | 70 | -76.82 | 2.44 | -2.98% |
| IYH | Healthcare | | 56.48 | 70 | -76.82 | 2.44 | -2.98% |
| IHF | Healthcare Providers | | 44.10 | 70 | 1.48 | 6.7 | -7.8% |
| IHF | Healthcare Providers | | 44.11 | 70 | 1.48 | 6.7 | -7.8% |
| IHI | Medical Devices | | 61.79 | 80 | 8.95 | 3.36 | 6.05% |
| IHI | Medical Devices | | 61.59 | 80 | 8.95 | 3.36 | 6.05% |
| BIB | Biotechnology | | 54.59 | 100 | 2.26 | 8.69 | 8.43% |
| BIB | Biotechnology | | 54.80 | 100 | 2.26 | 8.69 | 8.43% |
| BIS | Short Biotech | | 14.60 | 0 | -1.9 | -8.1 | -18.59% |
| BIS | Short Biotech | | 14.55 | 0 | -1.9 | -8.1 | -18.59% |
| XHE | Health Care Equipment | | 80.23 | 70 | -1.87 | 5.78 | -8.29% |
| CURE | Healthcare Bull 3X | | 74.15 | 70 | 33.21 | 5.76 | -19.07% |
| CURE | Healthcare Bull 3X | | 75.23 | 70 | 33.21 | 5.76 | -19.07% |
| LABU | Biotech Bull 3X | | 69.12 | 100 | 2753.31 | 11.7 | -22.8% |
| LABU | Biotech Bull 3X | | 69.34 | 100 | 2753.31 | 11.7 | -22.8% |
| LABD | Biotech Bear 3X | | 5.83 | 10 | -4.32 | -11.26 | -18.59% |
| LABD | Biotech Bear 3X | | 5.82 | 10 | -4.32 | -11.26 | -18.59% |
| PSCH | SmallCap Health Care | | 39.84 | 70 | 9.4 | 7.11 | -8.86% |
| XHS | Health Care Services | | 95.12 | 70 | 2.39 | 7.01 | 5.6% |
| PTH | DWA Healthcare Momentum | | 39.22 | 100 | 1.76 | 5.17 | -2.11% |
| RXL | Health Care | | 39.23 | 70 | 25.59 | 3.98 | -10.09% |
| RXL | Health Care | | 39.68 | 70 | 25.59 | 3.98 | -10.09% |
| RXD | Short Health Care | | 12.29 | 20 | -1.14 | -4.17 | 4.29% |
| 12Stocks.com: Charts, Trends, Fundamental Data and Performances of Healthcare Stocks | |
|
We now take in-depth look at all Healthcare stocks including charts, multi-period performances and overall trends (as measured by Smart Investing & Trading Score). One can sort Healthcare stocks (click link to choose) by Daily, Weekly and by Year-to-Date performances. Also, one can sort by size of the company or by market capitalization. |
| Select Your Default Chart Type: | |||||
| |||||
| Click on stock symbol or name for detailed view. Click on to add stock symbol to your watchlist and to view watchlist. Quick View: Move mouse or cursor over "Daily" to quickly view daily Technical stock chart and over "Weekly" to view weekly Technical stock chart. | |||||

 | LMAT LeMaitre Vascular, Inc. |
| Sector: Health Care | |
| SubSector: Medical Instruments & Supplies | |
| MarketCap: 522.16 Millions | |
| Recent Price: 95.15 Smart Investing & Trading Score: 90 | |
| Day Percent Change: 6.68% Day Change: 5.74 | |
| Week Change: 2.06% Year-to-date Change: 3.8% | |
| LMAT Links: Profile News Message Board | |
| Charts:- Daily , Weekly | |
| Add LMAT to Watchlist: View: Get Complete LMAT Trend Analysis ➞ | |
| LMAT LeMaitre Vascular, Inc. |
| Sector: Health Care | |
| SubSector: Medical Instruments & Supplies | |
| MarketCap: 522.16 Millions | |
| Recent Price: 95.81 Smart Investing & Trading Score: 90 | |
| Day Percent Change: 6.68% Day Change: 5.74 | |
| Week Change: 2.06% Year-to-date Change: 3.8% | |
| LMAT Links: Profile News Message Board | |
| Charts:- Daily , Weekly | |
| Add LMAT to Watchlist: View: Get Complete LMAT Trend Analysis ➞ | |
 | ETNB 89bio, Inc. |
| Sector: Health Care | |
| SubSector: Biotechnology | |
| MarketCap: 517.485 Millions | |
| Recent Price: 9.10 Smart Investing & Trading Score: 30 | |
| Day Percent Change: 3.96% Day Change: 0.34 | |
| Week Change: -3.59% Year-to-date Change: 16.9% | |
| ETNB Links: Profile News Message Board | |
| Charts:- Daily , Weekly | |
| Add ETNB to Watchlist: View: Get Complete ETNB Trend Analysis ➞ | |
 | OFIX Orthofix Medical Inc. |
| Sector: Health Care | |
| SubSector: Medical Appliances & Equipment | |
| MarketCap: 508.18 Millions | |
| Recent Price: 14.10 Smart Investing & Trading Score: 100 | |
| Day Percent Change: 3.59% Day Change: 0.6 | |
| Week Change: 12.44% Year-to-date Change: -19.2% | |
| OFIX Links: Profile News Message Board | |
| Charts:- Daily , Weekly | |
| Add OFIX to Watchlist: View: Get Complete OFIX Trend Analysis ➞ | |
| OFIX Orthofix Medical Inc. |
| Sector: Health Care | |
| SubSector: Medical Appliances & Equipment | |
| MarketCap: 508.18 Millions | |
| Recent Price: 14.02 Smart Investing & Trading Score: 100 | |
| Day Percent Change: 3.59% Day Change: 0.6 | |
| Week Change: 12.44% Year-to-date Change: -19.2% | |
| OFIX Links: Profile News Message Board | |
| Charts:- Daily , Weekly | |
| Add OFIX to Watchlist: View: Get Complete OFIX Trend Analysis ➞ | |
 | RLMD Relmada Therapeutics, Inc. |
| Sector: Health Care | |
| SubSector: Biotechnology | |
| MarketCap: 499.685 Millions | |
| Recent Price: 0.61 Smart Investing & Trading Score: 60 | |
| Day Percent Change: 10.24% Day Change: 0.26 | |
| Week Change: -5.14% Year-to-date Change: 9.3% | |
| RLMD Links: Profile News Message Board | |
| Charts:- Daily , Weekly | |
| Add RLMD to Watchlist: View: Get Complete RLMD Trend Analysis ➞ | |
 | AIRS AirSculpt Technologies, Inc. |
| Sector: Health Care | |
| SubSector: Medical Care Facilities | |
| MarketCap: 497 Millions | |
| Recent Price: 6.24 Smart Investing & Trading Score: 61 | |
| Day Percent Change: 3.7% Day Change: 0.16 | |
| Week Change: 18.7% Year-to-date Change: 40.7% | |
| AIRS Links: Profile News Message Board | |
| Charts:- Daily , Weekly | |
| Add AIRS to Watchlist: View: Get Complete AIRS Trend Analysis ➞ | |
 | JANX Janux Therapeutics, Inc. |
| Sector: Health Care | |
| SubSector: Biotechnology | |
| MarketCap: 496 Millions | |
| Recent Price: 24.97 Smart Investing & Trading Score: 60 | |
| Day Percent Change: 4.25% Day Change: 1.87 | |
| Week Change: 3.23% Year-to-date Change: -53.4% | |
| JANX Links: Profile News Message Board | |
| Charts:- Daily , Weekly | |
| Add JANX to Watchlist: View: Get Complete JANX Trend Analysis ➞ | |
 | EWTX Edgewise Therapeutics, Inc. |
| Sector: Health Care | |
| SubSector: Biotechnology | |
| MarketCap: 492 Millions | |
| Recent Price: 13.93 Smart Investing & Trading Score: 50 | |
| Day Percent Change: -1.43% Day Change: -0.28 | |
| Week Change: 1.59% Year-to-date Change: -48.6% | |
| EWTX Links: Profile News Message Board | |
| Charts:- Daily , Weekly | |
| Add EWTX to Watchlist: View: Get Complete EWTX Trend Analysis ➞ | |
 | ANIP ANI Pharmaceuticals, Inc. |
| Sector: Health Care | |
| SubSector: Biotechnology | |
| MarketCap: 489.285 Millions | |
| Recent Price: 88.74 Smart Investing & Trading Score: 100 | |
| Day Percent Change: 10.28% Day Change: 5.75 | |
| Week Change: 28.44% Year-to-date Change: 60.5% | |
| ANIP Links: Profile News Message Board | |
| Charts:- Daily , Weekly | |
| Add ANIP to Watchlist: View: Get Complete ANIP Trend Analysis ➞ | |
| ANIP ANI Pharmaceuticals, Inc. |
| Sector: Health Care | |
| SubSector: Biotechnology | |
| MarketCap: 489.285 Millions | |
| Recent Price: 90.00 Smart Investing & Trading Score: 100 | |
| Day Percent Change: 10.28% Day Change: 5.75 | |
| Week Change: 28.44% Year-to-date Change: 60.5% | |
| ANIP Links: Profile News Message Board | |
| Charts:- Daily , Weekly | |
| Add ANIP to Watchlist: View: Get Complete ANIP Trend Analysis ➞ | |
 | BTAI BioXcel Therapeutics, Inc. |
| Sector: Health Care | |
| SubSector: Biotechnology | |
| MarketCap: 487.485 Millions | |
| Recent Price: 4.75 Smart Investing & Trading Score: 60 | |
| Day Percent Change: 2.81% Day Change: 0.02 | |
| Week Change: 68.67% Year-to-date Change: -6.4% | |
| BTAI Links: Profile News Message Board | |
| Charts:- Daily , Weekly | |
| Add BTAI to Watchlist: View: Get Complete BTAI Trend Analysis ➞ | |
 | CVM CEL-SCI Corporation |
| Sector: Health Care | |
| SubSector: Biotechnology | |
| MarketCap: 483.885 Millions | |
| Recent Price: 8.35 Smart Investing & Trading Score: 60 | |
| Day Percent Change: -0.88% Day Change: -0.01 | |
| Week Change: -8.64% Year-to-date Change: -30.4% | |
| CVM Links: Profile News Message Board | |
| Charts:- Daily , Weekly | |
| Add CVM to Watchlist: View: Get Complete CVM Trend Analysis ➞ | |
| CVM CEL-SCI Corporation |
| Sector: Health Care | |
| SubSector: Biotechnology | |
| MarketCap: 483.885 Millions | |
| Recent Price: 8.14 Smart Investing & Trading Score: 60 | |
| Day Percent Change: -0.88% Day Change: -0.01 | |
| Week Change: -8.64% Year-to-date Change: -30.4% | |
| CVM Links: Profile News Message Board | |
| Charts:- Daily , Weekly | |
| Add CVM to Watchlist: View: Get Complete CVM Trend Analysis ➞ | |
 | RCEL Avita Medical Limited |
| Sector: Health Care | |
| SubSector: Medical Appliances & Equipment | |
| MarketCap: 481.18 Millions | |
| Recent Price: 5.80 Smart Investing & Trading Score: 80 | |
| Day Percent Change: 4.57% Day Change: 0.4 | |
| Week Change: 7.46% Year-to-date Change: -55.0% | |
| RCEL Links: Profile News Message Board | |
| Charts:- Daily , Weekly | |
| Add RCEL to Watchlist: View: Get Complete RCEL Trend Analysis ➞ | |
 | TRDA Entrada Therapeutics, Inc. |
| Sector: Health Care | |
| SubSector: Biotechnology | |
| MarketCap: 481 Millions | |
| Recent Price: 5.25 Smart Investing & Trading Score: 25 | |
| Day Percent Change: 1.35% Day Change: 0.22 | |
| Week Change: -10.59% Year-to-date Change: -69.2% | |
| TRDA Links: Profile News Message Board | |
| Charts:- Daily , Weekly | |
| Add TRDA to Watchlist: View: Get Complete TRDA Trend Analysis ➞ | |
 | APLM Apollomics, Inc. |
| Sector: Health Care | |
| SubSector: Biotechnology | |
| MarketCap: 481 Millions | |
| Recent Price: 5.91 Smart Investing & Trading Score: 68 | |
| Day Percent Change: 10.22% Day Change: 0.01 | |
| Week Change: 4.13% Year-to-date Change: -40.5% | |
| APLM Links: Profile News Message Board | |
| Charts:- Daily , Weekly | |
| Add APLM to Watchlist: View: Get Complete APLM Trend Analysis ➞ | |
 | PHVS Pharvaris N.V. |
| Sector: Health Care | |
| SubSector: Biotechnology | |
| MarketCap: 475 Millions | |
| Recent Price: 22.99 Smart Investing & Trading Score: 90 | |
| Day Percent Change: -1.11% Day Change: -0.2 | |
| Week Change: 0.94% Year-to-date Change: 11.8% | |
| PHVS Links: Profile News Message Board | |
| Charts:- Daily , Weekly | |
| Add PHVS to Watchlist: View: Get Complete PHVS Trend Analysis ➞ | |
 | RDNT RadNet, Inc. |
| Sector: Health Care | |
| SubSector: Medical Laboratories & Research | |
| MarketCap: 473.2 Millions | |
| Recent Price: 68.41 Smart Investing & Trading Score: 100 | |
| Day Percent Change: 1.79% Day Change: 1.14 | |
| Week Change: 29.17% Year-to-date Change: -2.1% | |
| RDNT Links: Profile News Message Board | |
| Charts:- Daily , Weekly | |
| Add RDNT to Watchlist: View: Get Complete RDNT Trend Analysis ➞ | |
| RDNT RadNet, Inc. |
| Sector: Health Care | |
| SubSector: Medical Laboratories & Research | |
| MarketCap: 473.2 Millions | |
| Recent Price: 68.75 Smart Investing & Trading Score: 100 | |
| Day Percent Change: 1.79% Day Change: 1.14 | |
| Week Change: 29.17% Year-to-date Change: -2.1% | |
| RDNT Links: Profile News Message Board | |
| Charts:- Daily , Weekly | |
| Add RDNT to Watchlist: View: Get Complete RDNT Trend Analysis ➞ | |
 | MESO Mesoblast Limited |
| Sector: Health Care | |
| SubSector: Biotechnology | |
| MarketCap: 471.385 Millions | |
| Recent Price: 15.19 Smart Investing & Trading Score: 70 | |
| Day Percent Change: 378.83% Day Change: 5.19 | |
| Week Change: -3% Year-to-date Change: -23.3% | |
| MESO Links: Profile News Message Board | |
| Charts:- Daily , Weekly | |
| Add MESO to Watchlist: View: Get Complete MESO Trend Analysis ➞ | |
| MESO Mesoblast Limited |
| Sector: Health Care | |
| SubSector: Biotechnology | |
| MarketCap: 471.385 Millions | |
| Recent Price: 15.86 Smart Investing & Trading Score: 70 | |
| Day Percent Change: 378.83% Day Change: 5.19 | |
| Week Change: -3% Year-to-date Change: -23.3% | |
| MESO Links: Profile News Message Board | |
| Charts:- Daily , Weekly | |
| Add MESO to Watchlist: View: Get Complete MESO Trend Analysis ➞ | |
 | PACB Pacific Biosciences of California, Inc. |
| Sector: Health Care | |
| SubSector: Biotechnology | |
| MarketCap: 470.685 Millions | |
| Recent Price: 1.28 Smart Investing & Trading Score: 20 | |
| Day Percent Change: 9.47% Day Change: 0.14 | |
| Week Change: -7.25% Year-to-date Change: -30.1% | |
| PACB Links: Profile News Message Board | |
| Charts:- Daily , Weekly | |
| Add PACB to Watchlist: View: Get Complete PACB Trend Analysis ➞ | |
| PACB Pacific Biosciences of California, Inc. |
| Sector: Health Care | |
| SubSector: Biotechnology | |
| MarketCap: 470.685 Millions | |
| Recent Price: 1.23 Smart Investing & Trading Score: 20 | |
| Day Percent Change: 9.47% Day Change: 0.14 | |
| Week Change: -7.25% Year-to-date Change: -30.1% | |
| PACB Links: Profile News Message Board | |
| Charts:- Daily , Weekly | |
| Add PACB to Watchlist: View: Get Complete PACB Trend Analysis ➞ | |
 | AURA Aura Biosciences, Inc. |
| Sector: Health Care | |
| SubSector: Biotechnology | |
| MarketCap: 469 Millions | |
| Recent Price: 7.00 Smart Investing & Trading Score: 46 | |
| Day Percent Change: 1.74% Day Change: 0.13 | |
| Week Change: 5.7% Year-to-date Change: -12.0% | |
| AURA Links: Profile News Message Board | |
| Charts:- Daily , Weekly | |
| Add AURA to Watchlist: View: Get Complete AURA Trend Analysis ➞ | |
| For tabular summary view of above stock list: Summary View ➞ 0 - 25 , 25 - 50 , 50 - 75 , 75 - 100 , 100 - 125 , 125 - 150 , 150 - 175 , 175 - 200 , 200 - 225 , 225 - 250 , 250 - 275 , 275 - 300 , 300 - 325 , 325 - 350 , 350 - 375 , 375 - 400 , 400 - 425 , 425 - 450 , 450 - 475 , 475 - 500 , 500 - 525 , 525 - 550 , 550 - 575 , 575 - 600 , 600 - 625 , 625 - 650 | ||
| Click To Change The Sort Order: By Market Cap or Company Size Performance: Year-to-date, Week and Day | |
| Select Chart Type: | ||
|
Best Stocks Today 12Stocks.com |
© 2025 12Stocks.com Terms & Conditions Privacy Contact Us
All Information Provided Only For Education And Not To Be Used For Investing or Trading. See Terms & Conditions


One More Thing ... Get Best Stocks Delivered Daily!
Never Ever Miss A Move With Our Top Ten Stocks Lists
Find Best Stocks In Any Market - Bull or Bear Market
Take A Peek At Our Top Ten Stocks Lists: Daily, Weekly, Year-to-Date & Top Trends
Find Best Stocks In Any Market - Bull or Bear Market
Take A Peek At Our Top Ten Stocks Lists: Daily, Weekly, Year-to-Date & Top Trends
Healthcare Stocks With Best Up Trends [0-bearish to 100-bullish]: Amneal [100], XOMA [100], XOMA [100], Novavax [100], Novavax [100], Ensign [100], Ensign [100], Halozyme [100], Halozyme [100], Xenon [100], Xenon [100]
Best Healthcare Stocks Year-to-Date:
Evofem Biosciences[101000000%], Translate Bio[2499650%], Eagle [1999700%], Avenue [499850%], Brainstorm Cell[440385%], Sinovac Biotech[154444%], LogicBio [142133%], Petros [101438%], Regencell Bioscience[10223.1%], Regencell Bioscience[10223.1%], I Mab[398.82%] Best Healthcare Stocks This Week:
Evofem Biosciences[111100000%], Translate Bio[45449900%], Petros [34479200%], Avenue [3208820%], Brainstorm Cell[1639080%], Eagle [313348%], Sinovac Biotech[154444%], LogicBio [133220%], Tilray [102.53%], X4 [85.44%], Aveanna [83.8%] Best Healthcare Stocks Daily:
vTv [2351.05%], vTv [2351.05%], RedHill Biopharma[913.48%], RedHill Biopharma[913.48%], Corbus [827.02%], Corbus [827.02%], Summit [647.43%], Summit [647.43%], Concord [417.91%], Concord [417.91%], Mesoblast [378.83%]