
 Login Sign Up


| |||||
 |  | ||||

| 12Stocks.com Market Intelligence |
Best Healthcare Stocks
 | "Discover best trending healthcare stocks with 12Stocks.com." |
| - Subu Vdaygiri, Founder, 12Stocks.com |
| In a hurry? Healthcare Stocks Lists: Performance Trends Table, Stock Charts
Sort Healthcare stocks: Daily, Weekly, Year-to-Date, Market Cap & Trends. Filter Healthcare stocks list by size:All Healthcare Large Mid-Range Small |
| 12Stocks.com Healthcare Stocks Performances & Trends Daily | |||||||||
|
|  The overall Smart Investing & Trading Score is 100 (0-bearish to 100-bullish) which puts Healthcare sector in short term bullish trend. The Smart Investing & Trading Score from previous trading session is 70 and an improvement of trend continues.
| ||||||||
Here are the Smart Investing & Trading Scores of the most requested Healthcare stocks at 12Stocks.com (click stock name for detailed review):
|


| 12Stocks.com: Investing in Healthcare sector with Stocks | |
|
The following table helps investors and traders sort through current performance and trends (as measured by Smart Investing & Trading Score) of various
stocks in the Healthcare sector. Quick View: Move mouse or cursor over stock symbol (ticker) to view short-term Technical chart and over stock name to view long term chart. Click on  to add stock symbol to your watchlist and to add stock symbol to your watchlist and  to view watchlist. Click on any ticker or stock name for detailed market intelligence report for that stock. to view watchlist. Click on any ticker or stock name for detailed market intelligence report for that stock. |
12Stocks.com Performance of Stocks in Healthcare Sector
| Ticker | Stock Name | Watchlist | Category | Recent Price | Smart Investing & Trading Score | Change % | YTD Change% |
| CI | Cigna |   | Healthcare Plans | 296.98 | 80 | 1.83% | 9.25% |
| AXGN | Axogen | | Medical Devices | 17.88 | 90 | 0.06% | 9.02% |
| IMNM | Immunome | | Biotechnology | 11.48 | 90 | 1.23% | 9.02% |
| BYSI | BeyondSpring | | Biotechnology | 1.73 | 0 | -3.35% | 8.81% |
| ALKS | Alkermes | | Drug Manufacturers - Specialty & Generic | 31.27 | 100 | 2.01% | 8.75% |
| SNY | Sanofi ADR | | Drug Manufacturers - General | 50.15 | 90 | 0.78% | 8.68% |
| VTGN | Vistagen | | Biotechnology | 3.60 | 70 | 1.41% | 8.43% |
| IDYA | Ideaya Biosciences | | Biotechnology | 27.20 | 80 | -0.58% | 8.11% |
| YMAB | Y-Mabs | | Biotechnology | 8.61 | 90 | 0.23% | 8.03% |
| CRBP | Corbus | | Biotechnology | 13.00 | 90 | -0.31% | 7.97% |
| PSNL | Personalis | | Diagnostics & Research | 6.77 | 90 | -2.03% | 7.97% |
| BSX | Boston Scientific | | Medical Devices | 96.22 | 10 | 0.39% | 7.65% |
| NVST | Envista | | Instruments | 20.57 | 50 | 1.03% | 7.64% |
| CTSO | Cytosorbents Corp | | Medical Devices | 0.99 | 80 | 6.10% | 7.60% |
| ASRT | Assertio | | Drug Manufacturers - Specialty & Generic | 0.91 | 80 | 0.75% | 7.49% |
| QGEN | Qiagen NV | | Diagnostics & Research | 46.24 | 70 | -0.17% | 7.40% |
| FONR | Fonar Corp | | Diagnostics & Research | 16.21 | 100 | -0.55% | 7.35% |
| GLUE | Monte Rosa | | Biotechnology | 7.63 | 90 | 1.73% | 7.31% |
| VNDA | Vanda | | Biotechnology | 5.17 | 100 | 1.37% | 7.26% |
| PFE | Pfizer | | Drug Manufacturers - General | 27.08 | 100 | -0.48% | 7.24% |
| CGEN | Compugen | | Biotechnology | 1.76 | 100 | 10.31% | 6.97% |
| LOGC | LogicBio | | Biotechnology | 7.41 | 30 | -0.54% | 6.93% |
| PLSE | Pulse Biosciences | | Instruments | 18.99 | 100 | 4.80% | 6.75% |
| HCM | HUTCHMED (China) | | Drug Manufacturers - Specialty & Generic | 16.09 | 50 | 0.80% | 6.68% |
| MTD | Mettler-Toledo | | Diagnostics & Research | 1300.54 | 100 | 0.83% | 6.53% |
| For chart view version of above stock list: Chart View ➞ 0 - 25 , 25 - 50 , 50 - 75 , 75 - 100 , 100 - 125 , 125 - 150 , 150 - 175 , 175 - 200 , 200 - 225 , 225 - 250 , 250 - 275 , 275 - 300 , 300 - 325 , 325 - 350 , 350 - 375 , 375 - 400 , 400 - 425 , 425 - 450 , 450 - 475 , 475 - 500 , 500 - 525 , 525 - 550 , 550 - 575 , 575 - 600 , 600 - 625 , 625 - 650 , 650 - 675 , 675 - 700 , 700 - 725 , 725 - 750 , 750 - 775 , 775 - 800 , 800 - 825 , 825 - 850 , 850 - 875 , 875 - 900 , 900 - 925 , 925 - 950 , 950 - 975 , 975 - 1000 | ||
 | Click To Change The Sort Order: By Market Cap or Company Size Performance: Year-to-date, Week and Day |  |
|
Get the most comprehensive stock market coverage daily at 12Stocks.com ➞ Best Stocks Today ➞ Best Stocks Weekly ➞ Best Stocks Year-to-Date ➞ Best Stocks Trends ➞  Best Stocks Today 12Stocks.com Best Nasdaq Stocks ➞ Best S&P 500 Stocks ➞ Best Tech Stocks ➞ Best Biotech Stocks ➞ |
| Detailed Overview of Healthcare Stocks |
| Healthcare Technical Overview, Leaders & Laggards, Top Healthcare ETF Funds & Detailed Healthcare Stocks List, Charts, Trends & More |
| Healthcare Sector: Technical Analysis, Trends & YTD Performance | |
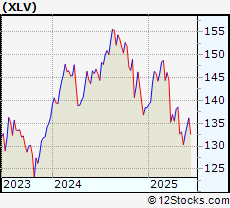
| Healthcare sector is composed of stocks
from pharmaceutical, biotech, diagnostics labs, insurance providers
and healthcare services. Healthcare sector, as represented by XLV, an exchange-traded fund [ETF] that holds basket of Healthcare stocks (e.g, Merck, Amgen) is up by 4.95646% and is currently underperforming the overall market by -9.80144% year-to-date. Below is a quick view of Technical charts and trends: |
|
 XLV Weekly Chart |
|
| Long Term Trend: Very Good | |
| Medium Term Trend: Very Good | |
 XLV Daily Chart |
|
| Short Term Trend: Very Good | |
| Overall Trend Score: 100 | |
| YTD Performance: 4.95646% | |
| **Trend Scores & Views Are Only For Educational Purposes And Not For Investing | |
| 12Stocks.com: Top Performing Healthcare Sector Stocks | ||||||||||||||||||||||||||||||||||||||||||||||
 The top performing Healthcare sector stocks year to date are
Now, more recently, over last week, the top performing Healthcare sector stocks on the move are


|
||||||||||||||||||||||||||||||||||||||||||||||
| 12Stocks.com: Investing in Healthcare Sector using Exchange Traded Funds | |
|
The following table shows list of key exchange traded funds (ETF) that
help investors track Healthcare Index. For detailed view, check out our ETF Funds section of our website. Quick View: Move mouse or cursor over ETF symbol (ticker) to view short-term Technical chart and over ETF name to view long term chart. Click on ticker or stock name for detailed view. Click on to add stock symbol to your watchlist and to view watchlist. |
12Stocks.com List of ETFs that track Healthcare Index
| Ticker | ETF Name | Watchlist | Recent Price | Smart Investing & Trading Score | Change % | Week % | Year-to-date % |
| BTEC | Principal Healthcare Innovators | | 39.49 | 30 | 0 | 1.02328 | 0% |
| 12Stocks.com: Charts, Trends, Fundamental Data and Performances of Healthcare Stocks | |
|
We now take in-depth look at all Healthcare stocks including charts, multi-period performances and overall trends (as measured by Smart Investing & Trading Score). One can sort Healthcare stocks (click link to choose) by Daily, Weekly and by Year-to-Date performances. Also, one can sort by size of the company or by market capitalization. |
| Select Your Default Chart Type: | |||||
| |||||
| Click on stock symbol or name for detailed view. Click on to add stock symbol to your watchlist and to view watchlist. Quick View: Move mouse or cursor over "Daily" to quickly view daily Technical stock chart and over "Weekly" to view weekly Technical stock chart. | |||||

 | CI Cigna Group |
| Sector: Health Care | |
| SubSector: Healthcare Plans | |
| MarketCap: 81495.8 Millions | |
| Recent Price: 296.98 Smart Investing & Trading Score: 80 | |
| Day Percent Change: 1.82753% Day Change: 4.21 | |
| Week Change: 1.9044% Year-to-date Change: 9.2% | |
| CI Links: Profile News Message Board | |
| Charts:- Daily , Weekly | |
| Add CI to Watchlist: View: Get Complete CI Trend Analysis ➞ | |
 | AXGN Axogen Inc |
| Sector: Health Care | |
| SubSector: Medical Devices | |
| MarketCap: 735.28 Millions | |
| Recent Price: 17.88 Smart Investing & Trading Score: 90 | |
| Day Percent Change: 0.0559597% Day Change: 0.28 | |
| Week Change: 2.81771% Year-to-date Change: 9.0% | |
| AXGN Links: Profile News Message Board | |
| Charts:- Daily , Weekly | |
| Add AXGN to Watchlist: View: Get Complete AXGN Trend Analysis ➞ | |
 | IMNM Immunome Inc |
| Sector: Health Care | |
| SubSector: Biotechnology | |
| MarketCap: 915.71 Millions | |
| Recent Price: 11.48 Smart Investing & Trading Score: 90 | |
| Day Percent Change: 1.23457% Day Change: 0.38 | |
| Week Change: 2.5% Year-to-date Change: 9.0% | |
| IMNM Links: Profile News Message Board | |
| Charts:- Daily , Weekly | |
| Add IMNM to Watchlist: View: Get Complete IMNM Trend Analysis ➞ | |
 | BYSI BeyondSpring Inc |
| Sector: Health Care | |
| SubSector: Biotechnology | |
| MarketCap: 75.02 Millions | |
| Recent Price: 1.73 Smart Investing & Trading Score: 0 | |
| Day Percent Change: -3.35196% Day Change: 0.04 | |
| Week Change: 2.36686% Year-to-date Change: 8.8% | |
| BYSI Links: Profile News Message Board | |
| Charts:- Daily , Weekly | |
| Add BYSI to Watchlist: View: Get Complete BYSI Trend Analysis ➞ | |
 | ALKS Alkermes plc |
| Sector: Health Care | |
| SubSector: Drug Manufacturers - Specialty & Generic | |
| MarketCap: 4942.44 Millions | |
| Recent Price: 31.27 Smart Investing & Trading Score: 100 | |
| Day Percent Change: 2.00653% Day Change: 0.29 | |
| Week Change: 12.4236% Year-to-date Change: 8.7% | |
| ALKS Links: Profile News Message Board | |
| Charts:- Daily , Weekly | |
| Add ALKS to Watchlist: View: Get Complete ALKS Trend Analysis ➞ | |
 | SNY Sanofi ADR |
| Sector: Health Care | |
| SubSector: Drug Manufacturers - General | |
| MarketCap: 113163 Millions | |
| Recent Price: 50.15 Smart Investing & Trading Score: 90 | |
| Day Percent Change: 0.783762% Day Change: 0.05 | |
| Week Change: 8.0819% Year-to-date Change: 8.7% | |
| SNY Links: Profile News Message Board | |
| Charts:- Daily , Weekly | |
| Add SNY to Watchlist: View: Get Complete SNY Trend Analysis ➞ | |
 | VTGN Vistagen Therapeutics Inc |
| Sector: Health Care | |
| SubSector: Biotechnology | |
| MarketCap: 108.92 Millions | |
| Recent Price: 3.60 Smart Investing & Trading Score: 70 | |
| Day Percent Change: 1.40845% Day Change: -0.04 | |
| Week Change: 3.7464% Year-to-date Change: 8.4% | |
| VTGN Links: Profile News Message Board | |
| Charts:- Daily , Weekly | |
| Add VTGN to Watchlist: View: Get Complete VTGN Trend Analysis ➞ | |
 | IDYA Ideaya Biosciences Inc |
| Sector: Health Care | |
| SubSector: Biotechnology | |
| MarketCap: 2380.4 Millions | |
| Recent Price: 27.20 Smart Investing & Trading Score: 80 | |
| Day Percent Change: -0.584795% Day Change: 0.31 | |
| Week Change: 5.96026% Year-to-date Change: 8.1% | |
| IDYA Links: Profile News Message Board | |
| Charts:- Daily , Weekly | |
| Add IDYA to Watchlist: View: Get Complete IDYA Trend Analysis ➞ | |
 | YMAB Y-Mabs Therapeutics Inc |
| Sector: Health Care | |
| SubSector: Biotechnology | |
| MarketCap: 389.86 Millions | |
| Recent Price: 8.61 Smart Investing & Trading Score: 90 | |
| Day Percent Change: 0.232829% Day Change: 0.01 | |
| Week Change: 0.34965% Year-to-date Change: 8.0% | |
| YMAB Links: Profile News Message Board | |
| Charts:- Daily , Weekly | |
| Add YMAB to Watchlist: View: Get Complete YMAB Trend Analysis ➞ | |
 | CRBP Corbus Pharmaceuticals Holdings Inc |
| Sector: Health Care | |
| SubSector: Biotechnology | |
| MarketCap: 120.84 Millions | |
| Recent Price: 13.00 Smart Investing & Trading Score: 90 | |
| Day Percent Change: -0.306748% Day Change: 0.48 | |
| Week Change: 12.8472% Year-to-date Change: 8.0% | |
| CRBP Links: Profile News Message Board | |
| Charts:- Daily , Weekly | |
| Add CRBP to Watchlist: View: Get Complete CRBP Trend Analysis ➞ | |
 | PSNL Personalis Inc |
| Sector: Health Care | |
| SubSector: Diagnostics & Research | |
| MarketCap: 464.67 Millions | |
| Recent Price: 6.77 Smart Investing & Trading Score: 90 | |
| Day Percent Change: -2.02605% Day Change: 0.02 | |
| Week Change: 10.802% Year-to-date Change: 8.0% | |
| PSNL Links: Profile News Message Board | |
| Charts:- Daily , Weekly | |
| Add PSNL to Watchlist: View: Get Complete PSNL Trend Analysis ➞ | |
 | BSX Boston Scientific Corp |
| Sector: Health Care | |
| SubSector: Medical Devices | |
| MarketCap: 158873 Millions | |
| Recent Price: 96.22 Smart Investing & Trading Score: 10 | |
| Day Percent Change: 0.38602% Day Change: 0.93 | |
| Week Change: -1.8764% Year-to-date Change: 7.7% | |
| BSX Links: Profile News Message Board | |
| Charts:- Daily , Weekly | |
| Add BSX to Watchlist: View: Get Complete BSX Trend Analysis ➞ | |
 | NVST Envista Holdings Corp |
| Sector: Health Care | |
| SubSector: Medical Instruments & Supplies | |
| MarketCap: 3541.33 Millions | |
| Recent Price: 20.57 Smart Investing & Trading Score: 50 | |
| Day Percent Change: 1.03143% Day Change: 0.21 | |
| Week Change: 0.0973236% Year-to-date Change: 7.6% | |
| NVST Links: Profile News Message Board | |
| Charts:- Daily , Weekly | |
| Add NVST to Watchlist: View: Get Complete NVST Trend Analysis ➞ | |
 | CTSO Cytosorbents Corp |
| Sector: Health Care | |
| SubSector: Medical Devices | |
| MarketCap: 60.6 Millions | |
| Recent Price: 0.99 Smart Investing & Trading Score: 80 | |
| Day Percent Change: 6.09861% Day Change: -0.05 | |
| Week Change: 3.87198% Year-to-date Change: 7.6% | |
| CTSO Links: Profile News Message Board | |
| Charts:- Daily , Weekly | |
| Add CTSO to Watchlist: View: Get Complete CTSO Trend Analysis ➞ | |
 | ASRT Assertio Holdings Inc |
| Sector: Health Care | |
| SubSector: Drug Manufacturers - Specialty & Generic | |
| MarketCap: 76.78 Millions | |
| Recent Price: 0.91 Smart Investing & Trading Score: 80 | |
| Day Percent Change: 0.749724% Day Change: -0.01 | |
| Week Change: -4.20379% Year-to-date Change: 7.5% | |
| ASRT Links: Profile News Message Board | |
| Charts:- Daily , Weekly | |
| Add ASRT to Watchlist: View: Get Complete ASRT Trend Analysis ➞ | |
 | QGEN Qiagen NV |
| Sector: Health Care | |
| SubSector: Diagnostics & Research | |
| MarketCap: 10297.2 Millions | |
| Recent Price: 46.24 Smart Investing & Trading Score: 70 | |
| Day Percent Change: -0.172712% Day Change: -0.11 | |
| Week Change: 2.59596% Year-to-date Change: 7.4% | |
| QGEN Links: Profile News Message Board | |
| Charts:- Daily , Weekly | |
| Add QGEN to Watchlist: View: Get Complete QGEN Trend Analysis ➞ | |
 | FONR Fonar Corp |
| Sector: Health Care | |
| SubSector: Diagnostics & Research | |
| MarketCap: 98.44 Millions | |
| Recent Price: 16.21 Smart Investing & Trading Score: 100 | |
| Day Percent Change: -0.552147% Day Change: 0.09 | |
| Week Change: 6.36483% Year-to-date Change: 7.4% | |
| FONR Links: Profile News Message Board | |
| Charts:- Daily , Weekly | |
| Add FONR to Watchlist: View: Get Complete FONR Trend Analysis ➞ | |
 | GLUE Monte Rosa Therapeutics Inc |
| Sector: Health Care | |
| SubSector: Biotechnology | |
| MarketCap: 305.09 Millions | |
| Recent Price: 7.63 Smart Investing & Trading Score: 90 | |
| Day Percent Change: 1.73333% Day Change: 0.07 | |
| Week Change: 15.2568% Year-to-date Change: 7.3% | |
| GLUE Links: Profile News Message Board | |
| Charts:- Daily , Weekly | |
| Add GLUE to Watchlist: View: Get Complete GLUE Trend Analysis ➞ | |
 | VNDA Vanda Pharmaceuticals Inc |
| Sector: Health Care | |
| SubSector: Biotechnology | |
| MarketCap: 272.4 Millions | |
| Recent Price: 5.17 Smart Investing & Trading Score: 100 | |
| Day Percent Change: 1.37255% Day Change: -0.09 | |
| Week Change: 5.5102% Year-to-date Change: 7.3% | |
| VNDA Links: Profile News Message Board | |
| Charts:- Daily , Weekly | |
| Add VNDA to Watchlist: View: Get Complete VNDA Trend Analysis ➞ | |
 | PFE Pfizer Inc |
| Sector: Health Care | |
| SubSector: Drug Manufacturers - General | |
| MarketCap: 141456 Millions | |
| Recent Price: 27.08 Smart Investing & Trading Score: 100 | |
| Day Percent Change: -0.477766% Day Change: -0.18 | |
| Week Change: 12.4118% Year-to-date Change: 7.2% | |
| PFE Links: Profile News Message Board | |
| Charts:- Daily , Weekly | |
| Add PFE to Watchlist: View: Get Complete PFE Trend Analysis ➞ | |
 | CGEN Compugen Ltd |
| Sector: Health Care | |
| SubSector: Biotechnology | |
| MarketCap: 133.76 Millions | |
| Recent Price: 1.76 Smart Investing & Trading Score: 100 | |
| Day Percent Change: 10.3125% Day Change: -0.01 | |
| Week Change: 26.0714% Year-to-date Change: 7.0% | |
| CGEN Links: Profile News Message Board | |
| Charts:- Daily , Weekly | |
| Add CGEN to Watchlist: View: Get Complete CGEN Trend Analysis ➞ | |
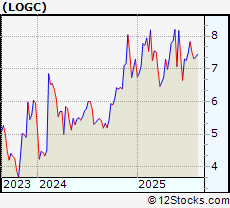 | LOGC LogicBio Therapeutics, Inc. |
| Sector: Health Care | |
| SubSector: Biotechnology | |
| MarketCap: 203.485 Millions | |
| Recent Price: 7.41 Smart Investing & Trading Score: 30 | |
| Day Percent Change: -0.536913% Day Change: -9999 | |
| Week Change: 0.135135% Year-to-date Change: 6.9% | |
| LOGC Links: Profile News Message Board | |
| Charts:- Daily , Weekly | |
| Add LOGC to Watchlist: View: Get Complete LOGC Trend Analysis ➞ | |
 | PLSE Pulse Biosciences Inc |
| Sector: Health Care | |
| SubSector: Medical Instruments & Supplies | |
| MarketCap: 1016.58 Millions | |
| Recent Price: 18.99 Smart Investing & Trading Score: 100 | |
| Day Percent Change: 4.80132% Day Change: 0.05 | |
| Week Change: 7.47029% Year-to-date Change: 6.7% | |
| PLSE Links: Profile News Message Board | |
| Charts:- Daily , Weekly | |
| Add PLSE to Watchlist: View: Get Complete PLSE Trend Analysis ➞ | |
 | HCM HUTCHMED (China) Limited ADR |
| Sector: Health Care | |
| SubSector: Drug Manufacturers - Specialty & Generic | |
| MarketCap: 2785.49 Millions | |
| Recent Price: 16.09 Smart Investing & Trading Score: 50 | |
| Day Percent Change: 0.802005% Day Change: 0.23 | |
| Week Change: 1.30982% Year-to-date Change: 6.7% | |
| HCM Links: Profile News Message Board | |
| Charts:- Daily , Weekly | |
| Add HCM to Watchlist: View: Get Complete HCM Trend Analysis ➞ | |
 | MTD Mettler-Toledo International, Inc |
| Sector: Health Care | |
| SubSector: Diagnostics & Research | |
| MarketCap: 26896.4 Millions | |
| Recent Price: 1300.54 Smart Investing & Trading Score: 100 | |
| Day Percent Change: 0.831124% Day Change: 3.62 | |
| Week Change: 4.68976% Year-to-date Change: 6.5% | |
| MTD Links: Profile News Message Board | |
| Charts:- Daily , Weekly | |
| Add MTD to Watchlist: View: Get Complete MTD Trend Analysis ➞ | |
| For tabular summary view of above stock list: Summary View ➞ 0 - 25 , 25 - 50 , 50 - 75 , 75 - 100 , 100 - 125 , 125 - 150 , 150 - 175 , 175 - 200 , 200 - 225 , 225 - 250 , 250 - 275 , 275 - 300 , 300 - 325 , 325 - 350 , 350 - 375 , 375 - 400 , 400 - 425 , 425 - 450 , 450 - 475 , 475 - 500 , 500 - 525 , 525 - 550 , 550 - 575 , 575 - 600 , 600 - 625 , 625 - 650 , 650 - 675 , 675 - 700 , 700 - 725 , 725 - 750 , 750 - 775 , 775 - 800 , 800 - 825 , 825 - 850 , 850 - 875 , 875 - 900 , 900 - 925 , 925 - 950 , 950 - 975 , 975 - 1000 | ||
| Click To Change The Sort Order: By Market Cap or Company Size Performance: Year-to-date, Week and Day | |
| Select Chart Type: | ||
|
Best Stocks Today 12Stocks.com |
© 2025 12Stocks.com Terms & Conditions Privacy Contact Us
All Information Provided Only For Education And Not To Be Used For Investing or Trading. See Terms & Conditions


One More Thing ... Get Best Stocks Delivered Daily!
Never Ever Miss A Move With Our Top Ten Stocks Lists
Find Best Stocks In Any Market - Bull or Bear Market
Take A Peek At Our Top Ten Stocks Lists: Daily, Weekly, Year-to-Date & Top Trends
Find Best Stocks In Any Market - Bull or Bear Market
Take A Peek At Our Top Ten Stocks Lists: Daily, Weekly, Year-to-Date & Top Trends
Healthcare Stocks With Best Up Trends [0-bearish to 100-bullish]: Taysha Gene[100], DBV Technologies[100], Valneva SE[100], ClearPoint Neuro[100], Prime Medicine[100], AlloVir [100], Sarepta [100], Monopar [100], Cara [100], Absci Corp[100], Spruce Biosciences[100]
Best Healthcare Stocks Year-to-Date:
Regencell Bioscience[12636.6%], Kaleido BioSciences[9900%], Vor Biopharma[3175%], Nanobiotix ADR[581.379%], Eagle [542.857%], So-Young [395.711%], I-Mab ADR[357.506%], Monopar [337.489%], Nektar [319.84%], 908 Devices[299.543%], DBV Technologies[276.923%] Best Healthcare Stocks This Week:
Athersys [193287%], Nobilis Health[101349%], VBI Vaccines[86898.5%], ContraFect [47677.8%], Clovis Oncology[39610.5%], Endo [28369.6%], NanoString Technologies[17224.7%], Neptune Wellness[14100%], ViewRay [11470.2%], Mallkrodt [11382.1%], Achillion [10033.3%] Best Healthcare Stocks Daily:
Kaleido BioSciences[9900%], Neoleukin [332.665%], Syros [226.23%], Athenex [103.333%], Taysha Gene[53.4591%], DBV Technologies[21.6485%], Valneva SE[20.197%], ClearPoint Neuro[19.7991%], Prime Medicine[19.4097%], Accelerate Diagnostics[17.6471%], Aptose Biosciences[17.5439%]