
 Login Sign Up


| |||||
 |  | ||||

| 12Stocks.com Market Intelligence |
Best Healthcare Stocks
 | "Discover best trending healthcare stocks with 12Stocks.com." |
| - Subu Vdaygiri, Founder, 12Stocks.com |
| In a hurry? Healthcare Stocks Lists: Performance Trends Table, Stock Charts
Sort Healthcare stocks: Daily, Weekly, Year-to-Date, Market Cap & Trends. Filter Healthcare stocks list by size:All Healthcare Large Mid-Range Small |
| 12Stocks.com Healthcare Stocks Performances & Trends Daily | |||||||||
|
|  The overall Smart Investing & Trading Score is 100 (0-bearish to 100-bullish) which puts Healthcare sector in short term bullish trend. The Smart Investing & Trading Score from previous trading session is 70 and an improvement of trend continues.
| ||||||||
Here are the Smart Investing & Trading Scores of the most requested Healthcare stocks at 12Stocks.com (click stock name for detailed review):
|


| 12Stocks.com: Investing in Healthcare sector with Stocks | |
|
The following table helps investors and traders sort through current performance and trends (as measured by Smart Investing & Trading Score) of various
stocks in the Healthcare sector. Quick View: Move mouse or cursor over stock symbol (ticker) to view short-term Technical chart and over stock name to view long term chart. Click on  to add stock symbol to your watchlist and to add stock symbol to your watchlist and  to view watchlist. Click on any ticker or stock name for detailed market intelligence report for that stock. to view watchlist. Click on any ticker or stock name for detailed market intelligence report for that stock. |
12Stocks.com Performance of Stocks in Healthcare Sector
| Ticker | Stock Name | Watchlist | Category | Recent Price | Smart Investing & Trading Score | Change % | YTD Change% |
| FCSC | Fibrocell Science |   | Pharmaceutical | 42.14 | 70 | 4.33 | 0.00% |
| CXRX | Concordia | | Biotechnology | 42.14 | 70 | 4.33 | 0.00% |
| OBIO | Orchestra BioMed | | Biotechnology | 2.66 | 80 | 4.31 | -50.56% |
| RCEL | AVITA | | Medical Devices | 5.47 | 90 | 4.19 | -57.23% |
| PRQR | ProQR | | Biotechnology | 2.25 | 90 | 4.17 | -17.88% |
| CMPS | Compass Pathways | | Medical Care Facilities | 6.01 | 100 | 4.16 | 44.82% |
| IVC | Invacare | | Equipment | 0.02 | 30 | 4.12 | 0.00% |
| NAUT | Nautilus Biotechnology | | Biotechnology | 0.87 | 100 | 4.06 | -48.57% |
| CERC | Cerecor | | Biotechnology | 6652.80 | 70 | 4.05 | 0.00% |
| ALLO | Allogene | | Biotechnology | 1.29 | 90 | 4.03 | -41.36% |
| PRAX | Praxis Precision | | Biotechnology | 55.15 | 90 | 4.02 | -30.65% |
| INO | Inovio | | Biotechnology | 2.46 | 70 | 4.01 | 35.44% |
| HUM | Humana | | Healthcare Plans | 256.62 | 40 | 3.99 | 2.28% |
| KND | Kindred | | Long-Term | 15.79 | 100 | 3.95 | 0.00% |
| IONS | Ionis | | Biotechnology | 68.40 | 100 | 3.95 | 97.18% |
| ACIU | AC Immune | | Biotechnology | 3.16 | 100 | 3.95 | 10.88% |
| BNR | Burning Rock | | Diagnostics & Research | 9.01 | 50 | 3.92 | 21.92% |
| IRTC | iRhythm Technologies | | Medical Devices | 174.00 | 70 | 3.91 | 94.54% |
| IMMP | Immutep | | Biotechnology | 1.88 | 100 | 3.87 | -14.93% |
| PRTK | Paratek | | Biotechnology | 58.01 | 90 | 3.83 | 0.00% |
| INSM | Insmed | | Biotechnology | 152.83 | 90 | 3.77 | 118.49% |
| SGMO | Sangamo | | Biotechnology | 0.70 | 80 | 3.77 | -38.05% |
| XERS | Xeris Biopharma | | Biotechnology | 8.31 | 90 | 3.75 | 140.17% |
| SRRA | Sierra Oncology | | Biotechnology | 14.95 | 30 | 3.68 | 0.00% |
| AHCO | AdaptHealth Corp | | Medical Devices | 9.45 | 90 | 3.68 | -2.63% |
| For chart view version of above stock list: Chart View ➞ 0 - 25 , 25 - 50 , 50 - 75 , 75 - 100 , 100 - 125 , 125 - 150 , 150 - 175 , 175 - 200 , 200 - 225 , 225 - 250 , 250 - 275 , 275 - 300 , 300 - 325 , 325 - 350 , 350 - 375 , 375 - 400 , 400 - 425 , 425 - 450 , 450 - 475 , 475 - 500 , 500 - 525 , 525 - 550 , 550 - 575 , 575 - 600 , 600 - 625 , 625 - 650 , 650 - 675 , 675 - 700 , 700 - 725 , 725 - 750 , 750 - 775 , 775 - 800 , 800 - 825 , 825 - 850 , 850 - 875 , 875 - 900 , 900 - 925 , 925 - 950 , 950 - 975 , 975 - 1000 | ||
 | Click To Change The Sort Order: By Market Cap or Company Size Performance: Year-to-date, Week and Day |  |
|
Get the most comprehensive stock market coverage daily at 12Stocks.com ➞ Best Stocks Today ➞ Best Stocks Weekly ➞ Best Stocks Year-to-Date ➞ Best Stocks Trends ➞  Best Stocks Today 12Stocks.com Best Nasdaq Stocks ➞ Best S&P 500 Stocks ➞ Best Tech Stocks ➞ Best Biotech Stocks ➞ |
| Detailed Overview of Healthcare Stocks |
| Healthcare Technical Overview, Leaders & Laggards, Top Healthcare ETF Funds & Detailed Healthcare Stocks List, Charts, Trends & More |
| Healthcare Sector: Technical Analysis, Trends & YTD Performance | |
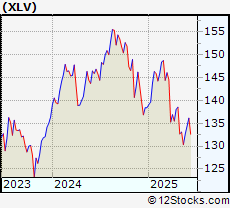
| Healthcare sector is composed of stocks
from pharmaceutical, biotech, diagnostics labs, insurance providers
and healthcare services. Healthcare sector, as represented by XLV, an exchange-traded fund [ETF] that holds basket of Healthcare stocks (e.g, Merck, Amgen) is up by 4.95646% and is currently underperforming the overall market by -9.80144% year-to-date. Below is a quick view of Technical charts and trends: |
|
 XLV Weekly Chart |
|
| Long Term Trend: Very Good | |
| Medium Term Trend: Very Good | |
 XLV Daily Chart |
|
| Short Term Trend: Very Good | |
| Overall Trend Score: 100 | |
| YTD Performance: 4.95646% | |
| **Trend Scores & Views Are Only For Educational Purposes And Not For Investing | |
| 12Stocks.com: Top Performing Healthcare Sector Stocks | ||||||||||||||||||||||||||||||||||||||||||||||
 The top performing Healthcare sector stocks year to date are
Now, more recently, over last week, the top performing Healthcare sector stocks on the move are


|
||||||||||||||||||||||||||||||||||||||||||||||
| 12Stocks.com: Investing in Healthcare Sector using Exchange Traded Funds | |
|
The following table shows list of key exchange traded funds (ETF) that
help investors track Healthcare Index. For detailed view, check out our ETF Funds section of our website. Quick View: Move mouse or cursor over ETF symbol (ticker) to view short-term Technical chart and over ETF name to view long term chart. Click on ticker or stock name for detailed view. Click on to add stock symbol to your watchlist and to view watchlist. |
12Stocks.com List of ETFs that track Healthcare Index
| Ticker | ETF Name | Watchlist | Recent Price | Smart Investing & Trading Score | Change % | Week % | Year-to-date % |
| BTEC | Principal Healthcare Innovators | | 39.49 | 30 | 0 | 1.02328 | 0% |
| 12Stocks.com: Charts, Trends, Fundamental Data and Performances of Healthcare Stocks | |
|
We now take in-depth look at all Healthcare stocks including charts, multi-period performances and overall trends (as measured by Smart Investing & Trading Score). One can sort Healthcare stocks (click link to choose) by Daily, Weekly and by Year-to-Date performances. Also, one can sort by size of the company or by market capitalization. |
| Select Your Default Chart Type: | |||||
| |||||
| Click on stock symbol or name for detailed view. Click on to add stock symbol to your watchlist and to view watchlist. Quick View: Move mouse or cursor over "Daily" to quickly view daily Technical stock chart and over "Weekly" to view weekly Technical stock chart. | |||||

 | FCSC Fibrocell Science, Inc. |
| Sector: Health Care | |
| SubSector: Drugs - Generic | |
| MarketCap: 96.72 Millions | |
| Recent Price: 42.14 Smart Investing & Trading Score: 70 | |
| Day Percent Change: 4.33276% Day Change: -9999 | |
| Week Change: 1169.28% Year-to-date Change: 0.0% | |
| FCSC Links: Profile News Message Board | |
| Charts:- Daily , Weekly | |
| Add FCSC to Watchlist: View: Get Complete FCSC Trend Analysis ➞ | |
 | CXRX Concordia International Corp. |
| Sector: Health Care | |
| SubSector: Biotechnology | |
| MarketCap: 101.01 Millions | |
| Recent Price: 42.14 Smart Investing & Trading Score: 70 | |
| Day Percent Change: 4.33276% Day Change: -9999 | |
| Week Change: 283.789% Year-to-date Change: 0.0% | |
| CXRX Links: Profile News Message Board | |
| Charts:- Daily , Weekly | |
| Add CXRX to Watchlist: View: Get Complete CXRX Trend Analysis ➞ | |
 | OBIO Orchestra BioMed Holdings Inc |
| Sector: Health Care | |
| SubSector: Biotechnology | |
| MarketCap: 148.38 Millions | |
| Recent Price: 2.66 Smart Investing & Trading Score: 80 | |
| Day Percent Change: 4.31373% Day Change: 0.06 | |
| Week Change: 9.91736% Year-to-date Change: -50.6% | |
| OBIO Links: Profile News Message Board | |
| Charts:- Daily , Weekly | |
| Add OBIO to Watchlist: View: Get Complete OBIO Trend Analysis ➞ | |
 | RCEL AVITA Medical Inc |
| Sector: Health Care | |
| SubSector: Medical Devices | |
| MarketCap: 105.82 Millions | |
| Recent Price: 5.47 Smart Investing & Trading Score: 90 | |
| Day Percent Change: 4.19048% Day Change: 0.06 | |
| Week Change: 4.19048% Year-to-date Change: -57.2% | |
| RCEL Links: Profile News Message Board | |
| Charts:- Daily , Weekly | |
| Add RCEL to Watchlist: View: Get Complete RCEL Trend Analysis ➞ | |
 | PRQR ProQR Therapeutics N.V |
| Sector: Health Care | |
| SubSector: Biotechnology | |
| MarketCap: 257.77 Millions | |
| Recent Price: 2.25 Smart Investing & Trading Score: 90 | |
| Day Percent Change: 4.16667% Day Change: 0.07 | |
| Week Change: 4.16667% Year-to-date Change: -17.9% | |
| PRQR Links: Profile News Message Board | |
| Charts:- Daily , Weekly | |
| Add PRQR to Watchlist: View: Get Complete PRQR Trend Analysis ➞ | |
 | CMPS Compass Pathways Plc ADR |
| Sector: Health Care | |
| SubSector: Medical Care Facilities | |
| MarketCap: 481.05 Millions | |
| Recent Price: 6.01 Smart Investing & Trading Score: 100 | |
| Day Percent Change: 4.15945% Day Change: 0.23 | |
| Week Change: 8.48375% Year-to-date Change: 44.8% | |
| CMPS Links: Profile News Message Board | |
| Charts:- Daily , Weekly | |
| Add CMPS to Watchlist: View: Get Complete CMPS Trend Analysis ➞ | |
 | IVC Invacare Corporation |
| Sector: Health Care | |
| SubSector: Medical Appliances & Equipment | |
| MarketCap: 180.08 Millions | |
| Recent Price: 0.02 Smart Investing & Trading Score: 30 | |
| Day Percent Change: 4.11765% Day Change: -9999 | |
| Week Change: 4.11765% Year-to-date Change: 0.0% | |
| IVC Links: Profile News Message Board | |
| Charts:- Daily , Weekly | |
| Add IVC to Watchlist: View: Get Complete IVC Trend Analysis ➞ | |
 | NAUT Nautilus Biotechnology Inc |
| Sector: Health Care | |
| SubSector: Biotechnology | |
| MarketCap: 83.49 Millions | |
| Recent Price: 0.87 Smart Investing & Trading Score: 100 | |
| Day Percent Change: 4.05891% Day Change: -0.02 | |
| Week Change: 20.6916% Year-to-date Change: -48.6% | |
| NAUT Links: Profile News Message Board | |
| Charts:- Daily , Weekly | |
| Add NAUT to Watchlist: View: Get Complete NAUT Trend Analysis ➞ | |
 | CERC Cerecor Inc. |
| Sector: Health Care | |
| SubSector: Biotechnology | |
| MarketCap: 205.885 Millions | |
| Recent Price: 6652.80 Smart Investing & Trading Score: 70 | |
| Day Percent Change: 4.05405% Day Change: -9999 | |
| Week Change: 3.125% Year-to-date Change: 0.0% | |
| CERC Links: Profile News Message Board | |
| Charts:- Daily , Weekly | |
| Add CERC to Watchlist: View: Get Complete CERC Trend Analysis ➞ | |
 | ALLO Allogene Therapeutics Inc |
| Sector: Health Care | |
| SubSector: Biotechnology | |
| MarketCap: 255.16 Millions | |
| Recent Price: 1.29 Smart Investing & Trading Score: 90 | |
| Day Percent Change: 4.03226% Day Change: 0.06 | |
| Week Change: 4.87805% Year-to-date Change: -41.4% | |
| ALLO Links: Profile News Message Board | |
| Charts:- Daily , Weekly | |
| Add ALLO to Watchlist: View: Get Complete ALLO Trend Analysis ➞ | |
 | PRAX Praxis Precision Medicines Inc |
| Sector: Health Care | |
| SubSector: Biotechnology | |
| MarketCap: 985.99 Millions | |
| Recent Price: 55.15 Smart Investing & Trading Score: 90 | |
| Day Percent Change: 4.01735% Day Change: 1.13 | |
| Week Change: 12.62% Year-to-date Change: -30.6% | |
| PRAX Links: Profile News Message Board | |
| Charts:- Daily , Weekly | |
| Add PRAX to Watchlist: View: Get Complete PRAX Trend Analysis ➞ | |
 | INO Inovio Pharmaceuticals Inc |
| Sector: Health Care | |
| SubSector: Biotechnology | |
| MarketCap: 148.27 Millions | |
| Recent Price: 2.46 Smart Investing & Trading Score: 70 | |
| Day Percent Change: 4.00844% Day Change: 0.06 | |
| Week Change: -2.18254% Year-to-date Change: 35.4% | |
| INO Links: Profile News Message Board | |
| Charts:- Daily , Weekly | |
| Add INO to Watchlist: View: Get Complete INO Trend Analysis ➞ | |
 | HUM Humana Inc |
| Sector: Health Care | |
| SubSector: Healthcare Plans | |
| MarketCap: 37034.1 Millions | |
| Recent Price: 256.62 Smart Investing & Trading Score: 40 | |
| Day Percent Change: 3.99157% Day Change: 7.65 | |
| Week Change: -2.04222% Year-to-date Change: 2.3% | |
| HUM Links: Profile News Message Board | |
| Charts:- Daily , Weekly | |
| Add HUM to Watchlist: View: Get Complete HUM Trend Analysis ➞ | |
 | KND Kindred Healthcare, Inc. |
| Sector: Health Care | |
| SubSector: Long-Term Care Facilities | |
| MarketCap: 722.78 Millions | |
| Recent Price: 15.79 Smart Investing & Trading Score: 100 | |
| Day Percent Change: 3.94997% Day Change: -9999 | |
| Week Change: 37.3043% Year-to-date Change: 0.0% | |
| KND Links: Profile News Message Board | |
| Charts:- Daily , Weekly | |
| Add KND to Watchlist: View: Get Complete KND Trend Analysis ➞ | |
 | IONS Ionis Pharmaceuticals Inc |
| Sector: Health Care | |
| SubSector: Biotechnology | |
| MarketCap: 9759.53 Millions | |
| Recent Price: 68.40 Smart Investing & Trading Score: 100 | |
| Day Percent Change: 3.95137% Day Change: 1.93 | |
| Week Change: 6.94184% Year-to-date Change: 97.2% | |
| IONS Links: Profile News Message Board | |
| Charts:- Daily , Weekly | |
| Add IONS to Watchlist: View: Get Complete IONS Trend Analysis ➞ | |
 | ACIU AC Immune SA |
| Sector: Health Care | |
| SubSector: Biotechnology | |
| MarketCap: 225.59 Millions | |
| Recent Price: 3.16 Smart Investing & Trading Score: 100 | |
| Day Percent Change: 3.94737% Day Change: -0.04 | |
| Week Change: 15.7509% Year-to-date Change: 10.9% | |
| ACIU Links: Profile News Message Board | |
| Charts:- Daily , Weekly | |
| Add ACIU to Watchlist: View: Get Complete ACIU Trend Analysis ➞ | |
 | BNR Burning Rock Biotech Ltd ADR |
| Sector: Health Care | |
| SubSector: Diagnostics & Research | |
| MarketCap: 74.95 Millions | |
| Recent Price: 9.01 Smart Investing & Trading Score: 50 | |
| Day Percent Change: 3.92157% Day Change: 0.56 | |
| Week Change: -1.09769% Year-to-date Change: 21.9% | |
| BNR Links: Profile News Message Board | |
| Charts:- Daily , Weekly | |
| Add BNR to Watchlist: View: Get Complete BNR Trend Analysis ➞ | |
 | IRTC iRhythm Technologies Inc |
| Sector: Health Care | |
| SubSector: Medical Devices | |
| MarketCap: 5816.73 Millions | |
| Recent Price: 174.00 Smart Investing & Trading Score: 70 | |
| Day Percent Change: 3.91162% Day Change: 3.48 | |
| Week Change: 0.0402461% Year-to-date Change: 94.5% | |
| IRTC Links: Profile News Message Board | |
| Charts:- Daily , Weekly | |
| Add IRTC to Watchlist: View: Get Complete IRTC Trend Analysis ➞ | |
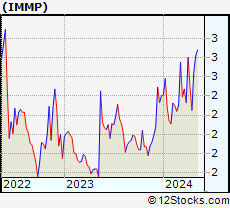 | IMMP Immutep Limited ADR |
| Sector: Health Care | |
| SubSector: Biotechnology | |
| MarketCap: 242.2 Millions | |
| Recent Price: 1.88 Smart Investing & Trading Score: 100 | |
| Day Percent Change: 3.8674% Day Change: -0.02 | |
| Week Change: 11.2426% Year-to-date Change: -14.9% | |
| IMMP Links: Profile News Message Board | |
| Charts:- Daily , Weekly | |
| Add IMMP to Watchlist: View: Get Complete IMMP Trend Analysis ➞ | |
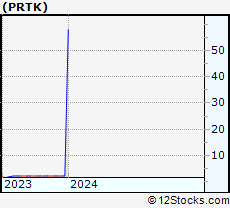 | PRTK Paratek Pharmaceuticals, Inc. |
| Sector: Health Care | |
| SubSector: Biotechnology | |
| MarketCap: 151.185 Millions | |
| Recent Price: 58.01 Smart Investing & Trading Score: 90 | |
| Day Percent Change: 3.83032% Day Change: -9999 | |
| Week Change: 2501.35% Year-to-date Change: 0.0% | |
| PRTK Links: Profile News Message Board | |
| Charts:- Daily , Weekly | |
| Add PRTK to Watchlist: View: Get Complete PRTK Trend Analysis ➞ | |
 | INSM Insmed Inc |
| Sector: Health Care | |
| SubSector: Biotechnology | |
| MarketCap: 30670.5 Millions | |
| Recent Price: 152.83 Smart Investing & Trading Score: 90 | |
| Day Percent Change: 3.76833% Day Change: 3.15 | |
| Week Change: 8.39007% Year-to-date Change: 118.5% | |
| INSM Links: Profile News Message Board | |
| Charts:- Daily , Weekly | |
| Add INSM to Watchlist: View: Get Complete INSM Trend Analysis ➞ | |
 | SGMO Sangamo Therapeutics Inc |
| Sector: Health Care | |
| SubSector: Biotechnology | |
| MarketCap: 165.1 Millions | |
| Recent Price: 0.70 Smart Investing & Trading Score: 80 | |
| Day Percent Change: 3.76519% Day Change: 0.03 | |
| Week Change: 23.9157% Year-to-date Change: -38.1% | |
| SGMO Links: Profile News Message Board | |
| Charts:- Daily , Weekly | |
| Add SGMO to Watchlist: View: Get Complete SGMO Trend Analysis ➞ | |
 | XERS Xeris Biopharma Holdings Inc |
| Sector: Health Care | |
| SubSector: Biotechnology | |
| MarketCap: 1267.62 Millions | |
| Recent Price: 8.31 Smart Investing & Trading Score: 90 | |
| Day Percent Change: 3.74532% Day Change: 0.02 | |
| Week Change: 3.875% Year-to-date Change: 140.2% | |
| XERS Links: Profile News Message Board | |
| Charts:- Daily , Weekly | |
| Add XERS to Watchlist: View: Get Complete XERS Trend Analysis ➞ | |
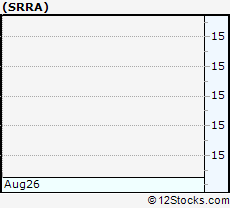 | SRRA Sierra Oncology, Inc. |
| Sector: Health Care | |
| SubSector: Biotechnology | |
| MarketCap: 125.185 Millions | |
| Recent Price: 14.95 Smart Investing & Trading Score: 30 | |
| Day Percent Change: 3.67545% Day Change: -9999 | |
| Week Change: -72.8132% Year-to-date Change: 0.0% | |
| SRRA Links: Profile News Message Board | |
| Charts:- Daily , Weekly | |
| Add SRRA to Watchlist: View: Get Complete SRRA Trend Analysis ➞ | |
 | AHCO AdaptHealth Corp |
| Sector: Health Care | |
| SubSector: Medical Devices | |
| MarketCap: 1286.68 Millions | |
| Recent Price: 9.45 Smart Investing & Trading Score: 90 | |
| Day Percent Change: 3.67728% Day Change: -0.01 | |
| Week Change: 5.53073% Year-to-date Change: -2.6% | |
| AHCO Links: Profile News Message Board | |
| Charts:- Daily , Weekly | |
| Add AHCO to Watchlist: View: Get Complete AHCO Trend Analysis ➞ | |
| For tabular summary view of above stock list: Summary View ➞ 0 - 25 , 25 - 50 , 50 - 75 , 75 - 100 , 100 - 125 , 125 - 150 , 150 - 175 , 175 - 200 , 200 - 225 , 225 - 250 , 250 - 275 , 275 - 300 , 300 - 325 , 325 - 350 , 350 - 375 , 375 - 400 , 400 - 425 , 425 - 450 , 450 - 475 , 475 - 500 , 500 - 525 , 525 - 550 , 550 - 575 , 575 - 600 , 600 - 625 , 625 - 650 , 650 - 675 , 675 - 700 , 700 - 725 , 725 - 750 , 750 - 775 , 775 - 800 , 800 - 825 , 825 - 850 , 850 - 875 , 875 - 900 , 900 - 925 , 925 - 950 , 950 - 975 , 975 - 1000 | ||
| Click To Change The Sort Order: By Market Cap or Company Size Performance: Year-to-date, Week and Day | |
| Select Chart Type: | ||
|
Best Stocks Today 12Stocks.com |
© 2025 12Stocks.com Terms & Conditions Privacy Contact Us
All Information Provided Only For Education And Not To Be Used For Investing or Trading. See Terms & Conditions


One More Thing ... Get Best Stocks Delivered Daily!
Never Ever Miss A Move With Our Top Ten Stocks Lists
Find Best Stocks In Any Market - Bull or Bear Market
Take A Peek At Our Top Ten Stocks Lists: Daily, Weekly, Year-to-Date & Top Trends
Find Best Stocks In Any Market - Bull or Bear Market
Take A Peek At Our Top Ten Stocks Lists: Daily, Weekly, Year-to-Date & Top Trends
Healthcare Stocks With Best Up Trends [0-bearish to 100-bullish]: Taysha Gene[100], DBV Technologies[100], Valneva SE[100], ClearPoint Neuro[100], Prime Medicine[100], AlloVir [100], Sarepta [100], Monopar [100], Cara [100], Absci Corp[100], Spruce Biosciences[100]
Best Healthcare Stocks Year-to-Date:
Regencell Bioscience[12636.6%], Kaleido BioSciences[9900%], Vor Biopharma[3175%], Nanobiotix ADR[581.379%], Eagle [542.857%], So-Young [395.711%], I-Mab ADR[357.506%], Monopar [337.489%], Nektar [319.84%], 908 Devices[299.543%], DBV Technologies[276.923%] Best Healthcare Stocks This Week:
Athersys [193287%], Nobilis Health[101349%], VBI Vaccines[86898.5%], ContraFect [47677.8%], Clovis Oncology[39610.5%], Endo [28369.6%], NanoString Technologies[17224.7%], Neptune Wellness[14100%], ViewRay [11470.2%], Mallkrodt [11382.1%], Achillion [10033.3%] Best Healthcare Stocks Daily:
Kaleido BioSciences[9900%], Neoleukin [332.665%], Syros [226.23%], Athenex [103.333%], Taysha Gene[53.4591%], DBV Technologies[21.6485%], Valneva SE[20.197%], ClearPoint Neuro[19.7991%], Prime Medicine[19.4097%], Accelerate Diagnostics[17.6471%], Aptose Biosciences[17.5439%]