
 Login Sign Up


| |||||
 |  | ||||

| 12Stocks.com Market Intelligence |
Best Financial Stocks
| In a hurry? Financial Stocks Lists: Performance Trends Table, Stock Charts
Sort Financial stocks: Daily, Weekly, Year-to-Date, Market Cap & Trends. Filter Financial stocks list by size:All Financial Large Mid-Range Small & MicroCap |
| 12Stocks.com Financial Stocks Performances & Trends Daily | |||||||||
|
|  The overall Smart Investing & Trading Score is 30 (0-bearish to 100-bullish) which puts Financial sector in short term bearish to neutral trend. The Smart Investing & Trading Score from previous trading session is 100 and a deterioration of trend continues.
| ||||||||
Here are the Smart Investing & Trading Scores of the most requested Financial stocks at 12Stocks.com (click stock name for detailed review):
|


| 12Stocks.com: Investing in Financial sector with Stocks | |
|
The following table helps investors and traders sort through current performance and trends (as measured by Smart Investing & Trading Score) of various
stocks in the Financial sector. Quick View: Move mouse or cursor over stock symbol (ticker) to view short-term Technical chart and over stock name to view long term chart. Click on  to add stock symbol to your watchlist and to add stock symbol to your watchlist and  to view watchlist. Click on any ticker or stock name for detailed market intelligence report for that stock. to view watchlist. Click on any ticker or stock name for detailed market intelligence report for that stock. |
12Stocks.com Performance of Stocks in Financial Sector
| Ticker | Stock Name | Watchlist | Category | Recent Price | Smart Investing & Trading Score | Change % | Weekly Change% |
| FG | F&G Annuities |   | Insurance - Life | 34.57 | 60 | 0.47% | -3.00% |
| BSBR | Banco Santander | | Banks - Regional | 5.30 | 100 | 0.00% | -3.01% |
| PFLT | PennantPark Floating | | Asset Mgmt | 10.27 | 60 | -0.39% | -3.06% |
| ABCB | Ameris Bancorp | | Banks - Regional | 73.28 | 90 | -0.83% | -3.07% |
| RMR | RMR | | Real Estate Services | 16.88 | 80 | -1.23% | -3.08% |
| COMP | Compass | | Real Estate Services | 9.08 | 100 | 2.54% | -3.08% |
| GLQ | Clough Global | | Closed-End Fund - Equity | 7.41 | 50 | -0.55% | -3.10% |
| KF | Korea Fund | | Closed-End Fund - Foreign | 27.34 | 70 | 0.26% | -3.11% |
| COLB | Columbia Banking | | Banks - Regional | 26.77 | 60 | -1.13% | -3.14% |
| BLFY | Blue Foundry | | Banks - Regional | 9.29 | 80 | -1.00% | -3.16% |
| HFWA | Heritage | | Banks - Regional | 24.44 | 90 | -1.03% | -3.19% |
| BGH | Barings Global | | Closed-End Fund - Debt | 16.37 | 100 | -0.44% | -3.19% |
| MITT | AG Mortgage | | REIT - Mortgage | 7.56 | 100 | -1.63% | -3.20% |
| WASH | Washington Trust | | Banks - Regional | 30.33 | 60 | -0.85% | -3.21% |
| AHH | Armada Hoffler | | REIT - | 7.28 | 100 | 0.29% | -3.21% |
| PPBI | Pacific Premier | | Banks - Regional | 24.49 | 90 | -1.21% | -3.27% |
| FSBW | FS Bancorp | | Banks - Regional | 42.71 | 60 | -0.20% | -3.30% |
| FSFG | First Savings | | Banks - Regional | 27.42 | 50 | -2.27% | -3.32% |
| BST | BlackRock Science | | Closed-End Fund - Equity | 39.72 | 80 | -0.29% | -3.32% |
| CFFI | C & F Corp | | Banks - Regional | 71.98 | 90 | -1.06% | -3.33% |
| BFK | BlackRock Municipal | | Closed-End Fund - Debt | 9.68 | 100 | -0.83% | -3.34% |
| JOE | St. Joe | | Real Estate - | 50.46 | 70 | -0.33% | -3.35% |
| RPT | Rithm Property | | REIT - Mortgage | 2.57 | 80 | -0.39% | -3.41% |
| EGBN | Eagle Bancorp | | Banks - Regional | 19.42 | 90 | -2.47% | -3.42% |
| MMC | Marsh & McLennan Cos | | Insurance | 203.3 | 10 | -1.36% | -3.44% |
| For chart view version of above stock list: Chart View ➞ 0 - 25 , 25 - 50 , 50 - 75 , 75 - 100 , 100 - 125 , 125 - 150 , 150 - 175 , 175 - 200 , 200 - 225 , 225 - 250 , 250 - 275 , 275 - 300 , 300 - 325 , 325 - 350 , 350 - 375 , 375 - 400 , 400 - 425 , 425 - 450 , 450 - 475 , 475 - 500 , 500 - 525 , 525 - 550 , 550 - 575 , 575 - 600 , 600 - 625 , 625 - 650 , 650 - 675 , 675 - 700 , 700 - 725 , 725 - 750 , 750 - 775 , 775 - 800 , 800 - 825 , 825 - 850 , 850 - 875 , 875 - 900 , 900 - 925 , 925 - 950 , 950 - 975 , 975 - 1000 , 1000 - 1025 , 1025 - 1050 , 1050 - 1075 , 1075 - 1100 | ||
 | Click To Change The Sort Order: By Market Cap or Company Size Performance: Year-to-date, Week and Day |  |
|
Get the most comprehensive stock market coverage daily at 12Stocks.com ➞ Best Stocks Today ➞ Best Stocks Weekly ➞ Best Stocks Year-to-Date ➞ Best Stocks Trends ➞  Best Stocks Today 12Stocks.com Best Nasdaq Stocks ➞ Best S&P 500 Stocks ➞ Best Tech Stocks ➞ Best Biotech Stocks ➞ |
| Detailed Overview of Financial Stocks |
| Financial Technical Overview, Leaders & Laggards, Top Financial ETF Funds & Detailed Financial Stocks List, Charts, Trends & More |
| Financial Sector: Technical Analysis, Trends & YTD Performance | |
| Financial sector is composed of stocks
from banks, brokers, insurance, REITs
and services subsectors. Financial sector, as represented by XLF, an exchange-traded fund [ETF] that holds basket of Financial stocks (e.g, Bank of America, Goldman Sachs) is up by 3.84% and is currently underperforming the overall market by -3.88% year-to-date. Below is a quick view of Technical charts and trends: |
|
 XLF Weekly Chart |
|
| Long Term Trend: Good | |
| Medium Term Trend: Good | |
 XLF Daily Chart |
|
| Short Term Trend: Not Good | |
| Overall Trend Score: 30 | |
| YTD Performance: 3.84% | |
| **Trend Scores & Views Are Only For Educational Purposes And Not For Investing | |
| 12Stocks.com: Top Performing Financial Sector Stocks | ||||||||||||||||||||||||||||||||||||||||||||||||
 The top performing Financial sector stocks year to date are
Now, more recently, over last week, the top performing Financial sector stocks on the move are


|
||||||||||||||||||||||||||||||||||||||||||||||||
| 12Stocks.com: Investing in Financial Sector using Exchange Traded Funds | |
|
The following table shows list of key exchange traded funds (ETF) that
help investors track Financial Index. For detailed view, check out our ETF Funds section of our website. Quick View: Move mouse or cursor over ETF symbol (ticker) to view short-term Technical chart and over ETF name to view long term chart. Click on ticker or stock name for detailed view. Click on to add stock symbol to your watchlist and to view watchlist. |
12Stocks.com List of ETFs that track Financial Index
| Ticker | ETF Name | Watchlist | Recent Price | Smart Investing & Trading Score | Change % | Week % | Year-to-date % |
| 12Stocks.com: Charts, Trends, Fundamental Data and Performances of Financial Stocks | |
|
We now take in-depth look at all Financial stocks including charts, multi-period performances and overall trends (as measured by Smart Investing & Trading Score). One can sort Financial stocks (click link to choose) by Daily, Weekly and by Year-to-Date performances. Also, one can sort by size of the company or by market capitalization. |
| Select Your Default Chart Type: | |||||
| |||||
| Click on stock symbol or name for detailed view. Click on to add stock symbol to your watchlist and to view watchlist. Quick View: Move mouse or cursor over "Daily" to quickly view daily Technical stock chart and over "Weekly" to view weekly Technical stock chart. | |||||

 | FG F&G Annuities & Life Inc |
| Sector: Financials | |
| SubSector: Insurance - Life | |
| MarketCap: 4645.38 Millions | |
| Recent Price: 34.57 Smart Investing & Trading Score: 60 | |
| Day Percent Change: 0.47% Day Change: 0.16 | |
| Week Change: -3% Year-to-date Change: -16.3% | |
| FG Links: Profile News Message Board | |
| Charts:- Daily , Weekly | |
| Add FG to Watchlist: View: Get Complete FG Trend Analysis ➞ | |
 | BSBR Banco Santander (Brasil) S.A. ADR |
| Sector: Financials | |
| SubSector: Banks - Regional | |
| MarketCap: 20321.1 Millions | |
| Recent Price: 5.30 Smart Investing & Trading Score: 100 | |
| Day Percent Change: 0% Day Change: 0 | |
| Week Change: -3.01% Year-to-date Change: 30.2% | |
| BSBR Links: Profile News Message Board | |
| Charts:- Daily , Weekly | |
| Add BSBR to Watchlist: View: Get Complete BSBR Trend Analysis ➞ | |
 | PFLT PennantPark Floating Rate Capital Ltd |
| Sector: Financials | |
| SubSector: Asset Management | |
| MarketCap: 1017.98 Millions | |
| Recent Price: 10.27 Smart Investing & Trading Score: 60 | |
| Day Percent Change: -0.39% Day Change: -0.04 | |
| Week Change: -3.06% Year-to-date Change: -0.8% | |
| PFLT Links: Profile News Message Board | |
| Charts:- Daily , Weekly | |
| Add PFLT to Watchlist: View: Get Complete PFLT Trend Analysis ➞ | |
 | ABCB Ameris Bancorp |
| Sector: Financials | |
| SubSector: Banks - Regional | |
| MarketCap: 5077.48 Millions | |
| Recent Price: 73.28 Smart Investing & Trading Score: 90 | |
| Day Percent Change: -0.83% Day Change: -0.58 | |
| Week Change: -3.07% Year-to-date Change: 11.2% | |
| ABCB Links: Profile News Message Board | |
| Charts:- Daily , Weekly | |
| Add ABCB to Watchlist: View: Get Complete ABCB Trend Analysis ➞ | |
 | RMR RMR Group Inc |
| Sector: Financials | |
| SubSector: Real Estate Services | |
| MarketCap: 536.37 Millions | |
| Recent Price: 16.88 Smart Investing & Trading Score: 80 | |
| Day Percent Change: -1.23% Day Change: -0.2 | |
| Week Change: -3.08% Year-to-date Change: -15.7% | |
| RMR Links: Profile News Message Board | |
| Charts:- Daily , Weekly | |
| Add RMR to Watchlist: View: Get Complete RMR Trend Analysis ➞ | |
 | COMP Compass Inc |
| Sector: Financials | |
| SubSector: Real Estate Services | |
| MarketCap: 5172.28 Millions | |
| Recent Price: 9.08 Smart Investing & Trading Score: 100 | |
| Day Percent Change: 2.54% Day Change: 0.21 | |
| Week Change: -3.08% Year-to-date Change: 45.1% | |
| COMP Links: Profile News Message Board | |
| Charts:- Daily , Weekly | |
| Add COMP to Watchlist: View: Get Complete COMP Trend Analysis ➞ | |
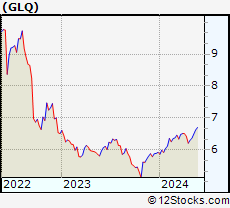 | GLQ Clough Global Equity Fund |
| Sector: Financials | |
| SubSector: Closed-End Fund - Equity | |
| MarketCap: 139.04 Millions | |
| Recent Price: 7.41 Smart Investing & Trading Score: 50 | |
| Day Percent Change: -0.55% Day Change: -0.04 | |
| Week Change: -3.1% Year-to-date Change: 15.6% | |
| GLQ Links: Profile News Message Board | |
| Charts:- Daily , Weekly | |
| Add GLQ to Watchlist: View: Get Complete GLQ Trend Analysis ➞ | |
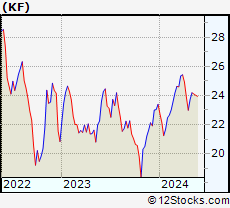 | KF Korea Fund Inc |
| Sector: Financials | |
| SubSector: Closed-End Fund - Foreign | |
| MarketCap: 116.65 Millions | |
| Recent Price: 27.34 Smart Investing & Trading Score: 70 | |
| Day Percent Change: 0.26% Day Change: 0.07 | |
| Week Change: -3.11% Year-to-date Change: 46.9% | |
| KF Links: Profile News Message Board | |
| Charts:- Daily , Weekly | |
| Add KF to Watchlist: View: Get Complete KF Trend Analysis ➞ | |
 | COLB Columbia Banking System, Inc |
| Sector: Financials | |
| SubSector: Banks - Regional | |
| MarketCap: 8047.71 Millions | |
| Recent Price: 26.77 Smart Investing & Trading Score: 60 | |
| Day Percent Change: -1.13% Day Change: -0.29 | |
| Week Change: -3.14% Year-to-date Change: -3.5% | |
| COLB Links: Profile News Message Board | |
| Charts:- Daily , Weekly | |
| Add COLB to Watchlist: View: Get Complete COLB Trend Analysis ➞ | |
 | BLFY Blue Foundry Bancorp |
| Sector: Financials | |
| SubSector: Banks - Regional | |
| MarketCap: 204.21 Millions | |
| Recent Price: 9.29 Smart Investing & Trading Score: 80 | |
| Day Percent Change: -1% Day Change: -0.09 | |
| Week Change: -3.16% Year-to-date Change: -9.5% | |
| BLFY Links: Profile News Message Board | |
| Charts:- Daily , Weekly | |
| Add BLFY to Watchlist: View: Get Complete BLFY Trend Analysis ➞ | |
 | HFWA Heritage Financial Corp |
| Sector: Financials | |
| SubSector: Banks - Regional | |
| MarketCap: 842.04 Millions | |
| Recent Price: 24.44 Smart Investing & Trading Score: 90 | |
| Day Percent Change: -1.03% Day Change: -0.24 | |
| Week Change: -3.19% Year-to-date Change: -2.9% | |
| HFWA Links: Profile News Message Board | |
| Charts:- Daily , Weekly | |
| Add HFWA to Watchlist: View: Get Complete HFWA Trend Analysis ➞ | |
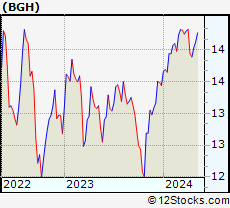 | BGH Barings Global Short Duration High Yield Fund |
| Sector: Financials | |
| SubSector: Closed-End Fund - Debt | |
| MarketCap: 331.66 Millions | |
| Recent Price: 16.37 Smart Investing & Trading Score: 100 | |
| Day Percent Change: -0.44% Day Change: -0.07 | |
| Week Change: -3.19% Year-to-date Change: 8.1% | |
| BGH Links: Profile News Message Board | |
| Charts:- Daily , Weekly | |
| Add BGH to Watchlist: View: Get Complete BGH Trend Analysis ➞ | |
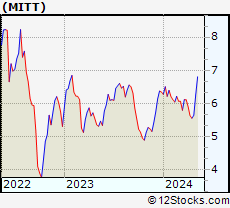 | MITT AG Mortgage Investment Trust Inc |
| Sector: Financials | |
| SubSector: REIT - Mortgage | |
| MarketCap: 246.88 Millions | |
| Recent Price: 7.56 Smart Investing & Trading Score: 100 | |
| Day Percent Change: -1.63% Day Change: -0.12 | |
| Week Change: -3.2% Year-to-date Change: 15.2% | |
| MITT Links: Profile News Message Board | |
| Charts:- Daily , Weekly | |
| Add MITT to Watchlist: View: Get Complete MITT Trend Analysis ➞ | |
 | WASH Washington Trust Bancorp, Inc |
| Sector: Financials | |
| SubSector: Banks - Regional | |
| MarketCap: 574.46 Millions | |
| Recent Price: 30.33 Smart Investing & Trading Score: 60 | |
| Day Percent Change: -0.85% Day Change: -0.24 | |
| Week Change: -3.21% Year-to-date Change: -5.3% | |
| WASH Links: Profile News Message Board | |
| Charts:- Daily , Weekly | |
| Add WASH to Watchlist: View: Get Complete WASH Trend Analysis ➞ | |
 | AHH Armada Hoffler Properties Inc |
| Sector: Financials | |
| SubSector: REIT - Diversified | |
| MarketCap: 739.86 Millions | |
| Recent Price: 7.28 Smart Investing & Trading Score: 100 | |
| Day Percent Change: 0.29% Day Change: 0.02 | |
| Week Change: -3.21% Year-to-date Change: -29.5% | |
| AHH Links: Profile News Message Board | |
| Charts:- Daily , Weekly | |
| Add AHH to Watchlist: View: Get Complete AHH Trend Analysis ➞ | |
 | PPBI Pacific Premier Bancorp, Inc |
| Sector: Financials | |
| SubSector: Banks - Regional | |
| MarketCap: 2375.32 Millions | |
| Recent Price: 24.49 Smart Investing & Trading Score: 90 | |
| Day Percent Change: -1.21% Day Change: -0.28 | |
| Week Change: -3.27% Year-to-date Change: -4.5% | |
| PPBI Links: Profile News Message Board | |
| Charts:- Daily , Weekly | |
| Add PPBI to Watchlist: View: Get Complete PPBI Trend Analysis ➞ | |
 | FSBW FS Bancorp Inc |
| Sector: Financials | |
| SubSector: Banks - Regional | |
| MarketCap: 320.57 Millions | |
| Recent Price: 42.71 Smart Investing & Trading Score: 60 | |
| Day Percent Change: -0.2% Day Change: -0.08 | |
| Week Change: -3.3% Year-to-date Change: -0.9% | |
| FSBW Links: Profile News Message Board | |
| Charts:- Daily , Weekly | |
| Add FSBW to Watchlist: View: Get Complete FSBW Trend Analysis ➞ | |
 | FSFG First Savings Financial Group Inc |
| Sector: Financials | |
| SubSector: Banks - Regional | |
| MarketCap: 188.58 Millions | |
| Recent Price: 27.42 Smart Investing & Trading Score: 50 | |
| Day Percent Change: -2.27% Day Change: -0.61 | |
| Week Change: -3.32% Year-to-date Change: 0.0% | |
| FSFG Links: Profile News Message Board | |
| Charts:- Daily , Weekly | |
| Add FSFG to Watchlist: View: Get Complete FSFG Trend Analysis ➞ | |
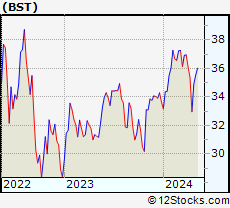 | BST BlackRock Science and Technology Trust |
| Sector: Financials | |
| SubSector: Closed-End Fund - Equity | |
| MarketCap: 1374.91 Millions | |
| Recent Price: 39.72 Smart Investing & Trading Score: 80 | |
| Day Percent Change: -0.29% Day Change: -0.11 | |
| Week Change: -3.32% Year-to-date Change: 10.3% | |
| BST Links: Profile News Message Board | |
| Charts:- Daily , Weekly | |
| Add BST to Watchlist: View: Get Complete BST Trend Analysis ➞ | |
 | CFFI C & F Financial Corp |
| Sector: Financials | |
| SubSector: Banks - Regional | |
| MarketCap: 230.89 Millions | |
| Recent Price: 71.98 Smart Investing & Trading Score: 90 | |
| Day Percent Change: -1.06% Day Change: -0.72 | |
| Week Change: -3.33% Year-to-date Change: -4.2% | |
| CFFI Links: Profile News Message Board | |
| Charts:- Daily , Weekly | |
| Add CFFI to Watchlist: View: Get Complete CFFI Trend Analysis ➞ | |
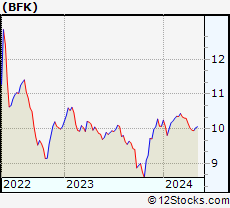 | BFK BlackRock Municipal Income Trust |
| Sector: Financials | |
| SubSector: Closed-End Fund - Debt | |
| MarketCap: 430.22 Millions | |
| Recent Price: 9.68 Smart Investing & Trading Score: 100 | |
| Day Percent Change: -0.83% Day Change: -0.08 | |
| Week Change: -3.34% Year-to-date Change: 0.4% | |
| BFK Links: Profile News Message Board | |
| Charts:- Daily , Weekly | |
| Add BFK to Watchlist: View: Get Complete BFK Trend Analysis ➞ | |
 | JOE St. Joe Co |
| Sector: Financials | |
| SubSector: Real Estate - Diversified | |
| MarketCap: 2961.43 Millions | |
| Recent Price: 50.46 Smart Investing & Trading Score: 70 | |
| Day Percent Change: -0.33% Day Change: -0.16 | |
| Week Change: -3.35% Year-to-date Change: 9.7% | |
| JOE Links: Profile News Message Board | |
| Charts:- Daily , Weekly | |
| Add JOE to Watchlist: View: Get Complete JOE Trend Analysis ➞ | |
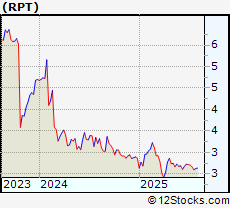 | RPT Rithm Property Trust Inc |
| Sector: Financials | |
| SubSector: REIT - Mortgage | |
| MarketCap: 120.82 Millions | |
| Recent Price: 2.57 Smart Investing & Trading Score: 80 | |
| Day Percent Change: -0.39% Day Change: -0.01 | |
| Week Change: -3.41% Year-to-date Change: -10.6% | |
| RPT Links: Profile News Message Board | |
| Charts:- Daily , Weekly | |
| Add RPT to Watchlist: View: Get Complete RPT Trend Analysis ➞ | |
 | EGBN Eagle Bancorp Inc (MD) |
| Sector: Financials | |
| SubSector: Banks - Regional | |
| MarketCap: 601.91 Millions | |
| Recent Price: 19.42 Smart Investing & Trading Score: 90 | |
| Day Percent Change: -2.47% Day Change: -0.45 | |
| Week Change: -3.42% Year-to-date Change: -29.9% | |
| EGBN Links: Profile News Message Board | |
| Charts:- Daily , Weekly | |
| Add EGBN to Watchlist: View: Get Complete EGBN Trend Analysis ➞ | |
 | MMC Marsh & McLennan Cos., Inc |
| Sector: Financials | |
| SubSector: Insurance Brokers | |
| MarketCap: 100163 Millions | |
| Recent Price: 203.3 Smart Investing & Trading Score: 10 | |
| Day Percent Change: -1.36% Day Change: -2.81 | |
| Week Change: -3.44% Year-to-date Change: -5.5% | |
| MMC Links: Profile News Message Board | |
| Charts:- Daily , Weekly | |
| Add MMC to Watchlist: View: Get Complete MMC Trend Analysis ➞ | |
| For tabular summary view of above stock list: Summary View ➞ 0 - 25 , 25 - 50 , 50 - 75 , 75 - 100 , 100 - 125 , 125 - 150 , 150 - 175 , 175 - 200 , 200 - 225 , 225 - 250 , 250 - 275 , 275 - 300 , 300 - 325 , 325 - 350 , 350 - 375 , 375 - 400 , 400 - 425 , 425 - 450 , 450 - 475 , 475 - 500 , 500 - 525 , 525 - 550 , 550 - 575 , 575 - 600 , 600 - 625 , 625 - 650 , 650 - 675 , 675 - 700 , 700 - 725 , 725 - 750 , 750 - 775 , 775 - 800 , 800 - 825 , 825 - 850 , 850 - 875 , 875 - 900 , 900 - 925 , 925 - 950 , 950 - 975 , 975 - 1000 , 1000 - 1025 , 1025 - 1050 , 1050 - 1075 , 1075 - 1100 | ||
| Click To Change The Sort Order: By Market Cap or Company Size Performance: Year-to-date, Week and Day | |
| Select Chart Type: | ||
|
Best Stocks Today 12Stocks.com |
© 2025 12Stocks.com Terms & Conditions Privacy Contact Us
All Information Provided Only For Education And Not To Be Used For Investing or Trading. See Terms & Conditions


One More Thing ... Get Best Stocks Delivered Daily!
Never Ever Miss A Move With Our Top Ten Stocks Lists
Find Best Stocks In Any Market - Bull or Bear Market
Take A Peek At Our Top Ten Stocks Lists: Daily, Weekly, Year-to-Date & Top Trends
Find Best Stocks In Any Market - Bull or Bear Market
Take A Peek At Our Top Ten Stocks Lists: Daily, Weekly, Year-to-Date & Top Trends
Financial Stocks With Best Up Trends [0-bearish to 100-bullish]: Compass [100], Western Union[100], Whitestone REIT[100], Healthcare Realty[100], Public Storage[100], Alexandria Real[100], Omega Healthcare[100], LendingTree [100], Federal Realty[100], OFS Capital[100], BXP [100]
Best Financial Stocks Year-to-Date:
ESSA Bancorp[2923.51%], Robinhood Markets[185.29%], Solowin [161.21%], Metalpha Technology[143.48%], IHS Holding[139.04%], Altisource Portfolio[127.41%], Banco Santander[113.19%], Banco Bilbao[102.83%], IREN [99.49%], Grupo Cibest[93.5%], Mr. Cooper[91.06%] Best Financial Stocks This Week:
Plymouth Industrial[40.4%], SelectQuote [30.15%], Altisource Portfolio[24.32%], Seritage Growth[20.21%], MBIA [18.44%], Nu [13.82%], Qudian [11.08%], Cipher Mining[10.9%], Brookfield Business[10.18%], BXP [9.64%], Stratus Properties[8.94%] Best Financial Stocks Daily:
SelectQuote [41.53%], X [15.73%], Altisource Portfolio[9.12%], Aegon [7.64%], UP Fintech[6.65%], FinVolution [5.55%], Hippo [5.47%], Lufax Holding[5.45%], eHealth [4.65%], MarketAxess [4.54%], Yiren Digital[3.6%]