
 Login Sign Up


| |||||
 |  | ||||

| 12Stocks.com Market Intelligence |
Best Financial Stocks
| In a hurry? Financial Stocks Lists: Performance Trends Table, Stock Charts
Sort Financial stocks: Daily, Weekly, Year-to-Date, Market Cap & Trends. Filter Financial stocks list by size:All Financial Large Mid-Range Small & MicroCap |
| 12Stocks.com Financial Stocks Performances & Trends Daily | |||||||||
|
|  The overall Smart Investing & Trading Score is 30 (0-bearish to 100-bullish) which puts Financial sector in short term bearish to neutral trend. The Smart Investing & Trading Score from previous trading session is 100 and a deterioration of trend continues.
| ||||||||
Here are the Smart Investing & Trading Scores of the most requested Financial stocks at 12Stocks.com (click stock name for detailed review):
|


| 12Stocks.com: Investing in Financial sector with Stocks | |
|
The following table helps investors and traders sort through current performance and trends (as measured by Smart Investing & Trading Score) of various
stocks in the Financial sector. Quick View: Move mouse or cursor over stock symbol (ticker) to view short-term Technical chart and over stock name to view long term chart. Click on  to add stock symbol to your watchlist and to add stock symbol to your watchlist and  to view watchlist. Click on any ticker or stock name for detailed market intelligence report for that stock. to view watchlist. Click on any ticker or stock name for detailed market intelligence report for that stock. |
12Stocks.com Performance of Stocks in Financial Sector
| Ticker | Stock Name | Watchlist | Category | Recent Price | Smart Investing & Trading Score | Change % | Weekly Change% |
| KRNY | Kearny |   | Banks - Regional | 6.75 | 50 | -0.66% | -2.42% |
| GLAD | Gladstone Capital | | Closed-End Fund - Debt | 26.42 | 10 | 0.08% | -2.42% |
| PFS | Provident | | Banks - Regional | 19.84 | 90 | -0.48% | -2.44% |
| COLD | Americold Realty | | REIT - Industrial | 14.44 | 10 | -0.96% | -2.44% |
| PDLB | Ponce | | Banks - Regional | 14.84 | 50 | -0.49% | -2.45% |
| MA | Mastercard | | Credit Services | 584.22 | 30 | -1.92% | -2.46% |
| EWBC | East West | | Banks - Regional | 105.14 | 90 | -0.70% | -2.46% |
| WD | Walker & Dunlop | | Mortgage Finance | 85.05 | 100 | -2.42% | -2.46% |
| CADE | Cadence Bank | | Banks - Regional | 37.64 | 80 | -0.25% | -2.48% |
| MQY | BlackRock MuniYield | | Closed-End Fund - Debt | 11.07 | 90 | -0.46% | -2.51% |
| MVF | BlackRock MuniVest | | Closed-End Fund - Debt | 6.61 | 90 | -0.46% | -2.54% |
| NFBK | Northfield Bancorp | | Banks - Regional | 11.85 | 80 | -0.81% | -2.55% |
| KW | Kennedy-Wilson | | Real Estate Services | 8.80 | 90 | -1.48% | -2.56% |
| CFBK | CF Bankshares | | Banks - Regional | 24.60 | 80 | 0.00% | -2.57% |
| AUB | Atlantic Union | | Banks - Regional | 35.73 | 90 | -0.98% | -2.57% |
| BANR | Banner Corp | | Banks - Regional | 67.03 | 80 | -0.51% | -2.58% |
| STT | State Street | | Asset Mgmt | 112.49 | 50 | -1.38% | -2.59% |
| AMTB | Amerant Bancorp | | Banks - Regional | 21.50 | 60 | -0.84% | -2.59% |
| VTN | Invesco Trust | | Closed-End Fund - Debt | 10.12 | 40 | -0.59% | -2.59% |
| ADX | Adams Diversified | | Closed-End Fund - Equity | 21.69 | 50 | -0.74% | -2.64% |
| NKX | Nuveen California | | Closed-End Fund - Debt | 11.82 | 90 | 0.17% | -2.65% |
| BFZ | BlackRock California | | Closed-End Fund - Debt | 10.43 | 80 | -0.39% | -2.65% |
| MOFG | MidWestOne | | Banks - Regional | 30.24 | 40 | -0.14% | -2.66% |
| AMRK | A-Mark Precious | | Capital Markets | 23.41 | 90 | -0.83% | -2.67% |
| EVR | Evercore | | Capital Markets | 321.55 | 50 | 0.16% | -2.68% |
| For chart view version of above stock list: Chart View ➞ 0 - 25 , 25 - 50 , 50 - 75 , 75 - 100 , 100 - 125 , 125 - 150 , 150 - 175 , 175 - 200 , 200 - 225 , 225 - 250 , 250 - 275 , 275 - 300 , 300 - 325 , 325 - 350 , 350 - 375 , 375 - 400 , 400 - 425 , 425 - 450 , 450 - 475 , 475 - 500 , 500 - 525 , 525 - 550 , 550 - 575 , 575 - 600 , 600 - 625 , 625 - 650 , 650 - 675 , 675 - 700 , 700 - 725 , 725 - 750 , 750 - 775 , 775 - 800 , 800 - 825 , 825 - 850 , 850 - 875 , 875 - 900 , 900 - 925 , 925 - 950 , 950 - 975 , 975 - 1000 , 1000 - 1025 , 1025 - 1050 , 1050 - 1075 , 1075 - 1100 | ||
 | Click To Change The Sort Order: By Market Cap or Company Size Performance: Year-to-date, Week and Day |  |
|
Get the most comprehensive stock market coverage daily at 12Stocks.com ➞ Best Stocks Today ➞ Best Stocks Weekly ➞ Best Stocks Year-to-Date ➞ Best Stocks Trends ➞  Best Stocks Today 12Stocks.com Best Nasdaq Stocks ➞ Best S&P 500 Stocks ➞ Best Tech Stocks ➞ Best Biotech Stocks ➞ |
| Detailed Overview of Financial Stocks |
| Financial Technical Overview, Leaders & Laggards, Top Financial ETF Funds & Detailed Financial Stocks List, Charts, Trends & More |
| Financial Sector: Technical Analysis, Trends & YTD Performance | |
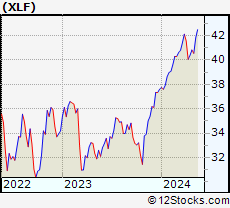
| Financial sector is composed of stocks
from banks, brokers, insurance, REITs
and services subsectors. Financial sector, as represented by XLF, an exchange-traded fund [ETF] that holds basket of Financial stocks (e.g, Bank of America, Goldman Sachs) is up by 3.84% and is currently underperforming the overall market by -3.88% year-to-date. Below is a quick view of Technical charts and trends: |
|
 XLF Weekly Chart |
|
| Long Term Trend: Good | |
| Medium Term Trend: Good | |
 XLF Daily Chart |
|
| Short Term Trend: Not Good | |
| Overall Trend Score: 30 | |
| YTD Performance: 3.84% | |
| **Trend Scores & Views Are Only For Educational Purposes And Not For Investing | |
| 12Stocks.com: Top Performing Financial Sector Stocks | ||||||||||||||||||||||||||||||||||||||||||||||||
 The top performing Financial sector stocks year to date are
Now, more recently, over last week, the top performing Financial sector stocks on the move are


|
||||||||||||||||||||||||||||||||||||||||||||||||
| 12Stocks.com: Investing in Financial Sector using Exchange Traded Funds | |
|
The following table shows list of key exchange traded funds (ETF) that
help investors track Financial Index. For detailed view, check out our ETF Funds section of our website. Quick View: Move mouse or cursor over ETF symbol (ticker) to view short-term Technical chart and over ETF name to view long term chart. Click on ticker or stock name for detailed view. Click on to add stock symbol to your watchlist and to view watchlist. |
12Stocks.com List of ETFs that track Financial Index
| Ticker | ETF Name | Watchlist | Recent Price | Smart Investing & Trading Score | Change % | Week % | Year-to-date % |
| 12Stocks.com: Charts, Trends, Fundamental Data and Performances of Financial Stocks | |
|
We now take in-depth look at all Financial stocks including charts, multi-period performances and overall trends (as measured by Smart Investing & Trading Score). One can sort Financial stocks (click link to choose) by Daily, Weekly and by Year-to-Date performances. Also, one can sort by size of the company or by market capitalization. |
| Select Your Default Chart Type: | |||||
| |||||
| Click on stock symbol or name for detailed view. Click on to add stock symbol to your watchlist and to view watchlist. Quick View: Move mouse or cursor over "Daily" to quickly view daily Technical stock chart and over "Weekly" to view weekly Technical stock chart. | |||||

 | KRNY Kearny Financial Corp |
| Sector: Financials | |
| SubSector: Banks - Regional | |
| MarketCap: 427.96 Millions | |
| Recent Price: 6.75 Smart Investing & Trading Score: 50 | |
| Day Percent Change: -0.66% Day Change: -0.04 | |
| Week Change: -2.42% Year-to-date Change: -10.1% | |
| KRNY Links: Profile News Message Board | |
| Charts:- Daily , Weekly | |
| Add KRNY to Watchlist: View: Get Complete KRNY Trend Analysis ➞ | |
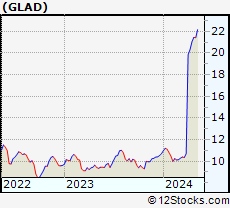 | GLAD Gladstone Capital Corp |
| Sector: Financials | |
| SubSector: Closed-End Fund - Debt | |
| MarketCap: 581.69 Millions | |
| Recent Price: 26.42 Smart Investing & Trading Score: 10 | |
| Day Percent Change: 0.08% Day Change: 0.02 | |
| Week Change: -2.42% Year-to-date Change: -2.5% | |
| GLAD Links: Profile News Message Board | |
| Charts:- Daily , Weekly | |
| Add GLAD to Watchlist: View: Get Complete GLAD Trend Analysis ➞ | |
 | PFS Provident Financial Services Inc |
| Sector: Financials | |
| SubSector: Banks - Regional | |
| MarketCap: 2612.48 Millions | |
| Recent Price: 19.84 Smart Investing & Trading Score: 90 | |
| Day Percent Change: -0.48% Day Change: -0.09 | |
| Week Change: -2.44% Year-to-date Change: 2.3% | |
| PFS Links: Profile News Message Board | |
| Charts:- Daily , Weekly | |
| Add PFS to Watchlist: View: Get Complete PFS Trend Analysis ➞ | |
 | COLD Americold Realty Trust Inc |
| Sector: Financials | |
| SubSector: REIT - Industrial | |
| MarketCap: 3978.63 Millions | |
| Recent Price: 14.44 Smart Investing & Trading Score: 10 | |
| Day Percent Change: -0.96% Day Change: -0.14 | |
| Week Change: -2.44% Year-to-date Change: -31.0% | |
| COLD Links: Profile News Message Board | |
| Charts:- Daily , Weekly | |
| Add COLD to Watchlist: View: Get Complete COLD Trend Analysis ➞ | |
 | PDLB Ponce Financial Group Inc |
| Sector: Financials | |
| SubSector: Banks - Regional | |
| MarketCap: 357.86 Millions | |
| Recent Price: 14.84 Smart Investing & Trading Score: 50 | |
| Day Percent Change: -0.49% Day Change: -0.07 | |
| Week Change: -2.45% Year-to-date Change: 10.5% | |
| PDLB Links: Profile News Message Board | |
| Charts:- Daily , Weekly | |
| Add PDLB to Watchlist: View: Get Complete PDLB Trend Analysis ➞ | |
 | MA Mastercard Incorporated |
| Sector: Financials | |
| SubSector: Credit Services | |
| MarketCap: 528142 Millions | |
| Recent Price: 584.22 Smart Investing & Trading Score: 30 | |
| Day Percent Change: -1.92% Day Change: -11.42 | |
| Week Change: -2.46% Year-to-date Change: 5.5% | |
| MA Links: Profile News Message Board | |
| Charts:- Daily , Weekly | |
| Add MA to Watchlist: View: Get Complete MA Trend Analysis ➞ | |
 | EWBC East West Bancorp, Inc |
| Sector: Financials | |
| SubSector: Banks - Regional | |
| MarketCap: 14826.2 Millions | |
| Recent Price: 105.14 Smart Investing & Trading Score: 90 | |
| Day Percent Change: -0.7% Day Change: -0.71 | |
| Week Change: -2.46% Year-to-date Change: 7.2% | |
| EWBC Links: Profile News Message Board | |
| Charts:- Daily , Weekly | |
| Add EWBC to Watchlist: View: Get Complete EWBC Trend Analysis ➞ | |
 | WD Walker & Dunlop Inc |
| Sector: Financials | |
| SubSector: Mortgage Finance | |
| MarketCap: 2984.45 Millions | |
| Recent Price: 85.05 Smart Investing & Trading Score: 100 | |
| Day Percent Change: -2.42% Day Change: -2.04 | |
| Week Change: -2.46% Year-to-date Change: -14.0% | |
| WD Links: Profile News Message Board | |
| Charts:- Daily , Weekly | |
| Add WD to Watchlist: View: Get Complete WD Trend Analysis ➞ | |
 | CADE Cadence Bank |
| Sector: Financials | |
| SubSector: Banks - Regional | |
| MarketCap: 6901.82 Millions | |
| Recent Price: 37.64 Smart Investing & Trading Score: 80 | |
| Day Percent Change: -0.25% Day Change: -0.09 | |
| Week Change: -2.48% Year-to-date Change: 4.5% | |
| CADE Links: Profile News Message Board | |
| Charts:- Daily , Weekly | |
| Add CADE to Watchlist: View: Get Complete CADE Trend Analysis ➞ | |
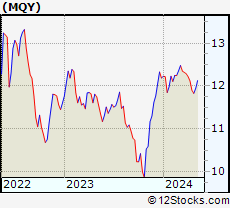 | MQY BlackRock MuniYield Quality Fund Inc |
| Sector: Financials | |
| SubSector: Closed-End Fund - Debt | |
| MarketCap: 803.82 Millions | |
| Recent Price: 11.07 Smart Investing & Trading Score: 90 | |
| Day Percent Change: -0.46% Day Change: -0.05 | |
| Week Change: -2.51% Year-to-date Change: -2.3% | |
| MQY Links: Profile News Message Board | |
| Charts:- Daily , Weekly | |
| Add MQY to Watchlist: View: Get Complete MQY Trend Analysis ➞ | |
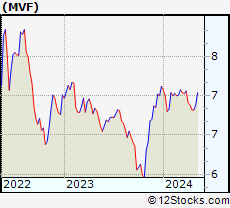 | MVF BlackRock MuniVest Fund, Inc |
| Sector: Financials | |
| SubSector: Closed-End Fund - Debt | |
| MarketCap: 395.18 Millions | |
| Recent Price: 6.61 Smart Investing & Trading Score: 90 | |
| Day Percent Change: -0.46% Day Change: -0.03 | |
| Week Change: -2.54% Year-to-date Change: -3.8% | |
| MVF Links: Profile News Message Board | |
| Charts:- Daily , Weekly | |
| Add MVF to Watchlist: View: Get Complete MVF Trend Analysis ➞ | |
 | NFBK Northfield Bancorp Inc |
| Sector: Financials | |
| SubSector: Banks - Regional | |
| MarketCap: 498.38 Millions | |
| Recent Price: 11.85 Smart Investing & Trading Score: 80 | |
| Day Percent Change: -0.81% Day Change: -0.09 | |
| Week Change: -2.55% Year-to-date Change: -1.2% | |
| NFBK Links: Profile News Message Board | |
| Charts:- Daily , Weekly | |
| Add NFBK to Watchlist: View: Get Complete NFBK Trend Analysis ➞ | |
 | KW Kennedy-Wilson Holdings Inc |
| Sector: Financials | |
| SubSector: Real Estate Services | |
| MarketCap: 1209.38 Millions | |
| Recent Price: 8.80 Smart Investing & Trading Score: 90 | |
| Day Percent Change: -1.48% Day Change: -0.12 | |
| Week Change: -2.56% Year-to-date Change: -17.4% | |
| KW Links: Profile News Message Board | |
| Charts:- Daily , Weekly | |
| Add KW to Watchlist: View: Get Complete KW Trend Analysis ➞ | |
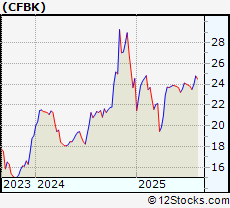 | CFBK CF Bankshares Inc |
| Sector: Financials | |
| SubSector: Banks - Regional | |
| MarketCap: 159.51 Millions | |
| Recent Price: 24.60 Smart Investing & Trading Score: 80 | |
| Day Percent Change: 0% Day Change: 0 | |
| Week Change: -2.57% Year-to-date Change: -3.9% | |
| CFBK Links: Profile News Message Board | |
| Charts:- Daily , Weekly | |
| Add CFBK to Watchlist: View: Get Complete CFBK Trend Analysis ➞ | |
 | AUB Atlantic Union Bankshares Corp |
| Sector: Financials | |
| SubSector: Banks - Regional | |
| MarketCap: 5094.77 Millions | |
| Recent Price: 35.73 Smart Investing & Trading Score: 90 | |
| Day Percent Change: -0.98% Day Change: -0.33 | |
| Week Change: -2.57% Year-to-date Change: -9.2% | |
| AUB Links: Profile News Message Board | |
| Charts:- Daily , Weekly | |
| Add AUB to Watchlist: View: Get Complete AUB Trend Analysis ➞ | |
 | BANR Banner Corp |
| Sector: Financials | |
| SubSector: Banks - Regional | |
| MarketCap: 2339.99 Millions | |
| Recent Price: 67.03 Smart Investing & Trading Score: 80 | |
| Day Percent Change: -0.51% Day Change: -0.33 | |
| Week Change: -2.58% Year-to-date Change: -2.2% | |
| BANR Links: Profile News Message Board | |
| Charts:- Daily , Weekly | |
| Add BANR to Watchlist: View: Get Complete BANR Trend Analysis ➞ | |
 | STT State Street Corp |
| Sector: Financials | |
| SubSector: Asset Management | |
| MarketCap: 32043.4 Millions | |
| Recent Price: 112.49 Smart Investing & Trading Score: 50 | |
| Day Percent Change: -1.38% Day Change: -1.57 | |
| Week Change: -2.59% Year-to-date Change: 12.5% | |
| STT Links: Profile News Message Board | |
| Charts:- Daily , Weekly | |
| Add STT to Watchlist: View: Get Complete STT Trend Analysis ➞ | |
 | AMTB Amerant Bancorp Inc |
| Sector: Financials | |
| SubSector: Banks - Regional | |
| MarketCap: 888.43 Millions | |
| Recent Price: 21.50 Smart Investing & Trading Score: 60 | |
| Day Percent Change: -0.84% Day Change: -0.17 | |
| Week Change: -2.59% Year-to-date Change: -10.2% | |
| AMTB Links: Profile News Message Board | |
| Charts:- Daily , Weekly | |
| Add AMTB to Watchlist: View: Get Complete AMTB Trend Analysis ➞ | |
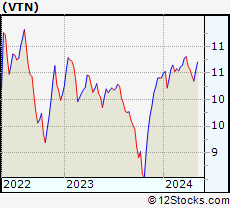 | VTN Invesco Trust For Investment Grade New York Municipals |
| Sector: Financials | |
| SubSector: Closed-End Fund - Debt | |
| MarketCap: 149.3 Millions | |
| Recent Price: 10.12 Smart Investing & Trading Score: 40 | |
| Day Percent Change: -0.59% Day Change: -0.06 | |
| Week Change: -2.59% Year-to-date Change: 1.5% | |
| VTN Links: Profile News Message Board | |
| Charts:- Daily , Weekly | |
| Add VTN to Watchlist: View: Get Complete VTN Trend Analysis ➞ | |
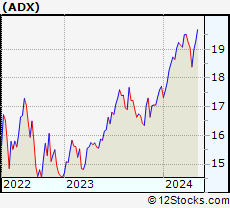 | ADX Adams Diversified Equity Fund |
| Sector: Financials | |
| SubSector: Closed-End Fund - Equity | |
| MarketCap: 2615.12 Millions | |
| Recent Price: 21.69 Smart Investing & Trading Score: 50 | |
| Day Percent Change: -0.74% Day Change: -0.16 | |
| Week Change: -2.64% Year-to-date Change: 13.3% | |
| ADX Links: Profile News Message Board | |
| Charts:- Daily , Weekly | |
| Add ADX to Watchlist: View: Get Complete ADX Trend Analysis ➞ | |
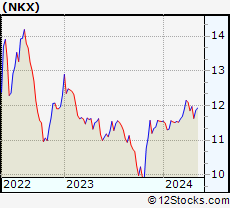 | NKX Nuveen California AMT-Free Quality Municipal Income Fund |
| Sector: Financials | |
| SubSector: Closed-End Fund - Debt | |
| MarketCap: 573.72 Millions | |
| Recent Price: 11.82 Smart Investing & Trading Score: 90 | |
| Day Percent Change: 0.17% Day Change: 0.02 | |
| Week Change: -2.65% Year-to-date Change: -2.9% | |
| NKX Links: Profile News Message Board | |
| Charts:- Daily , Weekly | |
| Add NKX to Watchlist: View: Get Complete NKX Trend Analysis ➞ | |
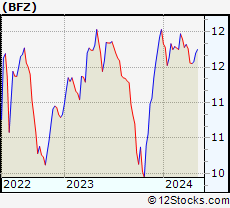 | BFZ BlackRock California Municipal Income Trust |
| Sector: Financials | |
| SubSector: Closed-End Fund - Debt | |
| MarketCap: 318.67 Millions | |
| Recent Price: 10.43 Smart Investing & Trading Score: 80 | |
| Day Percent Change: -0.39% Day Change: -0.04 | |
| Week Change: -2.65% Year-to-date Change: -4.8% | |
| BFZ Links: Profile News Message Board | |
| Charts:- Daily , Weekly | |
| Add BFZ to Watchlist: View: Get Complete BFZ Trend Analysis ➞ | |
 | MOFG MidWestOne Financial Group Inc |
| Sector: Financials | |
| SubSector: Banks - Regional | |
| MarketCap: 617.67 Millions | |
| Recent Price: 30.24 Smart Investing & Trading Score: 40 | |
| Day Percent Change: -0.14% Day Change: -0.04 | |
| Week Change: -2.66% Year-to-date Change: -0.4% | |
| MOFG Links: Profile News Message Board | |
| Charts:- Daily , Weekly | |
| Add MOFG to Watchlist: View: Get Complete MOFG Trend Analysis ➞ | |
 | AMRK A-Mark Precious Metals Inc |
| Sector: Financials | |
| SubSector: Capital Markets | |
| MarketCap: 587.05 Millions | |
| Recent Price: 23.41 Smart Investing & Trading Score: 90 | |
| Day Percent Change: -0.83% Day Change: -0.19 | |
| Week Change: -2.67% Year-to-date Change: -15.4% | |
| AMRK Links: Profile News Message Board | |
| Charts:- Daily , Weekly | |
| Add AMRK to Watchlist: View: Get Complete AMRK Trend Analysis ➞ | |
 | EVR Evercore Inc |
| Sector: Financials | |
| SubSector: Capital Markets | |
| MarketCap: 12303.9 Millions | |
| Recent Price: 321.55 Smart Investing & Trading Score: 50 | |
| Day Percent Change: 0.16% Day Change: 0.5 | |
| Week Change: -2.68% Year-to-date Change: 10.8% | |
| EVR Links: Profile News Message Board | |
| Charts:- Daily , Weekly | |
| Add EVR to Watchlist: View: Get Complete EVR Trend Analysis ➞ | |
| For tabular summary view of above stock list: Summary View ➞ 0 - 25 , 25 - 50 , 50 - 75 , 75 - 100 , 100 - 125 , 125 - 150 , 150 - 175 , 175 - 200 , 200 - 225 , 225 - 250 , 250 - 275 , 275 - 300 , 300 - 325 , 325 - 350 , 350 - 375 , 375 - 400 , 400 - 425 , 425 - 450 , 450 - 475 , 475 - 500 , 500 - 525 , 525 - 550 , 550 - 575 , 575 - 600 , 600 - 625 , 625 - 650 , 650 - 675 , 675 - 700 , 700 - 725 , 725 - 750 , 750 - 775 , 775 - 800 , 800 - 825 , 825 - 850 , 850 - 875 , 875 - 900 , 900 - 925 , 925 - 950 , 950 - 975 , 975 - 1000 , 1000 - 1025 , 1025 - 1050 , 1050 - 1075 , 1075 - 1100 | ||
| Click To Change The Sort Order: By Market Cap or Company Size Performance: Year-to-date, Week and Day | |
| Select Chart Type: | ||
|
Best Stocks Today 12Stocks.com |
© 2025 12Stocks.com Terms & Conditions Privacy Contact Us
All Information Provided Only For Education And Not To Be Used For Investing or Trading. See Terms & Conditions


One More Thing ... Get Best Stocks Delivered Daily!
Never Ever Miss A Move With Our Top Ten Stocks Lists
Find Best Stocks In Any Market - Bull or Bear Market
Take A Peek At Our Top Ten Stocks Lists: Daily, Weekly, Year-to-Date & Top Trends
Find Best Stocks In Any Market - Bull or Bear Market
Take A Peek At Our Top Ten Stocks Lists: Daily, Weekly, Year-to-Date & Top Trends
Financial Stocks With Best Up Trends [0-bearish to 100-bullish]: Compass [100], Western Union[100], Whitestone REIT[100], Healthcare Realty[100], Public Storage[100], Alexandria Real[100], Omega Healthcare[100], LendingTree [100], Federal Realty[100], OFS Capital[100], BXP [100]
Best Financial Stocks Year-to-Date:
ESSA Bancorp[2923.51%], Robinhood Markets[185.29%], Solowin [161.21%], Metalpha Technology[143.48%], IHS Holding[139.04%], Altisource Portfolio[127.41%], Banco Santander[113.19%], Banco Bilbao[102.83%], IREN [99.49%], Grupo Cibest[93.5%], Mr. Cooper[91.06%] Best Financial Stocks This Week:
Plymouth Industrial[40.4%], SelectQuote [30.15%], Altisource Portfolio[24.32%], Seritage Growth[20.21%], MBIA [18.44%], Nu [13.82%], Qudian [11.08%], Cipher Mining[10.9%], Brookfield Business[10.18%], BXP [9.64%], Stratus Properties[8.94%] Best Financial Stocks Daily:
SelectQuote [41.53%], X [15.73%], Altisource Portfolio[9.12%], Aegon [7.64%], UP Fintech[6.65%], FinVolution [5.55%], Hippo [5.47%], Lufax Holding[5.45%], eHealth [4.65%], MarketAxess [4.54%], Yiren Digital[3.6%]