
 Login Sign Up


| |||||
 |  | ||||

| 12Stocks.com Market Intelligence |
Best Financial Stocks
| In a hurry? Financial Stocks Lists: Performance Trends Table, Stock Charts
Sort Financial stocks: Daily, Weekly, Year-to-Date, Market Cap & Trends. Filter Financial stocks list by size:All Financial Large Mid-Range Small & MicroCap |
| 12Stocks.com Financial Stocks Performances & Trends Daily | |||||||||
|
|  The overall Smart Investing & Trading Score is 30 (0-bearish to 100-bullish) which puts Financial sector in short term bearish to neutral trend. The Smart Investing & Trading Score from previous trading session is 100 and a deterioration of trend continues.
| ||||||||
Here are the Smart Investing & Trading Scores of the most requested Financial stocks at 12Stocks.com (click stock name for detailed review):
|


| 12Stocks.com: Investing in Financial sector with Stocks | |
|
The following table helps investors and traders sort through current performance and trends (as measured by Smart Investing & Trading Score) of various
stocks in the Financial sector. Quick View: Move mouse or cursor over stock symbol (ticker) to view short-term Technical chart and over stock name to view long term chart. Click on  to add stock symbol to your watchlist and to add stock symbol to your watchlist and  to view watchlist. Click on any ticker or stock name for detailed market intelligence report for that stock. to view watchlist. Click on any ticker or stock name for detailed market intelligence report for that stock. |
12Stocks.com Performance of Stocks in Financial Sector
| Ticker | Stock Name | Watchlist | Category | Recent Price | Smart Investing & Trading Score | Change % | Weekly Change% |
| AON | Aon |   | Insurance | 368.32 | 40 | -1.38% | -1.81% |
| FAF | First American | | Insurance - Specialty | 66.00 | 100 | -0.05% | -1.81% |
| FFIN | First | | Banks - Regional | 37.17 | 50 | 0.08% | -1.81% |
| BLE | BlackRock Municipal | | Closed-End Fund - Debt | 9.96 | 100 | -0.31% | -1.81% |
| BTZ | BlackRock Credit | | Closed-End Fund - Debt | 11.00 | 70 | -0.46% | -1.81% |
| PFG | Pripal | | Asset Mgmt | 79.25 | 80 | -2.52% | -1.82% |
| FNF | Fidelity National | | Insurance - Specialty | 59.87 | 90 | 0.15% | -1.82% |
| CUBI | Customers Bancorp | | Banks - Regional | 71.69 | 40 | -0.52% | -1.82% |
| ATLO | Ames National | | Banks - Regional | 19.98 | 100 | -1.66% | -1.82% |
| PMO | Putnam Municipal | | Closed-End Fund - Debt | 9.91 | 100 | -0.46% | -1.82% |
| FHB | First Hawaiian | | Banks - Regional | 25.95 | 60 | 0.00% | -1.83% |
| NRO | Neuberger Berman | | Closed-End Fund - Equity | 3.27 | 90 | -0.31% | -1.83% |
| BCBP | BCB Bancorp | | Banks - Regional | 8.90 | 50 | -1.61% | -1.84% |
| CAC | Camden National | | Banks - Regional | 40.89 | 70 | 0.10% | -1.85% |
| MIN | MFS Intermediate | | Closed-End Fund - Debt | 2.69 | 70 | -0.75% | -1.85% |
| FISI | Institutions | | Banks - Regional | 27.67 | 70 | -0.19% | -1.86% |
| AFL | Aflac | | Insurance - Life | 106.43 | 70 | -1.95% | -1.87% |
| TCBK | Trico Bancshares | | Banks - Regional | 45.42 | 60 | -0.56% | -1.87% |
| OCFC | OceanFirst | | Banks - Regional | 18.39 | 80 | -0.75% | -1.88% |
| MYD | BlackRock MuniYield | | Closed-End Fund - Debt | 10.06 | 100 | -0.20% | -1.88% |
| TCBX | Third Coast | | Banks - Regional | 39.83 | 61 | -0.61% | -1.88% |
| CBU | Community | | Banks - Regional | 59.89 | 80 | 0.11% | -1.89% |
| TRMK | Trustmark Corp | | Banks - Regional | 40.27 | 80 | -0.34% | -1.89% |
| FIBK | First Interstate | | Banks - Regional | 32.72 | 80 | -0.63% | -1.89% |
| MGYR | Magyar Bancorp | | Banks - Regional | 17.19 | 20 | -0.69% | -1.89% |
| For chart view version of above stock list: Chart View ➞ 0 - 25 , 25 - 50 , 50 - 75 , 75 - 100 , 100 - 125 , 125 - 150 , 150 - 175 , 175 - 200 , 200 - 225 , 225 - 250 , 250 - 275 , 275 - 300 , 300 - 325 , 325 - 350 , 350 - 375 , 375 - 400 , 400 - 425 , 425 - 450 , 450 - 475 , 475 - 500 , 500 - 525 , 525 - 550 , 550 - 575 , 575 - 600 , 600 - 625 , 625 - 650 , 650 - 675 , 675 - 700 , 700 - 725 , 725 - 750 , 750 - 775 , 775 - 800 , 800 - 825 , 825 - 850 , 850 - 875 , 875 - 900 , 900 - 925 , 925 - 950 , 950 - 975 , 975 - 1000 , 1000 - 1025 , 1025 - 1050 , 1050 - 1075 , 1075 - 1100 | ||
 | Click To Change The Sort Order: By Market Cap or Company Size Performance: Year-to-date, Week and Day |  |
|
Get the most comprehensive stock market coverage daily at 12Stocks.com ➞ Best Stocks Today ➞ Best Stocks Weekly ➞ Best Stocks Year-to-Date ➞ Best Stocks Trends ➞  Best Stocks Today 12Stocks.com Best Nasdaq Stocks ➞ Best S&P 500 Stocks ➞ Best Tech Stocks ➞ Best Biotech Stocks ➞ |
| Detailed Overview of Financial Stocks |
| Financial Technical Overview, Leaders & Laggards, Top Financial ETF Funds & Detailed Financial Stocks List, Charts, Trends & More |
| Financial Sector: Technical Analysis, Trends & YTD Performance | |
| Financial sector is composed of stocks
from banks, brokers, insurance, REITs
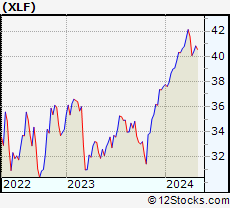
and services subsectors. Financial sector, as represented by XLF, an exchange-traded fund [ETF] that holds basket of Financial stocks (e.g, Bank of America, Goldman Sachs) is up by 3.84% and is currently underperforming the overall market by -3.88% year-to-date. Below is a quick view of Technical charts and trends: |
|
 XLF Weekly Chart |
|
| Long Term Trend: Good | |
| Medium Term Trend: Good | |
 XLF Daily Chart |
|
| Short Term Trend: Not Good | |
| Overall Trend Score: 30 | |
| YTD Performance: 3.84% | |
| **Trend Scores & Views Are Only For Educational Purposes And Not For Investing | |
| 12Stocks.com: Top Performing Financial Sector Stocks | ||||||||||||||||||||||||||||||||||||||||||||||||
 The top performing Financial sector stocks year to date are
Now, more recently, over last week, the top performing Financial sector stocks on the move are


|
||||||||||||||||||||||||||||||||||||||||||||||||
| 12Stocks.com: Investing in Financial Sector using Exchange Traded Funds | |
|
The following table shows list of key exchange traded funds (ETF) that
help investors track Financial Index. For detailed view, check out our ETF Funds section of our website. Quick View: Move mouse or cursor over ETF symbol (ticker) to view short-term Technical chart and over ETF name to view long term chart. Click on ticker or stock name for detailed view. Click on to add stock symbol to your watchlist and to view watchlist. |
12Stocks.com List of ETFs that track Financial Index
| Ticker | ETF Name | Watchlist | Recent Price | Smart Investing & Trading Score | Change % | Week % | Year-to-date % |
| 12Stocks.com: Charts, Trends, Fundamental Data and Performances of Financial Stocks | |
|
We now take in-depth look at all Financial stocks including charts, multi-period performances and overall trends (as measured by Smart Investing & Trading Score). One can sort Financial stocks (click link to choose) by Daily, Weekly and by Year-to-Date performances. Also, one can sort by size of the company or by market capitalization. |
| Select Your Default Chart Type: | |||||
| |||||
| Click on stock symbol or name for detailed view. Click on to add stock symbol to your watchlist and to view watchlist. Quick View: Move mouse or cursor over "Daily" to quickly view daily Technical stock chart and over "Weekly" to view weekly Technical stock chart. | |||||

 | AON Aon plc |
| Sector: Financials | |
| SubSector: Insurance Brokers | |
| MarketCap: 79898.3 Millions | |
| Recent Price: 368.32 Smart Investing & Trading Score: 40 | |
| Day Percent Change: -1.38% Day Change: -5.17 | |
| Week Change: -1.81% Year-to-date Change: -0.1% | |
| AON Links: Profile News Message Board | |
| Charts:- Daily , Weekly | |
| Add AON to Watchlist: View: Get Complete AON Trend Analysis ➞ | |
 | FAF First American Financial Corp |
| Sector: Financials | |
| SubSector: Insurance - Specialty | |
| MarketCap: 6826.71 Millions | |
| Recent Price: 66.00 Smart Investing & Trading Score: 100 | |
| Day Percent Change: -0.05% Day Change: -0.03 | |
| Week Change: -1.81% Year-to-date Change: 5.5% | |
| FAF Links: Profile News Message Board | |
| Charts:- Daily , Weekly | |
| Add FAF to Watchlist: View: Get Complete FAF Trend Analysis ➞ | |
 | FFIN First Financial Bankshares, Inc |
| Sector: Financials | |
| SubSector: Banks - Regional | |
| MarketCap: 5256.2 Millions | |
| Recent Price: 37.17 Smart Investing & Trading Score: 50 | |
| Day Percent Change: 0.08% Day Change: 0.03 | |
| Week Change: -1.81% Year-to-date Change: 0.3% | |
| FFIN Links: Profile News Message Board | |
| Charts:- Daily , Weekly | |
| Add FFIN to Watchlist: View: Get Complete FFIN Trend Analysis ➞ | |
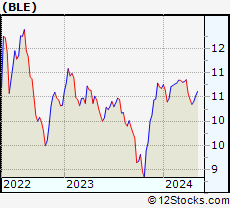 | BLE BlackRock Municipal Income Trust II |
| Sector: Financials | |
| SubSector: Closed-End Fund - Debt | |
| MarketCap: 478.23 Millions | |
| Recent Price: 9.96 Smart Investing & Trading Score: 100 | |
| Day Percent Change: -0.31% Day Change: -0.03 | |
| Week Change: -1.81% Year-to-date Change: -3.4% | |
| BLE Links: Profile News Message Board | |
| Charts:- Daily , Weekly | |
| Add BLE to Watchlist: View: Get Complete BLE Trend Analysis ➞ | |
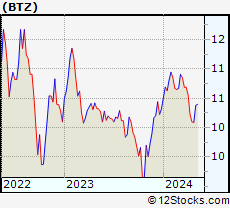 | BTZ BlackRock Credit Allocation Income Trust |
| Sector: Financials | |
| SubSector: Closed-End Fund - Debt | |
| MarketCap: 1033.1 Millions | |
| Recent Price: 11.00 Smart Investing & Trading Score: 70 | |
| Day Percent Change: -0.46% Day Change: -0.05 | |
| Week Change: -1.81% Year-to-date Change: 9.6% | |
| BTZ Links: Profile News Message Board | |
| Charts:- Daily , Weekly | |
| Add BTZ to Watchlist: View: Get Complete BTZ Trend Analysis ➞ | |
 | PFG Principal Financial Group Inc |
| Sector: Financials | |
| SubSector: Asset Management | |
| MarketCap: 17817 Millions | |
| Recent Price: 79.25 Smart Investing & Trading Score: 80 | |
| Day Percent Change: -2.52% Day Change: -2.05 | |
| Week Change: -1.82% Year-to-date Change: -2.1% | |
| PFG Links: Profile News Message Board | |
| Charts:- Daily , Weekly | |
| Add PFG to Watchlist: View: Get Complete PFG Trend Analysis ➞ | |
 | FNF Fidelity National Financial Inc |
| Sector: Financials | |
| SubSector: Insurance - Specialty | |
| MarketCap: 16458.2 Millions | |
| Recent Price: 59.87 Smart Investing & Trading Score: 90 | |
| Day Percent Change: 0.15% Day Change: 0.09 | |
| Week Change: -1.82% Year-to-date Change: 7.5% | |
| FNF Links: Profile News Message Board | |
| Charts:- Daily , Weekly | |
| Add FNF to Watchlist: View: Get Complete FNF Trend Analysis ➞ | |
 | CUBI Customers Bancorp Inc |
| Sector: Financials | |
| SubSector: Banks - Regional | |
| MarketCap: 2128.6 Millions | |
| Recent Price: 71.69 Smart Investing & Trading Score: 40 | |
| Day Percent Change: -0.52% Day Change: -0.34 | |
| Week Change: -1.82% Year-to-date Change: 34.5% | |
| CUBI Links: Profile News Message Board | |
| Charts:- Daily , Weekly | |
| Add CUBI to Watchlist: View: Get Complete CUBI Trend Analysis ➞ | |
 | ATLO Ames National Corp |
| Sector: Financials | |
| SubSector: Banks - Regional | |
| MarketCap: 179.4 Millions | |
| Recent Price: 19.98 Smart Investing & Trading Score: 100 | |
| Day Percent Change: -1.66% Day Change: -0.32 | |
| Week Change: -1.82% Year-to-date Change: 17.8% | |
| ATLO Links: Profile News Message Board | |
| Charts:- Daily , Weekly | |
| Add ATLO to Watchlist: View: Get Complete ATLO Trend Analysis ➞ | |
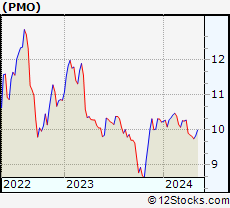 | PMO Putnam Municipal Opportunities Trust |
| Sector: Financials | |
| SubSector: Closed-End Fund - Debt | |
| MarketCap: 281.14 Millions | |
| Recent Price: 9.91 Smart Investing & Trading Score: 100 | |
| Day Percent Change: -0.46% Day Change: -0.05 | |
| Week Change: -1.82% Year-to-date Change: -1.5% | |
| PMO Links: Profile News Message Board | |
| Charts:- Daily , Weekly | |
| Add PMO to Watchlist: View: Get Complete PMO Trend Analysis ➞ | |
 | FHB First Hawaiian INC |
| Sector: Financials | |
| SubSector: Banks - Regional | |
| MarketCap: 3206.67 Millions | |
| Recent Price: 25.95 Smart Investing & Trading Score: 60 | |
| Day Percent Change: 0% Day Change: 0 | |
| Week Change: -1.83% Year-to-date Change: -3.2% | |
| FHB Links: Profile News Message Board | |
| Charts:- Daily , Weekly | |
| Add FHB to Watchlist: View: Get Complete FHB Trend Analysis ➞ | |
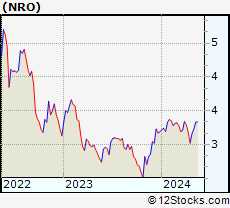 | NRO Neuberger Berman Real Estate Securities Income Fund Inc |
| Sector: Financials | |
| SubSector: Closed-End Fund - Equity | |
| MarketCap: 207.83 Millions | |
| Recent Price: 3.27 Smart Investing & Trading Score: 90 | |
| Day Percent Change: -0.31% Day Change: -0.01 | |
| Week Change: -1.83% Year-to-date Change: 1.4% | |
| NRO Links: Profile News Message Board | |
| Charts:- Daily , Weekly | |
| Add NRO to Watchlist: View: Get Complete NRO Trend Analysis ➞ | |
 | BCBP BCB Bancorp Inc (NJ) |
| Sector: Financials | |
| SubSector: Banks - Regional | |
| MarketCap: 150.28 Millions | |
| Recent Price: 8.90 Smart Investing & Trading Score: 50 | |
| Day Percent Change: -1.61% Day Change: -0.14 | |
| Week Change: -1.84% Year-to-date Change: -23.9% | |
| BCBP Links: Profile News Message Board | |
| Charts:- Daily , Weekly | |
| Add BCBP to Watchlist: View: Get Complete BCBP Trend Analysis ➞ | |
 | CAC Camden National Corp |
| Sector: Financials | |
| SubSector: Banks - Regional | |
| MarketCap: 686.29 Millions | |
| Recent Price: 40.89 Smart Investing & Trading Score: 70 | |
| Day Percent Change: 0.1% Day Change: 0.04 | |
| Week Change: -1.85% Year-to-date Change: -6.6% | |
| CAC Links: Profile News Message Board | |
| Charts:- Daily , Weekly | |
| Add CAC to Watchlist: View: Get Complete CAC Trend Analysis ➞ | |
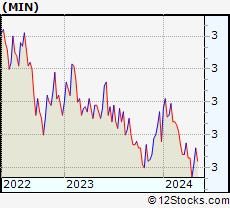 | MIN MFS Intermediate Income Trust |
| Sector: Financials | |
| SubSector: Closed-End Fund - Debt | |
| MarketCap: 307.26 Millions | |
| Recent Price: 2.69 Smart Investing & Trading Score: 70 | |
| Day Percent Change: -0.75% Day Change: -0.02 | |
| Week Change: -1.85% Year-to-date Change: 5.1% | |
| MIN Links: Profile News Message Board | |
| Charts:- Daily , Weekly | |
| Add MIN to Watchlist: View: Get Complete MIN Trend Analysis ➞ | |
 | FISI Financial Institutions Inc |
| Sector: Financials | |
| SubSector: Banks - Regional | |
| MarketCap: 552.56 Millions | |
| Recent Price: 27.67 Smart Investing & Trading Score: 70 | |
| Day Percent Change: -0.19% Day Change: -0.05 | |
| Week Change: -1.86% Year-to-date Change: -2.8% | |
| FISI Links: Profile News Message Board | |
| Charts:- Daily , Weekly | |
| Add FISI to Watchlist: View: Get Complete FISI Trend Analysis ➞ | |
 | AFL Aflac Inc |
| Sector: Financials | |
| SubSector: Insurance - Life | |
| MarketCap: 57189.5 Millions | |
| Recent Price: 106.43 Smart Investing & Trading Score: 70 | |
| Day Percent Change: -1.95% Day Change: -2.12 | |
| Week Change: -1.87% Year-to-date Change: 0.2% | |
| AFL Links: Profile News Message Board | |
| Charts:- Daily , Weekly | |
| Add AFL to Watchlist: View: Get Complete AFL Trend Analysis ➞ | |
 | TCBK Trico Bancshares |
| Sector: Financials | |
| SubSector: Banks - Regional | |
| MarketCap: 1469.06 Millions | |
| Recent Price: 45.42 Smart Investing & Trading Score: 60 | |
| Day Percent Change: -0.56% Day Change: -0.24 | |
| Week Change: -1.87% Year-to-date Change: -1.1% | |
| TCBK Links: Profile News Message Board | |
| Charts:- Daily , Weekly | |
| Add TCBK to Watchlist: View: Get Complete TCBK Trend Analysis ➞ | |
 | OCFC OceanFirst Financial Corp |
| Sector: Financials | |
| SubSector: Banks - Regional | |
| MarketCap: 1052.45 Millions | |
| Recent Price: 18.39 Smart Investing & Trading Score: 80 | |
| Day Percent Change: -0.75% Day Change: -0.13 | |
| Week Change: -1.88% Year-to-date Change: -1.6% | |
| OCFC Links: Profile News Message Board | |
| Charts:- Daily , Weekly | |
| Add OCFC to Watchlist: View: Get Complete OCFC Trend Analysis ➞ | |
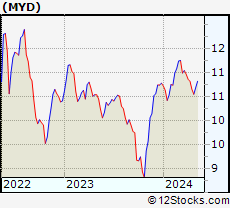 | MYD BlackRock MuniYield Fund Inc |
| Sector: Financials | |
| SubSector: Closed-End Fund - Debt | |
| MarketCap: 467.85 Millions | |
| Recent Price: 10.06 Smart Investing & Trading Score: 100 | |
| Day Percent Change: -0.2% Day Change: -0.02 | |
| Week Change: -1.88% Year-to-date Change: -0.9% | |
| MYD Links: Profile News Message Board | |
| Charts:- Daily , Weekly | |
| Add MYD to Watchlist: View: Get Complete MYD Trend Analysis ➞ | |
 | TCBX Third Coast Bancshares Inc |
| Sector: Financials | |
| SubSector: Banks - Regional | |
| MarketCap: 554.17 Millions | |
| Recent Price: 39.83 Smart Investing & Trading Score: 61 | |
| Day Percent Change: -0.61% Day Change: -0.23 | |
| Week Change: -1.88% Year-to-date Change: 13.0% | |
| TCBX Links: Profile News Message Board | |
| Charts:- Daily , Weekly | |
| Add TCBX to Watchlist: View: Get Complete TCBX Trend Analysis ➞ | |
 | CBU Community Financial System Inc |
| Sector: Financials | |
| SubSector: Banks - Regional | |
| MarketCap: 3167.2 Millions | |
| Recent Price: 59.89 Smart Investing & Trading Score: 80 | |
| Day Percent Change: 0.11% Day Change: 0.06 | |
| Week Change: -1.89% Year-to-date Change: -5.7% | |
| CBU Links: Profile News Message Board | |
| Charts:- Daily , Weekly | |
| Add CBU to Watchlist: View: Get Complete CBU Trend Analysis ➞ | |
 | TRMK Trustmark Corp |
| Sector: Financials | |
| SubSector: Banks - Regional | |
| MarketCap: 2429.75 Millions | |
| Recent Price: 40.27 Smart Investing & Trading Score: 80 | |
| Day Percent Change: -0.34% Day Change: -0.13 | |
| Week Change: -1.89% Year-to-date Change: 10.0% | |
| TRMK Links: Profile News Message Board | |
| Charts:- Daily , Weekly | |
| Add TRMK to Watchlist: View: Get Complete TRMK Trend Analysis ➞ | |
 | FIBK First Interstate BancSystem Inc |
| Sector: Financials | |
| SubSector: Banks - Regional | |
| MarketCap: 3413.09 Millions | |
| Recent Price: 32.72 Smart Investing & Trading Score: 80 | |
| Day Percent Change: -0.63% Day Change: -0.19 | |
| Week Change: -1.89% Year-to-date Change: -3.0% | |
| FIBK Links: Profile News Message Board | |
| Charts:- Daily , Weekly | |
| Add FIBK to Watchlist: View: Get Complete FIBK Trend Analysis ➞ | |
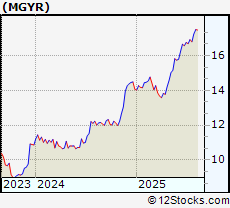 | MGYR Magyar Bancorp Inc |
| Sector: Financials | |
| SubSector: Banks - Regional | |
| MarketCap: 111.6 Millions | |
| Recent Price: 17.19 Smart Investing & Trading Score: 20 | |
| Day Percent Change: -0.69% Day Change: -0.12 | |
| Week Change: -1.89% Year-to-date Change: 19.0% | |
| MGYR Links: Profile News Message Board | |
| Charts:- Daily , Weekly | |
| Add MGYR to Watchlist: View: Get Complete MGYR Trend Analysis ➞ | |
| For tabular summary view of above stock list: Summary View ➞ 0 - 25 , 25 - 50 , 50 - 75 , 75 - 100 , 100 - 125 , 125 - 150 , 150 - 175 , 175 - 200 , 200 - 225 , 225 - 250 , 250 - 275 , 275 - 300 , 300 - 325 , 325 - 350 , 350 - 375 , 375 - 400 , 400 - 425 , 425 - 450 , 450 - 475 , 475 - 500 , 500 - 525 , 525 - 550 , 550 - 575 , 575 - 600 , 600 - 625 , 625 - 650 , 650 - 675 , 675 - 700 , 700 - 725 , 725 - 750 , 750 - 775 , 775 - 800 , 800 - 825 , 825 - 850 , 850 - 875 , 875 - 900 , 900 - 925 , 925 - 950 , 950 - 975 , 975 - 1000 , 1000 - 1025 , 1025 - 1050 , 1050 - 1075 , 1075 - 1100 | ||
| Click To Change The Sort Order: By Market Cap or Company Size Performance: Year-to-date, Week and Day | |
| Select Chart Type: | ||
|
Best Stocks Today 12Stocks.com |
© 2025 12Stocks.com Terms & Conditions Privacy Contact Us
All Information Provided Only For Education And Not To Be Used For Investing or Trading. See Terms & Conditions


One More Thing ... Get Best Stocks Delivered Daily!
Never Ever Miss A Move With Our Top Ten Stocks Lists
Find Best Stocks In Any Market - Bull or Bear Market
Take A Peek At Our Top Ten Stocks Lists: Daily, Weekly, Year-to-Date & Top Trends
Find Best Stocks In Any Market - Bull or Bear Market
Take A Peek At Our Top Ten Stocks Lists: Daily, Weekly, Year-to-Date & Top Trends
Financial Stocks With Best Up Trends [0-bearish to 100-bullish]: Compass [100], Western Union[100], Whitestone REIT[100], Healthcare Realty[100], Public Storage[100], Alexandria Real[100], Omega Healthcare[100], LendingTree [100], Federal Realty[100], OFS Capital[100], BXP [100]
Best Financial Stocks Year-to-Date:
ESSA Bancorp[2923.51%], Robinhood Markets[185.29%], Solowin [161.21%], Metalpha Technology[143.48%], IHS Holding[139.04%], Altisource Portfolio[127.41%], Banco Santander[113.19%], Banco Bilbao[102.83%], IREN [99.49%], Grupo Cibest[93.5%], Mr. Cooper[91.06%] Best Financial Stocks This Week:
Plymouth Industrial[40.4%], SelectQuote [30.15%], Altisource Portfolio[24.32%], Seritage Growth[20.21%], MBIA [18.44%], Nu [13.82%], Qudian [11.08%], Cipher Mining[10.9%], Brookfield Business[10.18%], BXP [9.64%], Stratus Properties[8.94%] Best Financial Stocks Daily:
SelectQuote [41.53%], X [15.73%], Altisource Portfolio[9.12%], Aegon [7.64%], UP Fintech[6.65%], FinVolution [5.55%], Hippo [5.47%], Lufax Holding[5.45%], eHealth [4.65%], MarketAxess [4.54%], Yiren Digital[3.6%]