
 Login Sign Up


| |||||
 |  | ||||

| 12Stocks.com Market Intelligence |
Best Financial Stocks
| In a hurry? Financial Stocks Lists: Performance Trends Table, Stock Charts
Sort Financial stocks: Daily, Weekly, Year-to-Date, Market Cap & Trends. Filter Financial stocks list by size:All Financial Large Mid-Range Small & MicroCap |
| 12Stocks.com Financial Stocks Performances & Trends Daily | |||||||||
|
|  The overall Smart Investing & Trading Score is 30 (0-bearish to 100-bullish) which puts Financial sector in short term bearish to neutral trend. The Smart Investing & Trading Score from previous trading session is 100 and a deterioration of trend continues.
| ||||||||
Here are the Smart Investing & Trading Scores of the most requested Financial stocks at 12Stocks.com (click stock name for detailed review):
|


| 12Stocks.com: Investing in Financial sector with Stocks | |
|
The following table helps investors and traders sort through current performance and trends (as measured by Smart Investing & Trading Score) of various
stocks in the Financial sector. Quick View: Move mouse or cursor over stock symbol (ticker) to view short-term Technical chart and over stock name to view long term chart. Click on  to add stock symbol to your watchlist and to add stock symbol to your watchlist and  to view watchlist. Click on any ticker or stock name for detailed market intelligence report for that stock. to view watchlist. Click on any ticker or stock name for detailed market intelligence report for that stock. |
12Stocks.com Performance of Stocks in Financial Sector
| Ticker | Stock Name | Watchlist | Category | Recent Price | Smart Investing & Trading Score | Change % | Weekly Change% |
| JCE | Nuveen Core |   | Closed-End Fund - Equity | 15.73 | 50 | -0.58% | -1.56% |
| OFG | OFG Bancorp | | Banks - Regional | 44.75 | 90 | -0.49% | -1.57% |
| CSQ | Calamos Strategic | | Closed-End Fund - Debt | 18.62 | 70 | -0.27% | -1.57% |
| EXG | Eaton Vance | | Closed-End Fund - Foreign | 8.93 | 80 | -0.46% | -1.58% |
| NBB | Nuveen Taxable | | Closed-End Fund - Debt | 15.95 | 90 | -0.32% | -1.58% |
| NZF | Nuveen Municipal | | Closed-End Fund - Debt | 11.97 | 100 | 0.17% | -1.59% |
| NAD | Nuveen Quality | | Closed-End Fund - Debt | 11.33 | 100 | 0.09% | -1.59% |
| MYN | BlackRock MuniYield | | Closed-End Fund - Debt | 9.32 | 80 | -0.11% | -1.59% |
| DMB | BNY | | Closed-End Fund - Debt | 10.02 | 100 | -0.60% | -1.59% |
| UMBF | UMB | | Banks - Regional | 121.90 | 100 | -0.49% | -1.60% |
| MCN | XAI Madison | | Closed-End Fund - Equity | 6.32 | 70 | -1.28% | -1.60% |
| FNLC | First Bancorp | | Banks - Regional | 27.18 | 90 | -1.80% | -1.61% |
| CGO | Calamos Global | | Closed-End Fund - Equity | 11.76 | 80 | -0.30% | -1.62% |
| CFFN | Capitol Federal | | Banks - Regional | 6.48 | 90 | -1.31% | -1.63% |
| GNW | Genworth | | Insurance - Life | 8.57 | 70 | -0.71% | -1.64% |
| ROOT | Root | | Insurance - Property & Casualty | 92.22 | 60 | 1.53% | -1.64% |
| NQP | Nuveen Pennsylvania | | Closed-End Fund - Debt | 10.96 | 80 | -0.46% | -1.65% |
| JFR | Nuveen Floating | | Closed-End Fund - Debt | 8.45 | 50 | -0.48% | -1.65% |
| CHW | Calamos Global | | Closed-End Fund - Equity | 7.31 | 60 | -0.14% | -1.65% |
| BKN | BlackRock | | Closed-End Fund - Debt | 10.75 | 100 | -0.36% | -1.65% |
| CHMG | Chemung | | Banks - Regional | 53.92 | 30 | -1.38% | -1.66% |
| UNTY | Unity Bancorp | | Banks - Regional | 52.35 | 60 | -0.16% | -1.66% |
| ETJ | Eaton Vance | | Closed-End Fund - Equity | 8.99 | 70 | 0.23% | -1.66% |
| USA | Liberty All-Star | | Closed-End Fund - Equity | 6.60 | 30 | -1.21% | -1.66% |
| EQIX | Equinix | | REIT - Specialty | 773.36 | 50 | 0.71% | -1.67% |
| For chart view version of above stock list: Chart View ➞ 0 - 25 , 25 - 50 , 50 - 75 , 75 - 100 , 100 - 125 , 125 - 150 , 150 - 175 , 175 - 200 , 200 - 225 , 225 - 250 , 250 - 275 , 275 - 300 , 300 - 325 , 325 - 350 , 350 - 375 , 375 - 400 , 400 - 425 , 425 - 450 , 450 - 475 , 475 - 500 , 500 - 525 , 525 - 550 , 550 - 575 , 575 - 600 , 600 - 625 , 625 - 650 , 650 - 675 , 675 - 700 , 700 - 725 , 725 - 750 , 750 - 775 , 775 - 800 , 800 - 825 , 825 - 850 , 850 - 875 , 875 - 900 , 900 - 925 , 925 - 950 , 950 - 975 , 975 - 1000 , 1000 - 1025 , 1025 - 1050 , 1050 - 1075 , 1075 - 1100 | ||
 | Click To Change The Sort Order: By Market Cap or Company Size Performance: Year-to-date, Week and Day |  |
|
Get the most comprehensive stock market coverage daily at 12Stocks.com ➞ Best Stocks Today ➞ Best Stocks Weekly ➞ Best Stocks Year-to-Date ➞ Best Stocks Trends ➞  Best Stocks Today 12Stocks.com Best Nasdaq Stocks ➞ Best S&P 500 Stocks ➞ Best Tech Stocks ➞ Best Biotech Stocks ➞ |
| Detailed Overview of Financial Stocks |
| Financial Technical Overview, Leaders & Laggards, Top Financial ETF Funds & Detailed Financial Stocks List, Charts, Trends & More |
| Financial Sector: Technical Analysis, Trends & YTD Performance | |
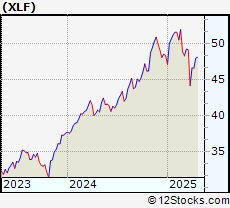
| Financial sector is composed of stocks
from banks, brokers, insurance, REITs
and services subsectors. Financial sector, as represented by XLF, an exchange-traded fund [ETF] that holds basket of Financial stocks (e.g, Bank of America, Goldman Sachs) is up by 3.84% and is currently underperforming the overall market by -3.88% year-to-date. Below is a quick view of Technical charts and trends: |
|
 XLF Weekly Chart |
|
| Long Term Trend: Good | |
| Medium Term Trend: Good | |
 XLF Daily Chart |
|
| Short Term Trend: Not Good | |
| Overall Trend Score: 30 | |
| YTD Performance: 3.84% | |
| **Trend Scores & Views Are Only For Educational Purposes And Not For Investing | |
| 12Stocks.com: Top Performing Financial Sector Stocks | ||||||||||||||||||||||||||||||||||||||||||||||||
 The top performing Financial sector stocks year to date are
Now, more recently, over last week, the top performing Financial sector stocks on the move are


|
||||||||||||||||||||||||||||||||||||||||||||||||
| 12Stocks.com: Investing in Financial Sector using Exchange Traded Funds | |
|
The following table shows list of key exchange traded funds (ETF) that
help investors track Financial Index. For detailed view, check out our ETF Funds section of our website. Quick View: Move mouse or cursor over ETF symbol (ticker) to view short-term Technical chart and over ETF name to view long term chart. Click on ticker or stock name for detailed view. Click on to add stock symbol to your watchlist and to view watchlist. |
12Stocks.com List of ETFs that track Financial Index
| Ticker | ETF Name | Watchlist | Recent Price | Smart Investing & Trading Score | Change % | Week % | Year-to-date % |
| 12Stocks.com: Charts, Trends, Fundamental Data and Performances of Financial Stocks | |
|
We now take in-depth look at all Financial stocks including charts, multi-period performances and overall trends (as measured by Smart Investing & Trading Score). One can sort Financial stocks (click link to choose) by Daily, Weekly and by Year-to-Date performances. Also, one can sort by size of the company or by market capitalization. |
| Select Your Default Chart Type: | |||||
| |||||
| Click on stock symbol or name for detailed view. Click on to add stock symbol to your watchlist and to view watchlist. Quick View: Move mouse or cursor over "Daily" to quickly view daily Technical stock chart and over "Weekly" to view weekly Technical stock chart. | |||||

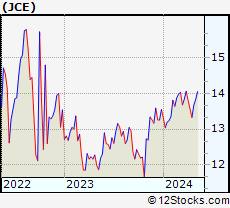 | JCE Nuveen Core Equity Alpha Fund |
| Sector: Financials | |
| SubSector: Closed-End Fund - Equity | |
| MarketCap: 264.96 Millions | |
| Recent Price: 15.73 Smart Investing & Trading Score: 50 | |
| Day Percent Change: -0.58% Day Change: -0.09 | |
| Week Change: -1.56% Year-to-date Change: 1.2% | |
| JCE Links: Profile News Message Board | |
| Charts:- Daily , Weekly | |
| Add JCE to Watchlist: View: Get Complete JCE Trend Analysis ➞ | |
 | OFG OFG Bancorp |
| Sector: Financials | |
| SubSector: Banks - Regional | |
| MarketCap: 1994.46 Millions | |
| Recent Price: 44.75 Smart Investing & Trading Score: 90 | |
| Day Percent Change: -0.49% Day Change: -0.21 | |
| Week Change: -1.57% Year-to-date Change: 2.5% | |
| OFG Links: Profile News Message Board | |
| Charts:- Daily , Weekly | |
| Add OFG to Watchlist: View: Get Complete OFG Trend Analysis ➞ | |
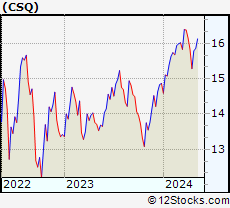 | CSQ Calamos Strategic Total Return Fund |
| Sector: Financials | |
| SubSector: Closed-End Fund - Debt | |
| MarketCap: 2984.48 Millions | |
| Recent Price: 18.62 Smart Investing & Trading Score: 70 | |
| Day Percent Change: -0.27% Day Change: -0.05 | |
| Week Change: -1.57% Year-to-date Change: 6.6% | |
| CSQ Links: Profile News Message Board | |
| Charts:- Daily , Weekly | |
| Add CSQ to Watchlist: View: Get Complete CSQ Trend Analysis ➞ | |
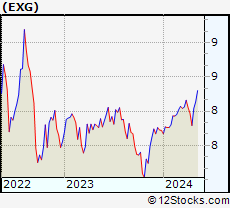 | EXG Eaton Vance Tax-Managed Global Diversified Equity Income Fund |
| Sector: Financials | |
| SubSector: Closed-End Fund - Foreign | |
| MarketCap: 2735.07 Millions | |
| Recent Price: 8.93 Smart Investing & Trading Score: 80 | |
| Day Percent Change: -0.46% Day Change: -0.04 | |
| Week Change: -1.58% Year-to-date Change: 12.9% | |
| EXG Links: Profile News Message Board | |
| Charts:- Daily , Weekly | |
| Add EXG to Watchlist: View: Get Complete EXG Trend Analysis ➞ | |
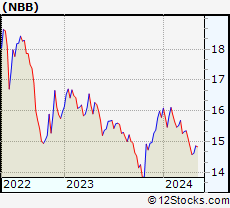 | NBB Nuveen Taxable Municipal Income Fund |
| Sector: Financials | |
| SubSector: Closed-End Fund - Debt | |
| MarketCap: 472.67 Millions | |
| Recent Price: 15.95 Smart Investing & Trading Score: 90 | |
| Day Percent Change: -0.32% Day Change: -0.05 | |
| Week Change: -1.58% Year-to-date Change: 8.8% | |
| NBB Links: Profile News Message Board | |
| Charts:- Daily , Weekly | |
| Add NBB to Watchlist: View: Get Complete NBB Trend Analysis ➞ | |
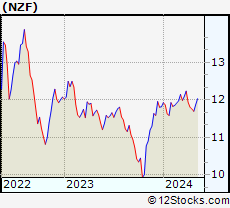 | NZF Nuveen Municipal Credit Income Fund |
| Sector: Financials | |
| SubSector: Closed-End Fund - Debt | |
| MarketCap: 2361.56 Millions | |
| Recent Price: 11.97 Smart Investing & Trading Score: 100 | |
| Day Percent Change: 0.17% Day Change: 0.02 | |
| Week Change: -1.59% Year-to-date Change: 1.2% | |
| NZF Links: Profile News Message Board | |
| Charts:- Daily , Weekly | |
| Add NZF to Watchlist: View: Get Complete NZF Trend Analysis ➞ | |
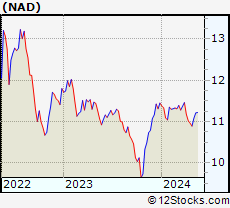 | NAD Nuveen Quality Municipal Income Fund |
| Sector: Financials | |
| SubSector: Closed-End Fund - Debt | |
| MarketCap: 2681.82 Millions | |
| Recent Price: 11.33 Smart Investing & Trading Score: 100 | |
| Day Percent Change: 0.09% Day Change: 0.01 | |
| Week Change: -1.59% Year-to-date Change: 0.3% | |
| NAD Links: Profile News Message Board | |
| Charts:- Daily , Weekly | |
| Add NAD to Watchlist: View: Get Complete NAD Trend Analysis ➞ | |
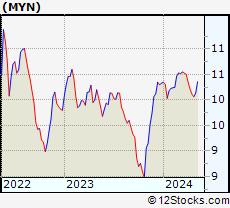 | MYN BlackRock MuniYield New York Quality Fund Inc |
| Sector: Financials | |
| SubSector: Closed-End Fund - Debt | |
| MarketCap: 362.06 Millions | |
| Recent Price: 9.32 Smart Investing & Trading Score: 80 | |
| Day Percent Change: -0.11% Day Change: -0.01 | |
| Week Change: -1.59% Year-to-date Change: -4.6% | |
| MYN Links: Profile News Message Board | |
| Charts:- Daily , Weekly | |
| Add MYN to Watchlist: View: Get Complete MYN Trend Analysis ➞ | |
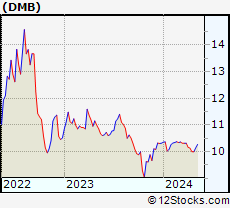 | DMB BNY Mellon Municipal Bond Infrastructure Fund Inc |
| Sector: Financials | |
| SubSector: Closed-End Fund - Debt | |
| MarketCap: 188.11 Millions | |
| Recent Price: 10.02 Smart Investing & Trading Score: 100 | |
| Day Percent Change: -0.6% Day Change: -0.06 | |
| Week Change: -1.59% Year-to-date Change: -2.1% | |
| DMB Links: Profile News Message Board | |
| Charts:- Daily , Weekly | |
| Add DMB to Watchlist: View: Get Complete DMB Trend Analysis ➞ | |
 | UMBF UMB Financial Corp |
| Sector: Financials | |
| SubSector: Banks - Regional | |
| MarketCap: 2773.4 Millions | |
| Recent Price: 121.90 Smart Investing & Trading Score: 100 | |
| Day Percent Change: -0.49% Day Change: -0.57 | |
| Week Change: -1.6% Year-to-date Change: 2.9% | |
| UMBF Links: Profile News Message Board | |
| Charts:- Daily , Weekly | |
| Add UMBF to Watchlist: View: Get Complete UMBF Trend Analysis ➞ | |
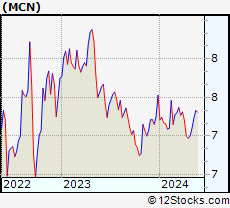 | MCN XAI Madison Equity Premium Income Fund |
| Sector: Financials | |
| SubSector: Closed-End Fund - Equity | |
| MarketCap: 132.4 Millions | |
| Recent Price: 6.32 Smart Investing & Trading Score: 70 | |
| Day Percent Change: -1.28% Day Change: -0.08 | |
| Week Change: -1.6% Year-to-date Change: -1.8% | |
| MCN Links: Profile News Message Board | |
| Charts:- Daily , Weekly | |
| Add MCN to Watchlist: View: Get Complete MCN Trend Analysis ➞ | |
 | FNLC First Bancorp Inc (ME) |
| Sector: Financials | |
| SubSector: Banks - Regional | |
| MarketCap: 304.7 Millions | |
| Recent Price: 27.18 Smart Investing & Trading Score: 90 | |
| Day Percent Change: -1.8% Day Change: -0.47 | |
| Week Change: -1.61% Year-to-date Change: -2.2% | |
| FNLC Links: Profile News Message Board | |
| Charts:- Daily , Weekly | |
| Add FNLC to Watchlist: View: Get Complete FNLC Trend Analysis ➞ | |
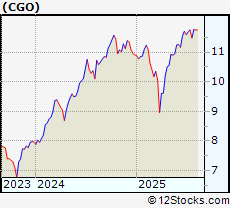 | CGO Calamos Global Total Return Fund |
| Sector: Financials | |
| SubSector: Closed-End Fund - Equity | |
| MarketCap: 117.89 Millions | |
| Recent Price: 11.76 Smart Investing & Trading Score: 80 | |
| Day Percent Change: -0.3% Day Change: -0.04 | |
| Week Change: -1.62% Year-to-date Change: 6.0% | |
| CGO Links: Profile News Message Board | |
| Charts:- Daily , Weekly | |
| Add CGO to Watchlist: View: Get Complete CGO Trend Analysis ➞ | |
 | CFFN Capitol Federal Financial |
| Sector: Financials | |
| SubSector: Banks - Regional | |
| MarketCap: 861.88 Millions | |
| Recent Price: 6.48 Smart Investing & Trading Score: 90 | |
| Day Percent Change: -1.31% Day Change: -0.08 | |
| Week Change: -1.63% Year-to-date Change: 6.5% | |
| CFFN Links: Profile News Message Board | |
| Charts:- Daily , Weekly | |
| Add CFFN to Watchlist: View: Get Complete CFFN Trend Analysis ➞ | |
 | GNW Genworth Financial Inc |
| Sector: Financials | |
| SubSector: Insurance - Life | |
| MarketCap: 3517.42 Millions | |
| Recent Price: 8.57 Smart Investing & Trading Score: 70 | |
| Day Percent Change: -0.71% Day Change: -0.06 | |
| Week Change: -1.64% Year-to-date Change: 20.3% | |
| GNW Links: Profile News Message Board | |
| Charts:- Daily , Weekly | |
| Add GNW to Watchlist: View: Get Complete GNW Trend Analysis ➞ | |
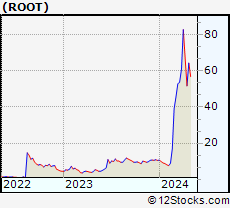 | ROOT Root Inc |
| Sector: Financials | |
| SubSector: Insurance - Property & Casualty | |
| MarketCap: 1431.04 Millions | |
| Recent Price: 92.22 Smart Investing & Trading Score: 60 | |
| Day Percent Change: 1.53% Day Change: 1.33 | |
| Week Change: -1.64% Year-to-date Change: 21.4% | |
| ROOT Links: Profile News Message Board | |
| Charts:- Daily , Weekly | |
| Add ROOT to Watchlist: View: Get Complete ROOT Trend Analysis ➞ | |
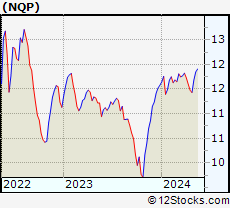 | NQP Nuveen Pennsylvania Quality Municipal Income Fund |
| Sector: Financials | |
| SubSector: Closed-End Fund - Debt | |
| MarketCap: 412.75 Millions | |
| Recent Price: 10.96 Smart Investing & Trading Score: 80 | |
| Day Percent Change: -0.46% Day Change: -0.05 | |
| Week Change: -1.65% Year-to-date Change: 1.0% | |
| NQP Links: Profile News Message Board | |
| Charts:- Daily , Weekly | |
| Add NQP to Watchlist: View: Get Complete NQP Trend Analysis ➞ | |
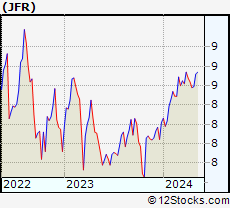 | JFR Nuveen Floating Rate Income Fund |
| Sector: Financials | |
| SubSector: Closed-End Fund - Debt | |
| MarketCap: 1131.43 Millions | |
| Recent Price: 8.45 Smart Investing & Trading Score: 50 | |
| Day Percent Change: -0.48% Day Change: -0.04 | |
| Week Change: -1.65% Year-to-date Change: 0.6% | |
| JFR Links: Profile News Message Board | |
| Charts:- Daily , Weekly | |
| Add JFR to Watchlist: View: Get Complete JFR Trend Analysis ➞ | |
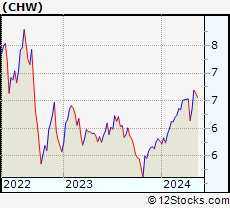 | CHW Calamos Global Dynamic Income Fund |
| Sector: Financials | |
| SubSector: Closed-End Fund - Equity | |
| MarketCap: 463.02 Millions | |
| Recent Price: 7.31 Smart Investing & Trading Score: 60 | |
| Day Percent Change: -0.14% Day Change: -0.01 | |
| Week Change: -1.65% Year-to-date Change: 10.7% | |
| CHW Links: Profile News Message Board | |
| Charts:- Daily , Weekly | |
| Add CHW to Watchlist: View: Get Complete CHW Trend Analysis ➞ | |
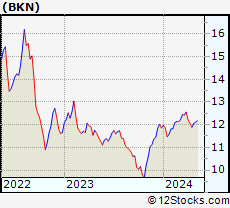 | BKN BlackRock Investment Quality Municipal Trust |
| Sector: Financials | |
| SubSector: Closed-End Fund - Debt | |
| MarketCap: 189.61 Millions | |
| Recent Price: 10.75 Smart Investing & Trading Score: 100 | |
| Day Percent Change: -0.36% Day Change: -0.04 | |
| Week Change: -1.65% Year-to-date Change: -1.1% | |
| BKN Links: Profile News Message Board | |
| Charts:- Daily , Weekly | |
| Add BKN to Watchlist: View: Get Complete BKN Trend Analysis ➞ | |
 | CHMG Chemung Financial Corp |
| Sector: Financials | |
| SubSector: Banks - Regional | |
| MarketCap: 250.61 Millions | |
| Recent Price: 53.92 Smart Investing & Trading Score: 30 | |
| Day Percent Change: -1.38% Day Change: -0.71 | |
| Week Change: -1.66% Year-to-date Change: 5.5% | |
| CHMG Links: Profile News Message Board | |
| Charts:- Daily , Weekly | |
| Add CHMG to Watchlist: View: Get Complete CHMG Trend Analysis ➞ | |
 | UNTY Unity Bancorp, Inc |
| Sector: Financials | |
| SubSector: Banks - Regional | |
| MarketCap: 524.13 Millions | |
| Recent Price: 52.35 Smart Investing & Trading Score: 60 | |
| Day Percent Change: -0.16% Day Change: -0.08 | |
| Week Change: -1.66% Year-to-date Change: 12.1% | |
| UNTY Links: Profile News Message Board | |
| Charts:- Daily , Weekly | |
| Add UNTY to Watchlist: View: Get Complete UNTY Trend Analysis ➞ | |
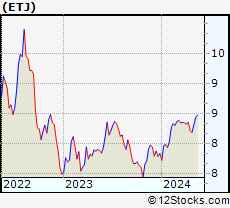 | ETJ Eaton Vance Risk-Managed Diversified Equity Income Fund |
| Sector: Financials | |
| SubSector: Closed-End Fund - Equity | |
| MarketCap: 609.08 Millions | |
| Recent Price: 8.99 Smart Investing & Trading Score: 70 | |
| Day Percent Change: 0.23% Day Change: 0.02 | |
| Week Change: -1.66% Year-to-date Change: 0.7% | |
| ETJ Links: Profile News Message Board | |
| Charts:- Daily , Weekly | |
| Add ETJ to Watchlist: View: Get Complete ETJ Trend Analysis ➞ | |
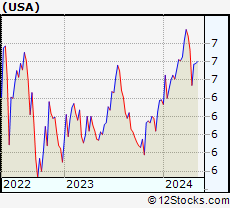 | USA Liberty All-Star Equity Fund |
| Sector: Financials | |
| SubSector: Closed-End Fund - Equity | |
| MarketCap: 1939.61 Millions | |
| Recent Price: 6.60 Smart Investing & Trading Score: 30 | |
| Day Percent Change: -1.21% Day Change: -0.08 | |
| Week Change: -1.66% Year-to-date Change: 1.1% | |
| USA Links: Profile News Message Board | |
| Charts:- Daily , Weekly | |
| Add USA to Watchlist: View: Get Complete USA Trend Analysis ➞ | |
 | EQIX Equinix Inc |
| Sector: Financials | |
| SubSector: REIT - Specialty | |
| MarketCap: 75715.4 Millions | |
| Recent Price: 773.36 Smart Investing & Trading Score: 50 | |
| Day Percent Change: 0.71% Day Change: 5.43 | |
| Week Change: -1.67% Year-to-date Change: -14.5% | |
| EQIX Links: Profile News Message Board | |
| Charts:- Daily , Weekly | |
| Add EQIX to Watchlist: View: Get Complete EQIX Trend Analysis ➞ | |
| For tabular summary view of above stock list: Summary View ➞ 0 - 25 , 25 - 50 , 50 - 75 , 75 - 100 , 100 - 125 , 125 - 150 , 150 - 175 , 175 - 200 , 200 - 225 , 225 - 250 , 250 - 275 , 275 - 300 , 300 - 325 , 325 - 350 , 350 - 375 , 375 - 400 , 400 - 425 , 425 - 450 , 450 - 475 , 475 - 500 , 500 - 525 , 525 - 550 , 550 - 575 , 575 - 600 , 600 - 625 , 625 - 650 , 650 - 675 , 675 - 700 , 700 - 725 , 725 - 750 , 750 - 775 , 775 - 800 , 800 - 825 , 825 - 850 , 850 - 875 , 875 - 900 , 900 - 925 , 925 - 950 , 950 - 975 , 975 - 1000 , 1000 - 1025 , 1025 - 1050 , 1050 - 1075 , 1075 - 1100 | ||
| Click To Change The Sort Order: By Market Cap or Company Size Performance: Year-to-date, Week and Day | |
| Select Chart Type: | ||
|
Best Stocks Today 12Stocks.com |
© 2025 12Stocks.com Terms & Conditions Privacy Contact Us
All Information Provided Only For Education And Not To Be Used For Investing or Trading. See Terms & Conditions


One More Thing ... Get Best Stocks Delivered Daily!
Never Ever Miss A Move With Our Top Ten Stocks Lists
Find Best Stocks In Any Market - Bull or Bear Market
Take A Peek At Our Top Ten Stocks Lists: Daily, Weekly, Year-to-Date & Top Trends
Find Best Stocks In Any Market - Bull or Bear Market
Take A Peek At Our Top Ten Stocks Lists: Daily, Weekly, Year-to-Date & Top Trends
Financial Stocks With Best Up Trends [0-bearish to 100-bullish]: Compass [100], Western Union[100], Whitestone REIT[100], Healthcare Realty[100], Public Storage[100], Alexandria Real[100], Omega Healthcare[100], LendingTree [100], Federal Realty[100], OFS Capital[100], BXP [100]
Best Financial Stocks Year-to-Date:
ESSA Bancorp[2923.51%], Robinhood Markets[185.29%], Solowin [161.21%], Metalpha Technology[143.48%], IHS Holding[139.04%], Altisource Portfolio[127.41%], Banco Santander[113.19%], Banco Bilbao[102.83%], IREN [99.49%], Grupo Cibest[93.5%], Mr. Cooper[91.06%] Best Financial Stocks This Week:
Plymouth Industrial[40.4%], SelectQuote [30.15%], Altisource Portfolio[24.32%], Seritage Growth[20.21%], MBIA [18.44%], Nu [13.82%], Qudian [11.08%], Cipher Mining[10.9%], Brookfield Business[10.18%], BXP [9.64%], Stratus Properties[8.94%] Best Financial Stocks Daily:
SelectQuote [41.53%], X [15.73%], Altisource Portfolio[9.12%], Aegon [7.64%], UP Fintech[6.65%], FinVolution [5.55%], Hippo [5.47%], Lufax Holding[5.45%], eHealth [4.65%], MarketAxess [4.54%], Yiren Digital[3.6%]