
 Login Sign Up


| |||||
 |  | ||||

| 12Stocks.com Market Intelligence |
Best Financial Stocks
| In a hurry? Financial Stocks Lists: Performance Trends Table, Stock Charts
Sort Financial stocks: Daily, Weekly, Year-to-Date, Market Cap & Trends. Filter Financial stocks list by size:All Financial Large Mid-Range Small & MicroCap |
| 12Stocks.com Financial Stocks Performances & Trends Daily | |||||||||
|
|  The overall Smart Investing & Trading Score is 90 (0-bearish to 100-bullish) which puts Financial sector in short term bullish trend. The Smart Investing & Trading Score from previous trading session is 60 and an improvement of trend continues.
| ||||||||
Here are the Smart Investing & Trading Scores of the most requested Financial stocks at 12Stocks.com (click stock name for detailed review):
|


| 12Stocks.com: Investing in Financial sector with Stocks | |
|
The following table helps investors and traders sort through current performance and trends (as measured by Smart Investing & Trading Score) of various
stocks in the Financial sector. Quick View: Move mouse or cursor over stock symbol (ticker) to view short-term Technical chart and over stock name to view long term chart. Click on  to add stock symbol to your watchlist and to add stock symbol to your watchlist and  to view watchlist. Click on any ticker or stock name for detailed market intelligence report for that stock. to view watchlist. Click on any ticker or stock name for detailed market intelligence report for that stock. |
12Stocks.com Performance of Stocks in Financial Sector
| Ticker | Stock Name | Watchlist | Category | Recent Price | Trend Score | Change % | YTD Change% |
| FCNCA | First Citizens |   | Banks - Regional | 1895.96 | 30 | 0.70% | -9.64% |
| HCN | Welltower | | REIT | 5.85 | 70 | 1.39% | 0.00% |
| NTRS | Northern Trust | | Asset Mgmt | 132.22 | 70 | 2.13% | 30.31% |
| CBOE | Cboe Global | | Financial Data & Stock Exchanges | 234.43 | 30 | -1.07% | 20.03% |
| MKL | Markel | | Insurance - Property & Casualty | 1944.60 | 40 | 0.87% | 13.23% |
| RF | Regions | | Banks - Regional | 27.40 | 90 | 1.75% | 20.46% |
| CINF | Cinnati | | Insurance - Property & Casualty | 155.93 | 90 | 0.94% | 10.76% |
| TROW | T. Rowe | | Asset Mgmt | 105.79 | 70 | 0.89% | -4.14% |
| CG | Carlyle | | Asset Mgmt | 69.35 | 100 | 2.63% | 38.65% |
| CFG | Citizens | | Banks - Regional | 53.64 | 100 | 2.62% | 26.60% |
| SHG | Shinhan | | Banks - Regional | 49.27 | 40 | -1.48% | 54.10% |
| TPG | TPG | | Asset Mgmt | 63.73 | 66 | 0.81% | -2.73% |
| CS | Credit Suisse | | Foreign Banks | 561.08 | 70 | 0.89% | 0.00% |
| WLTW | Willis Towers | | Insurance | 231.56 | 0 | -1.19% | 0.00% |
| NMR | Nomura | | Capital Markets | 7.56 | 60 | 0.93% | 35.14% |
| SBAC | SBA | | REIT - Specialty | 198.82 | 50 | -0.28% | 0.20% |
| GGP | GGP | | REIT - Retail | 53.97 | 60 | 0.60% | 0.00% |
| BEKE | KE | | Real Estate Services | 20.07 | 90 | -1.42% | 14.73% |
| BAP | Credicorp | | Banks - Regional | 261.91 | 50 | -5.89% | 50.23% |
| KEY | Keycorp | | Banks - Regional | 19.13 | 70 | 2.24% | 15.54% |
| BSBR | Banco Santander | | Banks - Regional | 5.52 | 90 | -0.72% | 45.55% |
| FST | FAST Acquisition | | SPAC | 10.18 | 30 | 0.00% | 0.00% |
| L | Loews Corp | | Insurance - Property & Casualty | 97.04 | 90 | 0.26% | 15.47% |
| WY | Weyerhaeuser Co | | REIT - Specialty | 24.54 | 0 | 0.20% | -10.99% |
| INVH | Invitation Homes | | REIT | 29.52 | 0 | -0.40% | -4.44% |
| For chart view version of above stock list: Chart View ➞ 0 - 25 , 25 - 50 , 50 - 75 , 75 - 100 , 100 - 125 , 125 - 150 , 150 - 175 , 175 - 200 , 200 - 225 , 225 - 250 , 250 - 275 , 275 - 300 , 300 - 325 , 325 - 350 , 350 - 375 , 375 - 400 , 400 - 425 , 425 - 450 , 450 - 475 , 475 - 500 , 500 - 525 , 525 - 550 , 550 - 575 , 575 - 600 , 600 - 625 , 625 - 650 , 650 - 675 , 675 - 700 , 700 - 725 , 725 - 750 , 750 - 775 , 775 - 800 , 800 - 825 , 825 - 850 , 850 - 875 , 875 - 900 , 900 - 925 , 925 - 950 , 950 - 975 , 975 - 1000 , 1000 - 1025 , 1025 - 1050 , 1050 - 1075 , 1075 - 1100 , 1100 - 1125 , 1125 - 1150 , 1150 - 1175 , 1175 - 1200 , 1200 - 1225 , 1225 - 1250 , 1250 - 1275 , 1275 - 1300 , 1300 - 1325 , 1325 - 1350 , 1350 - 1375 , 1375 - 1400 , 1400 - 1425 , 1425 - 1450 , 1450 - 1475 , 1475 - 1500 , 1500 - 1525 , 1525 - 1550 | ||
 | Click To Change The Sort Order: By Market Cap or Company Size Performance: Year-to-date, Week and Day |  |
|
Get the most comprehensive stock market coverage daily at 12Stocks.com ➞ Best Stocks Today ➞ Best Stocks Weekly ➞ Best Stocks Year-to-Date ➞ Best Stocks Trends ➞  Best Stocks Today 12Stocks.com Best Nasdaq Stocks ➞ Best S&P 500 Stocks ➞ Best Tech Stocks ➞ Best Biotech Stocks ➞ |
| Detailed Overview of Financial Stocks |
| Financial Technical Overview, Leaders & Laggards, Top Financial ETF Funds & Detailed Financial Stocks List, Charts, Trends & More |
| Financial Sector: Technical Analysis, Trends & YTD Performance | |
| Financial sector is composed of stocks
from banks, brokers, insurance, REITs
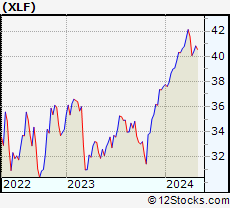
and services subsectors. Financial sector, as represented by XLF, an exchange-traded fund [ETF] that holds basket of Financial stocks (e.g, Bank of America, Goldman Sachs) is up by 13.0735% and is currently underperforming the overall market by -0.7866% year-to-date. Below is a quick view of Technical charts and trends: |
|
 XLF Weekly Chart |
|
| Long Term Trend: Good | |
| Medium Term Trend: Good | |
 XLF Daily Chart |
|
| Short Term Trend: Very Good | |
| Overall Trend Score: 90 | |
| YTD Performance: 13.0735% | |
| **Trend Scores & Views Are Only For Educational Purposes And Not For Investing | |
| 12Stocks.com: Top Performing Financial Sector Stocks | |||||||||||||||||||||||||||||||||||||||||||||||
 The top performing Financial sector stocks year to date are
Now, more recently, over last week, the top performing Financial sector stocks on the move are


|
|||||||||||||||||||||||||||||||||||||||||||||||
| 12Stocks.com: Investing in Financial Sector using Exchange Traded Funds | |
|
The following table shows list of key exchange traded funds (ETF) that
help investors track Financial Index. For detailed view, check out our ETF Funds section of our website. Quick View: Move mouse or cursor over ETF symbol (ticker) to view short-term Technical chart and over ETF name to view long term chart. Click on ticker or stock name for detailed view. Click on to add stock symbol to your watchlist and to view watchlist. |
12Stocks.com List of ETFs that track Financial Index
| Ticker | ETF Name | Watchlist | Recent Price | Smart Investing & Trading Score | Change % | Week % | Year-to-date % |
| CHIX | China Financials | | 10.57 | 20 | 0 | 0 | 0% |
| 12Stocks.com: Charts, Trends, Fundamental Data and Performances of Financial Stocks | |
|
We now take in-depth look at all Financial stocks including charts, multi-period performances and overall trends (as measured by Smart Investing & Trading Score). One can sort Financial stocks (click link to choose) by Daily, Weekly and by Year-to-Date performances. Also, one can sort by size of the company or by market capitalization. |
| Select Your Default Chart Type: | |||||
| |||||
| Click on stock symbol or name for detailed view. Click on to add stock symbol to your watchlist and to view watchlist. Quick View: Move mouse or cursor over "Daily" to quickly view daily Technical stock chart and over "Weekly" to view weekly Technical stock chart. | |||||

 | FCNCA First Citizens Bancshares, Inc (NC) |
| Sector: Financials | |
| SubSector: Banks - Regional | |
| MarketCap: 24615.1 Millions | |
| Recent Price: 1895.96 Smart Investing & Trading Score: 30 | |
| Day Percent Change: 0.697354% Day Change: 18.87 | |
| Week Change: -2.60396% Year-to-date Change: -9.6% | |
| FCNCA Links: Profile News Message Board | |
| Charts:- Daily , Weekly | |
| Add FCNCA to Watchlist: View: Get Complete FCNCA Trend Analysis ➞ | |
 | HCN Welltower Inc. |
| Sector: Financials | |
| SubSector: REIT - Healthcare Facilities | |
| MarketCap: 24365.6 Millions | |
| Recent Price: 5.85 Smart Investing & Trading Score: 70 | |
| Day Percent Change: 1.38648% Day Change: -9999 | |
| Week Change: 4.83871% Year-to-date Change: 0.0% | |
| HCN Links: Profile News Message Board | |
| Charts:- Daily , Weekly | |
| Add HCN to Watchlist: View: Get Complete HCN Trend Analysis ➞ | |
 | NTRS Northern Trust Corp |
| Sector: Financials | |
| SubSector: Asset Management | |
| MarketCap: 24338.3 Millions | |
| Recent Price: 132.22 Smart Investing & Trading Score: 70 | |
| Day Percent Change: 2.13193% Day Change: 3.14 | |
| Week Change: 4.06107% Year-to-date Change: 30.3% | |
| NTRS Links: Profile News Message Board | |
| Charts:- Daily , Weekly | |
| Add NTRS to Watchlist: View: Get Complete NTRS Trend Analysis ➞ | |
 | CBOE Cboe Global Markets Inc |
| Sector: Financials | |
| SubSector: Financial Data & Stock Exchanges | |
| MarketCap: 24325.6 Millions | |
| Recent Price: 234.43 Smart Investing & Trading Score: 30 | |
| Day Percent Change: -1.06769% Day Change: -3.15 | |
| Week Change: -0.0341137% Year-to-date Change: 20.0% | |
| CBOE Links: Profile News Message Board | |
| Charts:- Daily , Weekly | |
| Add CBOE to Watchlist: View: Get Complete CBOE Trend Analysis ➞ | |
 | MKL Markel Group Inc |
| Sector: Financials | |
| SubSector: Insurance - Property & Casualty | |
| MarketCap: 24192.3 Millions | |
| Recent Price: 1944.60 Smart Investing & Trading Score: 40 | |
| Day Percent Change: 0.869367% Day Change: 19.75 | |
| Week Change: 1.24223% Year-to-date Change: 13.2% | |
| MKL Links: Profile News Message Board | |
| Charts:- Daily , Weekly | |
| Add MKL to Watchlist: View: Get Complete MKL Trend Analysis ➞ | |
 | RF Regions Financial Corp |
| Sector: Financials | |
| SubSector: Banks - Regional | |
| MarketCap: 24119.1 Millions | |
| Recent Price: 27.40 Smart Investing & Trading Score: 90 | |
| Day Percent Change: 1.74527% Day Change: 0.45 | |
| Week Change: 1.33136% Year-to-date Change: 20.5% | |
| RF Links: Profile News Message Board | |
| Charts:- Daily , Weekly | |
| Add RF to Watchlist: View: Get Complete RF Trend Analysis ➞ | |
 | CINF Cincinnati Financial Corp |
| Sector: Financials | |
| SubSector: Insurance - Property & Casualty | |
| MarketCap: 23981.9 Millions | |
| Recent Price: 155.93 Smart Investing & Trading Score: 90 | |
| Day Percent Change: 0.938633% Day Change: 1.23 | |
| Week Change: 2.37673% Year-to-date Change: 10.8% | |
| CINF Links: Profile News Message Board | |
| Charts:- Daily , Weekly | |
| Add CINF to Watchlist: View: Get Complete CINF Trend Analysis ➞ | |
 | TROW T. Rowe Price Group Inc |
| Sector: Financials | |
| SubSector: Asset Management | |
| MarketCap: 23764.4 Millions | |
| Recent Price: 105.79 Smart Investing & Trading Score: 70 | |
| Day Percent Change: 0.886897% Day Change: 1.1 | |
| Week Change: -0.797074% Year-to-date Change: -4.1% | |
| TROW Links: Profile News Message Board | |
| Charts:- Daily , Weekly | |
| Add TROW to Watchlist: View: Get Complete TROW Trend Analysis ➞ | |
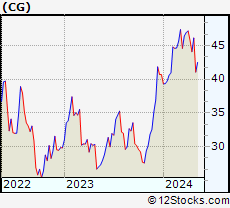 | CG Carlyle Group Inc |
| Sector: Financials | |
| SubSector: Asset Management | |
| MarketCap: 23058.7 Millions | |
| Recent Price: 69.35 Smart Investing & Trading Score: 100 | |
| Day Percent Change: 2.63431% Day Change: 1.73 | |
| Week Change: 5.70035% Year-to-date Change: 38.7% | |
| CG Links: Profile News Message Board | |
| Charts:- Daily , Weekly | |
| Add CG to Watchlist: View: Get Complete CG Trend Analysis ➞ | |
 | CFG Citizens Financial Group Inc |
| Sector: Financials | |
| SubSector: Banks - Regional | |
| MarketCap: 22305.1 Millions | |
| Recent Price: 53.64 Smart Investing & Trading Score: 100 | |
| Day Percent Change: 2.62101% Day Change: 1.42 | |
| Week Change: 3.53214% Year-to-date Change: 26.6% | |
| CFG Links: Profile News Message Board | |
| Charts:- Daily , Weekly | |
| Add CFG to Watchlist: View: Get Complete CFG Trend Analysis ➞ | |
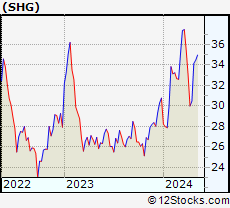 | SHG Shinhan Financial Group Co. Ltd. ADR |
| Sector: Financials | |
| SubSector: Banks - Regional | |
| MarketCap: 22185.6 Millions | |
| Recent Price: 49.27 Smart Investing & Trading Score: 40 | |
| Day Percent Change: -1.4797% Day Change: -0.07 | |
| Week Change: 0.818498% Year-to-date Change: 54.1% | |
| SHG Links: Profile News Message Board | |
| Charts:- Daily , Weekly | |
| Add SHG to Watchlist: View: Get Complete SHG Trend Analysis ➞ | |
 | TPG TPG Inc |
| Sector: Financials | |
| SubSector: Asset Management | |
| MarketCap: 22113 Millions | |
| Recent Price: 63.73 Smart Investing & Trading Score: 66 | |
| Day Percent Change: 0.81% Day Change: 0.48 | |
| Week Change: -6.36% Year-to-date Change: -2.7% | |
| TPG Links: Profile News Message Board | |
| Charts:- Daily , Weekly | |
| Add TPG to Watchlist: View: Get Complete TPG Trend Analysis ➞ | |
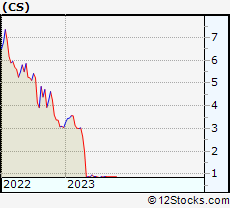 | CS Credit Suisse Group AG |
| Sector: Financials | |
| SubSector: Foreign Money Center Banks | |
| MarketCap: 21692.4 Millions | |
| Recent Price: 561.08 Smart Investing & Trading Score: 70 | |
| Day Percent Change: 0.886451% Day Change: -9999 | |
| Week Change: 63241.6% Year-to-date Change: 0.0% | |
| CS Links: Profile News Message Board | |
| Charts:- Daily , Weekly | |
| Add CS to Watchlist: View: Get Complete CS Trend Analysis ➞ | |
 | WLTW Willis Towers Watson Public Limited Company |
| Sector: Financials | |
| SubSector: Insurance Brokers | |
| MarketCap: 21403.4 Millions | |
| Recent Price: 231.56 Smart Investing & Trading Score: 0 | |
| Day Percent Change: -1.18631% Day Change: -9999 | |
| Week Change: -2.3448% Year-to-date Change: 0.0% | |
| WLTW Links: Profile News Message Board | |
| Charts:- Daily , Weekly | |
| Add WLTW to Watchlist: View: Get Complete WLTW Trend Analysis ➞ | |
 | NMR Nomura Holdings Inc. ADR |
| Sector: Financials | |
| SubSector: Capital Markets | |
| MarketCap: 21257.9 Millions | |
| Recent Price: 7.56 Smart Investing & Trading Score: 60 | |
| Day Percent Change: 0.934579% Day Change: -0.05 | |
| Week Change: 1.34048% Year-to-date Change: 35.1% | |
| NMR Links: Profile News Message Board | |
| Charts:- Daily , Weekly | |
| Add NMR to Watchlist: View: Get Complete NMR Trend Analysis ➞ | |
 | SBAC SBA Communications Corp |
| Sector: Financials | |
| SubSector: REIT - Specialty | |
| MarketCap: 21233.1 Millions | |
| Recent Price: 198.82 Smart Investing & Trading Score: 50 | |
| Day Percent Change: -0.280871% Day Change: -0.69 | |
| Week Change: 2.7122% Year-to-date Change: 0.2% | |
| SBAC Links: Profile News Message Board | |
| Charts:- Daily , Weekly | |
| Add SBAC to Watchlist: View: Get Complete SBAC Trend Analysis ➞ | |
 | GGP GGP Inc. |
| Sector: Financials | |
| SubSector: REIT - Retail | |
| MarketCap: 20902.7 Millions | |
| Recent Price: 53.97 Smart Investing & Trading Score: 60 | |
| Day Percent Change: 0.596459% Day Change: -9999 | |
| Week Change: -10.1997% Year-to-date Change: 0.0% | |
| GGP Links: Profile News Message Board | |
| Charts:- Daily , Weekly | |
| Add GGP to Watchlist: View: Get Complete GGP Trend Analysis ➞ | |
 | BEKE KE Holdings Inc ADR |
| Sector: Financials | |
| SubSector: Real Estate Services | |
| MarketCap: 20791.6 Millions | |
| Recent Price: 20.07 Smart Investing & Trading Score: 90 | |
| Day Percent Change: -1.42436% Day Change: -0.04 | |
| Week Change: 0.803616% Year-to-date Change: 14.7% | |
| BEKE Links: Profile News Message Board | |
| Charts:- Daily , Weekly | |
| Add BEKE to Watchlist: View: Get Complete BEKE Trend Analysis ➞ | |
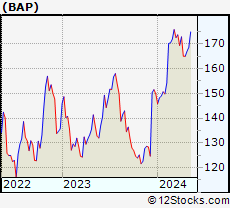 | BAP Credicorp Ltd |
| Sector: Financials | |
| SubSector: Banks - Regional | |
| MarketCap: 20774.1 Millions | |
| Recent Price: 261.91 Smart Investing & Trading Score: 50 | |
| Day Percent Change: -5.88595% Day Change: 2.04 | |
| Week Change: -0.859263% Year-to-date Change: 50.2% | |
| BAP Links: Profile News Message Board | |
| Charts:- Daily , Weekly | |
| Add BAP to Watchlist: View: Get Complete BAP Trend Analysis ➞ | |
 | KEY Keycorp |
| Sector: Financials | |
| SubSector: Banks - Regional | |
| MarketCap: 20768 Millions | |
| Recent Price: 19.13 Smart Investing & Trading Score: 70 | |
| Day Percent Change: 2.24479% Day Change: 0.41 | |
| Week Change: -0.520021% Year-to-date Change: 15.5% | |
| KEY Links: Profile News Message Board | |
| Charts:- Daily , Weekly | |
| Add KEY to Watchlist: View: Get Complete KEY Trend Analysis ➞ | |
 | BSBR Banco Santander (Brasil) S.A. ADR |
| Sector: Financials | |
| SubSector: Banks - Regional | |
| MarketCap: 20321.1 Millions | |
| Recent Price: 5.52 Smart Investing & Trading Score: 90 | |
| Day Percent Change: -0.719424% Day Change: 0 | |
| Week Change: 2.98507% Year-to-date Change: 45.6% | |
| BSBR Links: Profile News Message Board | |
| Charts:- Daily , Weekly | |
| Add BSBR to Watchlist: View: Get Complete BSBR Trend Analysis ➞ | |
 | FST FAST Acquisition Corp. |
| Sector: Financials | |
| SubSector: SPAC | |
| MarketCap: 20157 Millions | |
| Recent Price: 10.18 Smart Investing & Trading Score: 30 | |
| Day Percent Change: 0% Day Change: -9999 | |
| Week Change: 0% Year-to-date Change: 0.0% | |
| FST Links: Profile News Message Board | |
| Charts:- Daily , Weekly | |
| Add FST to Watchlist: View: Get Complete FST Trend Analysis ➞ | |
 | L Loews Corp |
| Sector: Financials | |
| SubSector: Insurance - Property & Casualty | |
| MarketCap: 20045.7 Millions | |
| Recent Price: 97.04 Smart Investing & Trading Score: 90 | |
| Day Percent Change: 0.258291% Day Change: 0.64 | |
| Week Change: 0.957137% Year-to-date Change: 15.5% | |
| L Links: Profile News Message Board | |
| Charts:- Daily , Weekly | |
| Add L to Watchlist: View: Get Complete L Trend Analysis ➞ | |
 | WY Weyerhaeuser Co |
| Sector: Financials | |
| SubSector: REIT - Specialty | |
| MarketCap: 18867.5 Millions | |
| Recent Price: 24.54 Smart Investing & Trading Score: 0 | |
| Day Percent Change: 0.204165% Day Change: 0.15 | |
| Week Change: -2.23108% Year-to-date Change: -11.0% | |
| WY Links: Profile News Message Board | |
| Charts:- Daily , Weekly | |
| Add WY to Watchlist: View: Get Complete WY Trend Analysis ➞ | |
 | INVH Invitation Homes Inc |
| Sector: Financials | |
| SubSector: REIT - Residential | |
| MarketCap: 18543.5 Millions | |
| Recent Price: 29.52 Smart Investing & Trading Score: 0 | |
| Day Percent Change: -0.404858% Day Change: 0 | |
| Week Change: -1.63279% Year-to-date Change: -4.4% | |
| INVH Links: Profile News Message Board | |
| Charts:- Daily , Weekly | |
| Add INVH to Watchlist: View: Get Complete INVH Trend Analysis ➞ | |
| For tabular summary view of above stock list: Summary View ➞ 0 - 25 , 25 - 50 , 50 - 75 , 75 - 100 , 100 - 125 , 125 - 150 , 150 - 175 , 175 - 200 , 200 - 225 , 225 - 250 , 250 - 275 , 275 - 300 , 300 - 325 , 325 - 350 , 350 - 375 , 375 - 400 , 400 - 425 , 425 - 450 , 450 - 475 , 475 - 500 , 500 - 525 , 525 - 550 , 550 - 575 , 575 - 600 , 600 - 625 , 625 - 650 , 650 - 675 , 675 - 700 , 700 - 725 , 725 - 750 , 750 - 775 , 775 - 800 , 800 - 825 , 825 - 850 , 850 - 875 , 875 - 900 , 900 - 925 , 925 - 950 , 950 - 975 , 975 - 1000 , 1000 - 1025 , 1025 - 1050 , 1050 - 1075 , 1075 - 1100 , 1100 - 1125 , 1125 - 1150 , 1150 - 1175 , 1175 - 1200 , 1200 - 1225 , 1225 - 1250 , 1250 - 1275 , 1275 - 1300 , 1300 - 1325 , 1325 - 1350 , 1350 - 1375 , 1375 - 1400 , 1400 - 1425 , 1425 - 1450 , 1450 - 1475 , 1475 - 1500 , 1500 - 1525 , 1525 - 1550 | ||
| Click To Change The Sort Order: By Market Cap or Company Size Performance: Year-to-date, Week and Day | |
| Select Chart Type: | ||
|
Best Stocks Today 12Stocks.com |
© 2025 12Stocks.com Terms & Conditions Privacy Contact Us
All Information Provided Only For Education And Not To Be Used For Investing or Trading. See Terms & Conditions


One More Thing ... Get Best Stocks Delivered Daily!
Never Ever Miss A Move With Our Top Ten Stocks Lists
Find Best Stocks In Any Market - Bull or Bear Market
Take A Peek At Our Top Ten Stocks Lists: Daily, Weekly, Year-to-Date & Top Trends
Find Best Stocks In Any Market - Bull or Bear Market
Take A Peek At Our Top Ten Stocks Lists: Daily, Weekly, Year-to-Date & Top Trends
Financial Stocks With Best Up Trends [0-bearish to 100-bullish]: Better Home[100], AMREP Corp[100], PIMCO California[100], Torchmark [100], PIMCO California[100], Triumph Bancorp[100], StepStone [100], Radian [100], National Bank[100], PIMCO Municipal[100], MARA [100]
Best Financial Stocks Year-to-Date:
Insight Select[12384.6%], Oxford Lane[292.479%], Better Home[250.328%], Metalpha Technology[213.274%], Robinhood Markets[206.567%], Cipher Mining[145.528%], Mr. Cooper[133.957%], Banco Santander[130.037%], IHS Holding[117.61%], Deutsche Bank[114.776%], LoanDepot [110.733%] Best Financial Stocks This Week:
Colony Starwood[15929900%], Blackhawk Network[91300%], Macquarie Global[81662.9%], Credit Suisse[63241.6%], Pennsylvania Real[23823%], First Republic[22570.9%], Select ome[14000%], CorEnergy Infrastructure[6797.78%], FedNat Holding[5525%], BlackRock Municipal[5340%], BlackRock MuniYield[3379.04%] Best Financial Stocks Daily:
Better Home[13.3451%], AMREP Corp[11.992%], PIMCO California[11.9545%], Torchmark [11.8363%], Forge Global[11.5409%], PIMCO California[11.4754%], BlackRock Muni[10.8108%], Blackrock MuniYield[10.72%], Triumph Bancorp[10.2661%], StepStone [8.74771%], BlackRock MuniYield[8.15348%]