
 Login Sign Up


| |||||
 |  | ||||

| 12Stocks.com Market Intelligence |
Best Financial Stocks
| In a hurry? Financial Stocks Lists: Performance Trends Table, Stock Charts
Sort Financial stocks: Daily, Weekly, Year-to-Date, Market Cap & Trends. Filter Financial stocks list by size:All Financial Large Mid-Range Small & MicroCap |
| 12Stocks.com Financial Stocks Performances & Trends Daily | |||||||||
|
|  The overall Smart Investing & Trading Score is 90 (0-bearish to 100-bullish) which puts Financial sector in short term bullish trend. The Smart Investing & Trading Score from previous trading session is 60 and an improvement of trend continues.
| ||||||||
Here are the Smart Investing & Trading Scores of the most requested Financial stocks at 12Stocks.com (click stock name for detailed review):
|


| 12Stocks.com: Investing in Financial sector with Stocks | |
|
The following table helps investors and traders sort through current performance and trends (as measured by Smart Investing & Trading Score) of various
stocks in the Financial sector. Quick View: Move mouse or cursor over stock symbol (ticker) to view short-term Technical chart and over stock name to view long term chart. Click on  to add stock symbol to your watchlist and to add stock symbol to your watchlist and  to view watchlist. Click on any ticker or stock name for detailed market intelligence report for that stock. to view watchlist. Click on any ticker or stock name for detailed market intelligence report for that stock. |
12Stocks.com Performance of Stocks in Financial Sector
| Ticker | Stock Name | Watchlist | Category | Recent Price | Smart Investing & Trading Score | Change % | Weekly Change% |
| MIN | MFS Intermediate |   | Closed-End Fund - Debt | 2.69 | 0 | -0.37% | -0.74% |
| KSM | DWS Strategic | | Closed-End Fund - Debt | 10.07 | 20 | 0.35% | -0.74% |
| DB | Deutsche Bank | | Banks - Regional | 35.94 | 50 | -1.37% | -0.75% |
| ABR | Arbor Realty | | REIT - Mortgage | 11.65 | 40 | -1.10% | -0.77% |
| SFNC | Simmons First | | Banks - Regional | 20.37 | 70 | 3.03% | -0.78% |
| FTF | Franklin | | Closed-End Fund - Debt | 6.40 | 20 | -1.01% | -0.78% |
| PLMR | Palomar | | Insurance - Property & Casualty | 117.77 | 50 | 2.36% | -0.78% |
| EDF | Virtus Stone | | Closed-End Fund - Foreign | 5.06 | 50 | -0.39% | -0.78% |
| IFN | India Fund | | Closed-End Fund - Equity | 15.03 | 30 | -0.73% | -0.79% |
| CFNB | California First | | Regional Banks | 18.80 | 10 | 0.00% | -0.79% |
| TROW | T. Rowe | | Asset Mgmt | 105.79 | 70 | 0.89% | -0.80% |
| ESBA | Empire State | | REIT - Office | 7.41 | 30 | -1.33% | -0.80% |
| STAG | STAG Industrial | | REIT - Industrial | 35.50 | 10 | 0.34% | -0.81% |
| PLYM | Plymouth Industrial | | REIT - Industrial | 22.00 | 30 | 0.59% | -0.81% |
| AXS | Axis Capital | | Insurance - Specialty | 96.29 | 40 | 1.44% | -0.82% |
| ALX | Alexander's | | REIT - Retail | 236.24 | 50 | 1.16% | -0.82% |
| JCE | Nuveen Core | | Closed-End Fund - Equity | 15.64 | 40 | 0.64% | -0.82% |
| FRA | Blackrock Floating | | Closed-End Fund - Debt | 13.13 | 20 | 0.08% | -0.83% |
| EAD | Allspring ome | | Closed-End Fund - Debt | 7.07 | 30 | -0.28% | -0.84% |
| ORC | Orchid Island | | REIT - Mortgage | 7.08 | 40 | -1.12% | -0.84% |
| BAP | Credicorp | | Banks - Regional | 261.91 | 50 | -5.89% | -0.86% |
| RLI | RLI Corp | | Insurance - Property & Casualty | 65.68 | 40 | 0.41% | -0.86% |
| GNT | GAMCO Natural | | Closed-End Fund - Equity | 6.89 | 40 | 0.00% | -0.86% |
| MAIN | Main Street | | Asset Mgmt | 66.13 | 50 | 0.52% | -0.87% |
| SYBT | Stock Yards | | Banks - Regional | 76.54 | 40 | 3.14% | -0.87% |
| For chart view version of above stock list: Chart View ➞ 0 - 25 , 25 - 50 , 50 - 75 , 75 - 100 , 100 - 125 , 125 - 150 , 150 - 175 , 175 - 200 , 200 - 225 , 225 - 250 , 250 - 275 , 275 - 300 , 300 - 325 , 325 - 350 , 350 - 375 , 375 - 400 , 400 - 425 , 425 - 450 , 450 - 475 , 475 - 500 , 500 - 525 , 525 - 550 , 550 - 575 , 575 - 600 , 600 - 625 , 625 - 650 , 650 - 675 , 675 - 700 , 700 - 725 , 725 - 750 , 750 - 775 , 775 - 800 , 800 - 825 , 825 - 850 , 850 - 875 , 875 - 900 , 900 - 925 , 925 - 950 , 950 - 975 , 975 - 1000 , 1000 - 1025 , 1025 - 1050 , 1050 - 1075 , 1075 - 1100 , 1100 - 1125 , 1125 - 1150 , 1150 - 1175 , 1175 - 1200 , 1200 - 1225 , 1225 - 1250 , 1250 - 1275 , 1275 - 1300 , 1300 - 1325 , 1325 - 1350 , 1350 - 1375 , 1375 - 1400 , 1400 - 1425 , 1425 - 1450 , 1450 - 1475 , 1475 - 1500 , 1500 - 1525 , 1525 - 1550 | ||
 | Click To Change The Sort Order: By Market Cap or Company Size Performance: Year-to-date, Week and Day |  |
|
Get the most comprehensive stock market coverage daily at 12Stocks.com ➞ Best Stocks Today ➞ Best Stocks Weekly ➞ Best Stocks Year-to-Date ➞ Best Stocks Trends ➞  Best Stocks Today 12Stocks.com Best Nasdaq Stocks ➞ Best S&P 500 Stocks ➞ Best Tech Stocks ➞ Best Biotech Stocks ➞ |
| Detailed Overview of Financial Stocks |
| Financial Technical Overview, Leaders & Laggards, Top Financial ETF Funds & Detailed Financial Stocks List, Charts, Trends & More |
| Financial Sector: Technical Analysis, Trends & YTD Performance | |
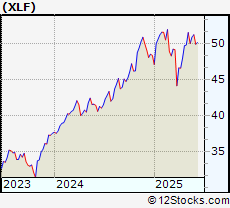
| Financial sector is composed of stocks
from banks, brokers, insurance, REITs
and services subsectors. Financial sector, as represented by XLF, an exchange-traded fund [ETF] that holds basket of Financial stocks (e.g, Bank of America, Goldman Sachs) is up by 13.0735% and is currently underperforming the overall market by -0.7866% year-to-date. Below is a quick view of Technical charts and trends: |
|
 XLF Weekly Chart |
|
| Long Term Trend: Good | |
| Medium Term Trend: Good | |
 XLF Daily Chart |
|
| Short Term Trend: Very Good | |
| Overall Trend Score: 90 | |
| YTD Performance: 13.0735% | |
| **Trend Scores & Views Are Only For Educational Purposes And Not For Investing | |
| 12Stocks.com: Top Performing Financial Sector Stocks | |||||||||||||||||||||||||||||||||||||||||||||||
 The top performing Financial sector stocks year to date are
Now, more recently, over last week, the top performing Financial sector stocks on the move are


|
|||||||||||||||||||||||||||||||||||||||||||||||
| 12Stocks.com: Investing in Financial Sector using Exchange Traded Funds | |
|
The following table shows list of key exchange traded funds (ETF) that
help investors track Financial Index. For detailed view, check out our ETF Funds section of our website. Quick View: Move mouse or cursor over ETF symbol (ticker) to view short-term Technical chart and over ETF name to view long term chart. Click on ticker or stock name for detailed view. Click on to add stock symbol to your watchlist and to view watchlist. |
12Stocks.com List of ETFs that track Financial Index
| Ticker | ETF Name | Watchlist | Recent Price | Smart Investing & Trading Score | Change % | Week % | Year-to-date % |
| CHIX | China Financials | | 10.57 | 20 | 0 | 0 | 0% |
| 12Stocks.com: Charts, Trends, Fundamental Data and Performances of Financial Stocks | |
|
We now take in-depth look at all Financial stocks including charts, multi-period performances and overall trends (as measured by Smart Investing & Trading Score). One can sort Financial stocks (click link to choose) by Daily, Weekly and by Year-to-Date performances. Also, one can sort by size of the company or by market capitalization. |
| Select Your Default Chart Type: | |||||
| |||||
| Click on stock symbol or name for detailed view. Click on to add stock symbol to your watchlist and to view watchlist. Quick View: Move mouse or cursor over "Daily" to quickly view daily Technical stock chart and over "Weekly" to view weekly Technical stock chart. | |||||

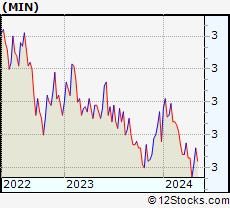 | MIN MFS Intermediate Income Trust |
| Sector: Financials | |
| SubSector: Closed-End Fund - Debt | |
| MarketCap: 307.26 Millions | |
| Recent Price: 2.69 Smart Investing & Trading Score: 0 | |
| Day Percent Change: -0.37037% Day Change: -0.02 | |
| Week Change: -0.738007% Year-to-date Change: 6.2% | |
| MIN Links: Profile News Message Board | |
| Charts:- Daily , Weekly | |
| Add MIN to Watchlist: View: Get Complete MIN Trend Analysis ➞ | |
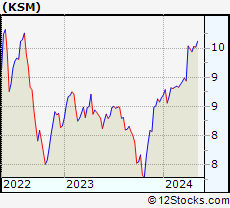 | KSM DWS Strategic Municipal Income Trust |
| Sector: Financials | |
| SubSector: Closed-End Fund - Debt | |
| MarketCap: 103.607 Millions | |
| Recent Price: 10.07 Smart Investing & Trading Score: 20 | |
| Day Percent Change: 0.348606% Day Change: -9999 | |
| Week Change: -0.738916% Year-to-date Change: 0.0% | |
| KSM Links: Profile News Message Board | |
| Charts:- Daily , Weekly | |
| Add KSM to Watchlist: View: Get Complete KSM Trend Analysis ➞ | |
 | DB Deutsche Bank AG |
| Sector: Financials | |
| SubSector: Banks - Regional | |
| MarketCap: 67800.5 Millions | |
| Recent Price: 35.94 Smart Investing & Trading Score: 50 | |
| Day Percent Change: -1.37212% Day Change: -0.47 | |
| Week Change: -0.74565% Year-to-date Change: 114.8% | |
| DB Links: Profile News Message Board | |
| Charts:- Daily , Weekly | |
| Add DB to Watchlist: View: Get Complete DB Trend Analysis ➞ | |
 | ABR Arbor Realty Trust Inc |
| Sector: Financials | |
| SubSector: REIT - Mortgage | |
| MarketCap: 2340.31 Millions | |
| Recent Price: 11.65 Smart Investing & Trading Score: 40 | |
| Day Percent Change: -1.10357% Day Change: -0.25 | |
| Week Change: -0.76661% Year-to-date Change: -9.9% | |
| ABR Links: Profile News Message Board | |
| Charts:- Daily , Weekly | |
| Add ABR to Watchlist: View: Get Complete ABR Trend Analysis ➞ | |
 | SFNC Simmons First National Corp |
| Sector: Financials | |
| SubSector: Banks - Regional | |
| MarketCap: 3021.36 Millions | |
| Recent Price: 20.37 Smart Investing & Trading Score: 70 | |
| Day Percent Change: 3.0349% Day Change: -0.04 | |
| Week Change: -0.779347% Year-to-date Change: -4.1% | |
| SFNC Links: Profile News Message Board | |
| Charts:- Daily , Weekly | |
| Add SFNC to Watchlist: View: Get Complete SFNC Trend Analysis ➞ | |
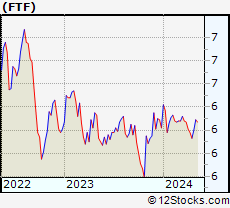 | FTF Franklin Limited Duration Income Trust |
| Sector: Financials | |
| SubSector: Closed-End Fund - Debt | |
| MarketCap: 259.81 Millions | |
| Recent Price: 6.40 Smart Investing & Trading Score: 20 | |
| Day Percent Change: -1.00541% Day Change: -0.01 | |
| Week Change: -0.775194% Year-to-date Change: 3.8% | |
| FTF Links: Profile News Message Board | |
| Charts:- Daily , Weekly | |
| Add FTF to Watchlist: View: Get Complete FTF Trend Analysis ➞ | |
 | PLMR Palomar Holdings Inc |
| Sector: Financials | |
| SubSector: Insurance - Property & Casualty | |
| MarketCap: 3299.86 Millions | |
| Recent Price: 117.77 Smart Investing & Trading Score: 50 | |
| Day Percent Change: 2.36419% Day Change: 1.8 | |
| Week Change: -0.783488% Year-to-date Change: 12.8% | |
| PLMR Links: Profile News Message Board | |
| Charts:- Daily , Weekly | |
| Add PLMR to Watchlist: View: Get Complete PLMR Trend Analysis ➞ | |
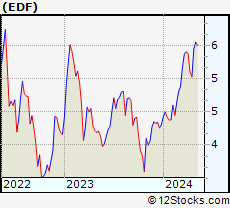 | EDF Virtus Stone Harbor Emerging Markets Income Fund |
| Sector: Financials | |
| SubSector: Closed-End Fund - Foreign | |
| MarketCap: 159.39 Millions | |
| Recent Price: 5.06 Smart Investing & Trading Score: 50 | |
| Day Percent Change: -0.393701% Day Change: -0.04 | |
| Week Change: -0.784314% Year-to-date Change: 16.4% | |
| EDF Links: Profile News Message Board | |
| Charts:- Daily , Weekly | |
| Add EDF to Watchlist: View: Get Complete EDF Trend Analysis ➞ | |
 | IFN India Fund Inc |
| Sector: Financials | |
| SubSector: Closed-End Fund - Equity | |
| MarketCap: 597.66 Millions | |
| Recent Price: 15.03 Smart Investing & Trading Score: 30 | |
| Day Percent Change: -0.726552% Day Change: -0.5 | |
| Week Change: -0.792079% Year-to-date Change: -1.1% | |
| IFN Links: Profile News Message Board | |
| Charts:- Daily , Weekly | |
| Add IFN to Watchlist: View: Get Complete IFN Trend Analysis ➞ | |
 | CFNB California First National Bancorp |
| Sector: Financials | |
| SubSector: Regional - Pacific Banks | |
| MarketCap: 161.46 Millions | |
| Recent Price: 18.80 Smart Investing & Trading Score: 10 | |
| Day Percent Change: 0% Day Change: -9999 | |
| Week Change: -0.791557% Year-to-date Change: -21.5% | |
| CFNB Links: Profile News Message Board | |
| Charts:- Daily , Weekly | |
| Add CFNB to Watchlist: View: Get Complete CFNB Trend Analysis ➞ | |
 | TROW T. Rowe Price Group Inc |
| Sector: Financials | |
| SubSector: Asset Management | |
| MarketCap: 23764.4 Millions | |
| Recent Price: 105.79 Smart Investing & Trading Score: 70 | |
| Day Percent Change: 0.886897% Day Change: 1.1 | |
| Week Change: -0.797074% Year-to-date Change: -4.1% | |
| TROW Links: Profile News Message Board | |
| Charts:- Daily , Weekly | |
| Add TROW to Watchlist: View: Get Complete TROW Trend Analysis ➞ | |
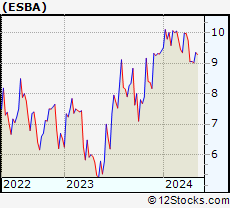 | ESBA Empire State Realty OP LP |
| Sector: Financials | |
| SubSector: REIT - Office | |
| MarketCap: 2137.77 Millions | |
| Recent Price: 7.41 Smart Investing & Trading Score: 30 | |
| Day Percent Change: -1.33156% Day Change: 0.09 | |
| Week Change: -0.803213% Year-to-date Change: -24.4% | |
| ESBA Links: Profile News Message Board | |
| Charts:- Daily , Weekly | |
| Add ESBA to Watchlist: View: Get Complete ESBA Trend Analysis ➞ | |
 | STAG STAG Industrial Inc |
| Sector: Financials | |
| SubSector: REIT - Industrial | |
| MarketCap: 7045.42 Millions | |
| Recent Price: 35.50 Smart Investing & Trading Score: 10 | |
| Day Percent Change: 0.339175% Day Change: 0.04 | |
| Week Change: -0.810282% Year-to-date Change: 10.3% | |
| STAG Links: Profile News Message Board | |
| Charts:- Daily , Weekly | |
| Add STAG to Watchlist: View: Get Complete STAG Trend Analysis ➞ | |
 | PLYM Plymouth Industrial Reit Inc |
| Sector: Financials | |
| SubSector: REIT - Industrial | |
| MarketCap: 1008.99 Millions | |
| Recent Price: 22.00 Smart Investing & Trading Score: 30 | |
| Day Percent Change: 0.594422% Day Change: 0.04 | |
| Week Change: -0.811542% Year-to-date Change: 30.9% | |
| PLYM Links: Profile News Message Board | |
| Charts:- Daily , Weekly | |
| Add PLYM to Watchlist: View: Get Complete PLYM Trend Analysis ➞ | |
 | AXS Axis Capital Holdings Ltd |
| Sector: Financials | |
| SubSector: Insurance - Specialty | |
| MarketCap: 7616.49 Millions | |
| Recent Price: 96.29 Smart Investing & Trading Score: 40 | |
| Day Percent Change: 1.44332% Day Change: 1.43 | |
| Week Change: -0.823978% Year-to-date Change: 9.3% | |
| AXS Links: Profile News Message Board | |
| Charts:- Daily , Weekly | |
| Add AXS to Watchlist: View: Get Complete AXS Trend Analysis ➞ | |
 | ALX Alexander's Inc |
| Sector: Financials | |
| SubSector: REIT - Retail | |
| MarketCap: 1197.46 Millions | |
| Recent Price: 236.24 Smart Investing & Trading Score: 50 | |
| Day Percent Change: 1.16045% Day Change: 0.33 | |
| Week Change: -0.818674% Year-to-date Change: 28.3% | |
| ALX Links: Profile News Message Board | |
| Charts:- Daily , Weekly | |
| Add ALX to Watchlist: View: Get Complete ALX Trend Analysis ➞ | |
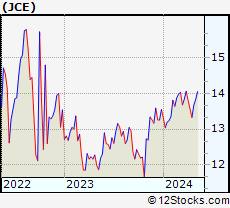 | JCE Nuveen Core Equity Alpha Fund |
| Sector: Financials | |
| SubSector: Closed-End Fund - Equity | |
| MarketCap: 264.96 Millions | |
| Recent Price: 15.64 Smart Investing & Trading Score: 40 | |
| Day Percent Change: 0.643501% Day Change: -0.09 | |
| Week Change: -0.82435% Year-to-date Change: 5.0% | |
| JCE Links: Profile News Message Board | |
| Charts:- Daily , Weekly | |
| Add JCE to Watchlist: View: Get Complete JCE Trend Analysis ➞ | |
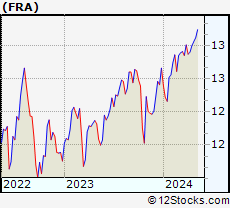 | FRA Blackrock Floating Rate Income Strategies Fund Inc |
| Sector: Financials | |
| SubSector: Closed-End Fund - Debt | |
| MarketCap: 472 Millions | |
| Recent Price: 13.13 Smart Investing & Trading Score: 20 | |
| Day Percent Change: 0.0762195% Day Change: 0.04 | |
| Week Change: -0.830816% Year-to-date Change: 2.4% | |
| FRA Links: Profile News Message Board | |
| Charts:- Daily , Weekly | |
| Add FRA to Watchlist: View: Get Complete FRA Trend Analysis ➞ | |
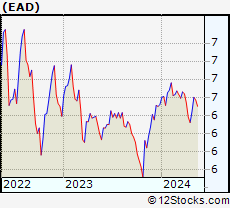 | EAD Allspring Income Opportunities Fund |
| Sector: Financials | |
| SubSector: Closed-End Fund - Debt | |
| MarketCap: 421.33 Millions | |
| Recent Price: 7.07 Smart Investing & Trading Score: 30 | |
| Day Percent Change: -0.282087% Day Change: -0.01 | |
| Week Change: -0.841515% Year-to-date Change: 7.7% | |
| EAD Links: Profile News Message Board | |
| Charts:- Daily , Weekly | |
| Add EAD to Watchlist: View: Get Complete EAD Trend Analysis ➞ | |
 | ORC Orchid Island Capital Inc |
| Sector: Financials | |
| SubSector: REIT - Mortgage | |
| MarketCap: 1159.37 Millions | |
| Recent Price: 7.08 Smart Investing & Trading Score: 40 | |
| Day Percent Change: -1.11732% Day Change: -0.05 | |
| Week Change: -0.840336% Year-to-date Change: 0.7% | |
| ORC Links: Profile News Message Board | |
| Charts:- Daily , Weekly | |
| Add ORC to Watchlist: View: Get Complete ORC Trend Analysis ➞ | |
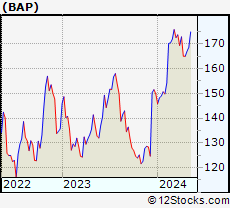 | BAP Credicorp Ltd |
| Sector: Financials | |
| SubSector: Banks - Regional | |
| MarketCap: 20774.1 Millions | |
| Recent Price: 261.91 Smart Investing & Trading Score: 50 | |
| Day Percent Change: -5.88595% Day Change: 2.04 | |
| Week Change: -0.859263% Year-to-date Change: 50.2% | |
| BAP Links: Profile News Message Board | |
| Charts:- Daily , Weekly | |
| Add BAP to Watchlist: View: Get Complete BAP Trend Analysis ➞ | |
 | RLI RLI Corp |
| Sector: Financials | |
| SubSector: Insurance - Property & Casualty | |
| MarketCap: 6159.92 Millions | |
| Recent Price: 65.68 Smart Investing & Trading Score: 40 | |
| Day Percent Change: 0.412781% Day Change: 0.44 | |
| Week Change: -0.860377% Year-to-date Change: -19.2% | |
| RLI Links: Profile News Message Board | |
| Charts:- Daily , Weekly | |
| Add RLI to Watchlist: View: Get Complete RLI Trend Analysis ➞ | |
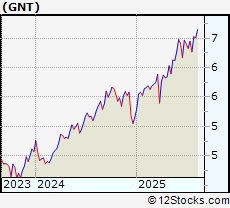 | GNT GAMCO Natural Resources, Gold & Income Trust |
| Sector: Financials | |
| SubSector: Closed-End Fund - Equity | |
| MarketCap: 111.6 Millions | |
| Recent Price: 6.89 Smart Investing & Trading Score: 40 | |
| Day Percent Change: 0% Day Change: 0.04 | |
| Week Change: -0.863309% Year-to-date Change: 34.4% | |
| GNT Links: Profile News Message Board | |
| Charts:- Daily , Weekly | |
| Add GNT to Watchlist: View: Get Complete GNT Trend Analysis ➞ | |
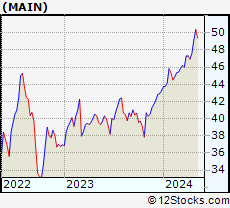 | MAIN Main Street Capital Corporation |
| Sector: Financials | |
| SubSector: Asset Management | |
| MarketCap: 5948.91 Millions | |
| Recent Price: 66.13 Smart Investing & Trading Score: 50 | |
| Day Percent Change: 0.516796% Day Change: 0.26 | |
| Week Change: -0.869435% Year-to-date Change: 16.8% | |
| MAIN Links: Profile News Message Board | |
| Charts:- Daily , Weekly | |
| Add MAIN to Watchlist: View: Get Complete MAIN Trend Analysis ➞ | |
 | SYBT Stock Yards Bancorp Inc |
| Sector: Financials | |
| SubSector: Banks - Regional | |
| MarketCap: 2339 Millions | |
| Recent Price: 76.54 Smart Investing & Trading Score: 40 | |
| Day Percent Change: 3.13974% Day Change: -0.12 | |
| Week Change: -0.867763% Year-to-date Change: 9.8% | |
| SYBT Links: Profile News Message Board | |
| Charts:- Daily , Weekly | |
| Add SYBT to Watchlist: View: Get Complete SYBT Trend Analysis ➞ | |
| For tabular summary view of above stock list: Summary View ➞ 0 - 25 , 25 - 50 , 50 - 75 , 75 - 100 , 100 - 125 , 125 - 150 , 150 - 175 , 175 - 200 , 200 - 225 , 225 - 250 , 250 - 275 , 275 - 300 , 300 - 325 , 325 - 350 , 350 - 375 , 375 - 400 , 400 - 425 , 425 - 450 , 450 - 475 , 475 - 500 , 500 - 525 , 525 - 550 , 550 - 575 , 575 - 600 , 600 - 625 , 625 - 650 , 650 - 675 , 675 - 700 , 700 - 725 , 725 - 750 , 750 - 775 , 775 - 800 , 800 - 825 , 825 - 850 , 850 - 875 , 875 - 900 , 900 - 925 , 925 - 950 , 950 - 975 , 975 - 1000 , 1000 - 1025 , 1025 - 1050 , 1050 - 1075 , 1075 - 1100 , 1100 - 1125 , 1125 - 1150 , 1150 - 1175 , 1175 - 1200 , 1200 - 1225 , 1225 - 1250 , 1250 - 1275 , 1275 - 1300 , 1300 - 1325 , 1325 - 1350 , 1350 - 1375 , 1375 - 1400 , 1400 - 1425 , 1425 - 1450 , 1450 - 1475 , 1475 - 1500 , 1500 - 1525 , 1525 - 1550 | ||
| Click To Change The Sort Order: By Market Cap or Company Size Performance: Year-to-date, Week and Day | |
| Select Chart Type: | ||
|
Best Stocks Today 12Stocks.com |
© 2025 12Stocks.com Terms & Conditions Privacy Contact Us
All Information Provided Only For Education And Not To Be Used For Investing or Trading. See Terms & Conditions


One More Thing ... Get Best Stocks Delivered Daily!
Never Ever Miss A Move With Our Top Ten Stocks Lists
Find Best Stocks In Any Market - Bull or Bear Market
Take A Peek At Our Top Ten Stocks Lists: Daily, Weekly, Year-to-Date & Top Trends
Find Best Stocks In Any Market - Bull or Bear Market
Take A Peek At Our Top Ten Stocks Lists: Daily, Weekly, Year-to-Date & Top Trends
Financial Stocks With Best Up Trends [0-bearish to 100-bullish]: Better Home[100], AMREP Corp[100], PIMCO California[100], Torchmark [100], PIMCO California[100], Triumph Bancorp[100], StepStone [100], Radian [100], National Bank[100], PIMCO Municipal[100], MARA [100]
Best Financial Stocks Year-to-Date:
Insight Select[12384.6%], Oxford Lane[292.479%], Better Home[250.328%], Metalpha Technology[213.274%], Robinhood Markets[206.567%], Cipher Mining[145.528%], Mr. Cooper[133.957%], Banco Santander[130.037%], IHS Holding[117.61%], Deutsche Bank[114.776%], LoanDepot [110.733%] Best Financial Stocks This Week:
Colony Starwood[15929900%], Blackhawk Network[91300%], Macquarie Global[81662.9%], Credit Suisse[63241.6%], Pennsylvania Real[23823%], First Republic[22570.9%], Select ome[14000%], CorEnergy Infrastructure[6797.78%], FedNat Holding[5525%], BlackRock Municipal[5340%], BlackRock MuniYield[3379.04%] Best Financial Stocks Daily:
Better Home[13.3451%], AMREP Corp[11.992%], PIMCO California[11.9545%], Torchmark [11.8363%], Forge Global[11.5409%], PIMCO California[11.4754%], BlackRock Muni[10.8108%], Blackrock MuniYield[10.72%], Triumph Bancorp[10.2661%], StepStone [8.74771%], BlackRock MuniYield[8.15348%]