
 Login Sign Up


| |||||
 |  | ||||

| 12Stocks.com Market Intelligence |
Best Financial Stocks
| In a hurry? Financial Stocks Lists: Performance Trends Table, Stock Charts
Sort Financial stocks: Daily, Weekly, Year-to-Date, Market Cap & Trends. Filter Financial stocks list by size:All Financial Large Mid-Range Small & MicroCap |
| 12Stocks.com Financial Stocks Performances & Trends Daily | |||||||||
|
|  The overall Smart Investing & Trading Score is 46 (0-bearish to 100-bullish) which puts Financial sector in short term neutral trend. The Smart Investing & Trading Score from previous trading session is 68 and hence a deterioration of trend.
| ||||||||
Here are the Smart Investing & Trading Scores of the most requested Financial stocks at 12Stocks.com (click stock name for detailed review):
|


| 12Stocks.com: Investing in Financial sector with Stocks | |
|
The following table helps investors and traders sort through current performance and trends (as measured by Smart Investing & Trading Score) of various
stocks in the Financial sector. Quick View: Move mouse or cursor over stock symbol (ticker) to view short-term Technical chart and over stock name to view long term chart. Click on  to add stock symbol to your watchlist and to add stock symbol to your watchlist and  to view watchlist. Click on any ticker or stock name for detailed market intelligence report for that stock. to view watchlist. Click on any ticker or stock name for detailed market intelligence report for that stock. |
12Stocks.com Performance of Stocks in Financial Sector
| Ticker | Stock Name | Watchlist | Category | Recent Price | Smart Investing & Trading Score | Change % | Weekly Change% |
| DMB | BNY |   | Asset Mgmt | 9.98 | 28 | -0.50% | -0.10% |
| STEP | StepStone | | Asset Mgmt | 35.38 | 36 | -1.16% | -0.10% |
| HCVI | Hennessy Capital | | SPAC | 10.47 | 41 | 0.00% | -0.10% |
| TOWN | TowneBank | | Regional Banks | 26.97 | 67 | -2.81% | -0.11% |
| VVR | Invesco Senior | | Closed-End Fund - Debt | 4.25 | 34 | -0.35% | -0.12% |
| MAV | Pioneer Municipal | | Closed-End Fund - Debt | 7.81 | 10 | -0.38% | -0.13% |
| VKQ | Invesco Municipal | | Closed-End Fund - Debt | 9.21 | 30 | -1.10% | -0.13% |
| XYF | X | | Credit Services | 3.77 | 25 | -1.44% | -0.13% |
| FFC | Flaherty & Crumrine Preferred Securities ome Fund | | Closed-End Fund - Debt | 13.93 | 23 | -1.21% | -0.14% |
| HBCP | Home Bancorp | | S&L | 36.04 | 47 | -1.21% | -0.14% |
| SOR | Source Capital | | Closed-End Fund - Equity | 41.25 | 68 | -1.29% | -0.15% |
| WFC | Wells Fargo | | Banks | 60.24 | 70 | -0.59% | -0.17% |
| RWT | Redwood Trust | | Mortgage | 5.67 | 42 | -1.56% | -0.18% |
| CBU | Community Bank | | Regional Banks | 44.42 | 60 | -2.05% | -0.18% |
| UNB | Union Bankshares | | Regional Banks | 27.55 | 42 | -0.76% | -0.18% |
| AMTB | Amerant Bancorp | | Regional Banks | 22.14 | 60 | -2.55% | -0.18% |
| KCGI | Kensington Capital | | SPAC | 10.91 | 41 | 0.00% | -0.18% |
| DSU | BlackRock Debt | | Closed-End Fund - Debt | 10.51 | 25 | -1.50% | -0.19% |
| DTF | DTF Tax-Free | | Closed-End Fund - Debt | 10.69 | 55 | -0.51% | -0.19% |
| CONX | CONX | | SPAC | 10.58 | 25 | -0.09% | -0.19% |
| UNM | Unum | | Insurance | 51.25 | 43 | -1.39% | -0.21% |
| WPC | W. P. | | REIT - | 56.09 | 60 | -0.66% | -0.21% |
| BBDO | Banco Bradesco | | Foreign Banks | 2.33 | 27 | 0.00% | -0.21% |
| AGO | Assured Guaranty | | Insurance | 77.35 | 25 | -1.44% | -0.22% |
| CCBG | Capital City | | Regional Banks | 27.03 | 52 | -0.84% | -0.22% |
| For chart view version of above stock list: Chart View ➞ 0 - 25 , 25 - 50 , 50 - 75 , 75 - 100 , 100 - 125 , 125 - 150 , 150 - 175 , 175 - 200 , 200 - 225 , 225 - 250 , 250 - 275 , 275 - 300 , 300 - 325 , 325 - 350 , 350 - 375 , 375 - 400 , 400 - 425 , 425 - 450 , 450 - 475 , 475 - 500 , 500 - 525 , 525 - 550 , 550 - 575 , 575 - 600 , 600 - 625 , 625 - 650 , 650 - 675 , 675 - 700 , 700 - 725 , 725 - 750 , 750 - 775 , 775 - 800 , 800 - 825 , 825 - 850 , 850 - 875 , 875 - 900 , 900 - 925 , 925 - 950 , 950 - 975 , 975 - 1000 , 1000 - 1025 , 1025 - 1050 , 1050 - 1075 , 1075 - 1100 , 1100 - 1125 , 1125 - 1150 , 1150 - 1175 | ||
 | Click To Change The Sort Order: By Market Cap or Company Size Performance: Year-to-date, Week and Day |  |
|
Get the most comprehensive stock market coverage daily at 12Stocks.com ➞ Best Stocks Today ➞ Best Stocks Weekly ➞ Best Stocks Year-to-Date ➞ Best Stocks Trends ➞  Best Stocks Today 12Stocks.com Best Nasdaq Stocks ➞ Best S&P 500 Stocks ➞ Best Tech Stocks ➞ Best Biotech Stocks ➞ |
| Detailed Overview of Financial Stocks |
| Financial Technical Overview, Leaders & Laggards, Top Financial ETF Funds & Detailed Financial Stocks List, Charts, Trends & More |
| Financial Sector: Technical Analysis, Trends & YTD Performance | |
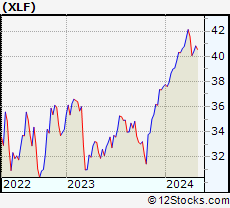
| Financial sector is composed of stocks
from banks, brokers, insurance, REITs
and services subsectors. Financial sector, as represented by XLF, an exchange-traded fund [ETF] that holds basket of Financial stocks (e.g, Bank of America, Goldman Sachs) is up by 8.14% and is currently outperforming the overall market by 3.89% year-to-date. Below is a quick view of Technical charts and trends: |
|
 XLF Weekly Chart |
|
| Long Term Trend: Very Good | |
| Medium Term Trend: Not Good | |
 XLF Daily Chart |
|
| Short Term Trend: Not Good | |
| Overall Trend Score: 46 | |
| YTD Performance: 8.14% | |
| **Trend Scores & Views Are Only For Educational Purposes And Not For Investing | |
| 12Stocks.com: Top Performing Financial Sector Stocks | ||||||||||||||||||||||||||||||||||||||||||||||||
 The top performing Financial sector stocks year to date are
Now, more recently, over last week, the top performing Financial sector stocks on the move are


|
||||||||||||||||||||||||||||||||||||||||||||||||
| 12Stocks.com: Investing in Financial Sector using Exchange Traded Funds | |
|
The following table shows list of key exchange traded funds (ETF) that
help investors track Financial Index. For detailed view, check out our ETF Funds section of our website. Quick View: Move mouse or cursor over ETF symbol (ticker) to view short-term Technical chart and over ETF name to view long term chart. Click on ticker or stock name for detailed view. Click on to add stock symbol to your watchlist and to view watchlist. |
12Stocks.com List of ETFs that track Financial Index
| Ticker | ETF Name | Watchlist | Recent Price | Smart Investing & Trading Score | Change % | Week % | Year-to-date % |
| XLF | Financial | | 40.66 | 46 | -1.12 | 0.69 | 8.14% |
| IAI | Broker-Dealers & Secs | | 111.36 | 33 | -1.36 | 0.3 | 2.61% |
| KBE | Bank | | 45.20 | 48 | -1.64 | 1.79 | -1.77% |
| FAS | Financial Bull 3X | | 99.61 | 48 | -3.48 | 1.72 | 20.52% |
| FAZ | Financial Bear 3X | | 11.00 | 47 | 3.68 | -1.79 | -19.53% |
| UYG | Financials | | 63.13 | 56 | -2.49 | 1.11 | 14.37% |
| KIE | Insurance | | 49.00 | 51 | -1.35 | -0.16 | 8.36% |
| 12Stocks.com: Charts, Trends, Fundamental Data and Performances of Financial Stocks | |
|
We now take in-depth look at all Financial stocks including charts, multi-period performances and overall trends (as measured by Smart Investing & Trading Score). One can sort Financial stocks (click link to choose) by Daily, Weekly and by Year-to-Date performances. Also, one can sort by size of the company or by market capitalization. |
| Select Your Default Chart Type: | |||||
| |||||
| Click on stock symbol or name for detailed view. Click on to add stock symbol to your watchlist and to view watchlist. Quick View: Move mouse or cursor over "Daily" to quickly view daily Technical stock chart and over "Weekly" to view weekly Technical stock chart. | |||||

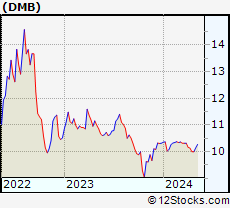 | DMB BNY Mellon Municipal Bond Infrastructure Fund, Inc. |
| Sector: Financials | |
| SubSector: Asset Management | |
| MarketCap: 202.503 Millions | |
| Recent Price: 9.98 Smart Investing & Trading Score: 28 | |
| Day Percent Change: -0.50% Day Change: -0.05 | |
| Week Change: -0.1% Year-to-date Change: -3.2% | |
| DMB Links: Profile News Message Board | |
| Charts:- Daily , Weekly | |
| Add DMB to Watchlist: View: Get Complete DMB Trend Analysis ➞ | |
 | STEP StepStone Group Inc. |
| Sector: Financials | |
| SubSector: Asset Management | |
| MarketCap: 30757 Millions | |
| Recent Price: 35.38 Smart Investing & Trading Score: 36 | |
| Day Percent Change: -1.16% Day Change: -0.41 | |
| Week Change: -0.1% Year-to-date Change: 11.1% | |
| STEP Links: Profile News Message Board | |
| Charts:- Daily , Weekly | |
| Add STEP to Watchlist: View: Get Complete STEP Trend Analysis ➞ | |
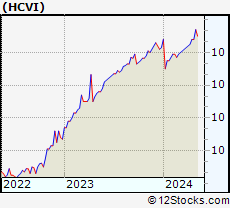 | HCVI Hennessy Capital Investment Corp. VI |
| Sector: Financials | |
| SubSector: SPAC | |
| MarketCap: 467 Millions | |
| Recent Price: 10.47 Smart Investing & Trading Score: 41 | |
| Day Percent Change: 0.00% Day Change: 0.00 | |
| Week Change: -0.1% Year-to-date Change: 0.4% | |
| HCVI Links: Profile News Message Board | |
| Charts:- Daily , Weekly | |
| Add HCVI to Watchlist: View: Get Complete HCVI Trend Analysis ➞ | |
 | TOWN TowneBank |
| Sector: Financials | |
| SubSector: Regional - Mid-Atlantic Banks | |
| MarketCap: 1344.09 Millions | |
| Recent Price: 26.97 Smart Investing & Trading Score: 67 | |
| Day Percent Change: -2.81% Day Change: -0.78 | |
| Week Change: -0.11% Year-to-date Change: -9.4% | |
| TOWN Links: Profile News Message Board | |
| Charts:- Daily , Weekly | |
| Add TOWN to Watchlist: View: Get Complete TOWN Trend Analysis ➞ | |
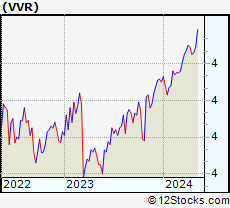 | VVR Invesco Senior Income Trust |
| Sector: Financials | |
| SubSector: Closed-End Fund - Debt | |
| MarketCap: 507.307 Millions | |
| Recent Price: 4.25 Smart Investing & Trading Score: 34 | |
| Day Percent Change: -0.35% Day Change: -0.01 | |
| Week Change: -0.12% Year-to-date Change: 3.5% | |
| VVR Links: Profile News Message Board | |
| Charts:- Daily , Weekly | |
| Add VVR to Watchlist: View: Get Complete VVR Trend Analysis ➞ | |
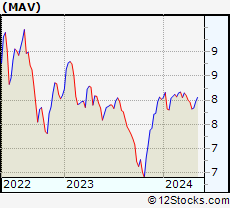 | MAV Pioneer Municipal High Income Advantage Trust |
| Sector: Financials | |
| SubSector: Closed-End Fund - Debt | |
| MarketCap: 219.807 Millions | |
| Recent Price: 7.81 Smart Investing & Trading Score: 10 | |
| Day Percent Change: -0.38% Day Change: -0.03 | |
| Week Change: -0.13% Year-to-date Change: -2.6% | |
| MAV Links: Profile News Message Board | |
| Charts:- Daily , Weekly | |
| Add MAV to Watchlist: View: Get Complete MAV Trend Analysis ➞ | |
 | VKQ Invesco Municipal Trust |
| Sector: Financials | |
| SubSector: Closed-End Fund - Debt | |
| MarketCap: 577.507 Millions | |
| Recent Price: 9.21 Smart Investing & Trading Score: 30 | |
| Day Percent Change: -1.10% Day Change: -0.10 | |
| Week Change: -0.13% Year-to-date Change: -3.4% | |
| VKQ Links: Profile News Message Board | |
| Charts:- Daily , Weekly | |
| Add VKQ to Watchlist: View: Get Complete VKQ Trend Analysis ➞ | |
 | XYF X Financial |
| Sector: Financials | |
| SubSector: Credit Services | |
| MarketCap: 168.008 Millions | |
| Recent Price: 3.77 Smart Investing & Trading Score: 25 | |
| Day Percent Change: -1.44% Day Change: -0.06 | |
| Week Change: -0.13% Year-to-date Change: 3.1% | |
| XYF Links: Profile News Message Board | |
| Charts:- Daily , Weekly | |
| Add XYF to Watchlist: View: Get Complete XYF Trend Analysis ➞ | |
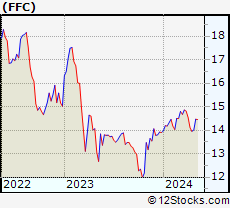 | FFC Flaherty & Crumrine Preferred Securities Income Fund Inc. |
| Sector: Financials | |
| SubSector: Closed-End Fund - Debt | |
| MarketCap: 635.107 Millions | |
| Recent Price: 13.93 Smart Investing & Trading Score: 23 | |
| Day Percent Change: -1.21% Day Change: -0.17 | |
| Week Change: -0.14% Year-to-date Change: 0.2% | |
| FFC Links: Profile News Message Board | |
| Charts:- Daily , Weekly | |
| Add FFC to Watchlist: View: Get Complete FFC Trend Analysis ➞ | |
 | HBCP Home Bancorp, Inc. |
| Sector: Financials | |
| SubSector: Savings & Loans | |
| MarketCap: 206.83 Millions | |
| Recent Price: 36.04 Smart Investing & Trading Score: 47 | |
| Day Percent Change: -1.21% Day Change: -0.44 | |
| Week Change: -0.14% Year-to-date Change: -14.2% | |
| HBCP Links: Profile News Message Board | |
| Charts:- Daily , Weekly | |
| Add HBCP to Watchlist: View: Get Complete HBCP Trend Analysis ➞ | |
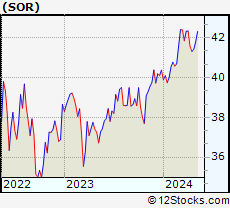 | SOR Source Capital, Inc. |
| Sector: Financials | |
| SubSector: Closed-End Fund - Equity | |
| MarketCap: 229.147 Millions | |
| Recent Price: 41.25 Smart Investing & Trading Score: 68 | |
| Day Percent Change: -1.29% Day Change: -0.54 | |
| Week Change: -0.15% Year-to-date Change: 2.2% | |
| SOR Links: Profile News Message Board | |
| Charts:- Daily , Weekly | |
| Add SOR to Watchlist: View: Get Complete SOR Trend Analysis ➞ | |
 | WFC Wells Fargo & Company |
| Sector: Financials | |
| SubSector: Money Center Banks | |
| MarketCap: 129138 Millions | |
| Recent Price: 60.24 Smart Investing & Trading Score: 70 | |
| Day Percent Change: -0.59% Day Change: -0.36 | |
| Week Change: -0.17% Year-to-date Change: 22.4% | |
| WFC Links: Profile News Message Board | |
| Charts:- Daily , Weekly | |
| Add WFC to Watchlist: View: Get Complete WFC Trend Analysis ➞ | |
 | RWT Redwood Trust, Inc. |
| Sector: Financials | |
| SubSector: Mortgage Investment | |
| MarketCap: 674.739 Millions | |
| Recent Price: 5.67 Smart Investing & Trading Score: 42 | |
| Day Percent Change: -1.56% Day Change: -0.09 | |
| Week Change: -0.18% Year-to-date Change: -23.5% | |
| RWT Links: Profile News Message Board | |
| Charts:- Daily , Weekly | |
| Add RWT to Watchlist: View: Get Complete RWT Trend Analysis ➞ | |
 | CBU Community Bank System, Inc. |
| Sector: Financials | |
| SubSector: Regional - Midwest Banks | |
| MarketCap: 2787.8 Millions | |
| Recent Price: 44.42 Smart Investing & Trading Score: 60 | |
| Day Percent Change: -2.05% Day Change: -0.93 | |
| Week Change: -0.18% Year-to-date Change: -14.8% | |
| CBU Links: Profile News Message Board | |
| Charts:- Daily , Weekly | |
| Add CBU to Watchlist: View: Get Complete CBU Trend Analysis ➞ | |
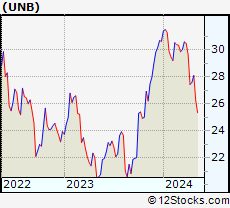 | UNB Union Bankshares, Inc. |
| Sector: Financials | |
| SubSector: Regional - Northeast Banks | |
| MarketCap: 130.499 Millions | |
| Recent Price: 27.55 Smart Investing & Trading Score: 42 | |
| Day Percent Change: -0.76% Day Change: -0.21 | |
| Week Change: -0.18% Year-to-date Change: -10.1% | |
| UNB Links: Profile News Message Board | |
| Charts:- Daily , Weekly | |
| Add UNB to Watchlist: View: Get Complete UNB Trend Analysis ➞ | |
 | AMTB Amerant Bancorp Inc. |
| Sector: Financials | |
| SubSector: Regional - Midwest Banks | |
| MarketCap: 653.87 Millions | |
| Recent Price: 22.14 Smart Investing & Trading Score: 60 | |
| Day Percent Change: -2.55% Day Change: -0.58 | |
| Week Change: -0.18% Year-to-date Change: -9.9% | |
| AMTB Links: Profile News Message Board | |
| Charts:- Daily , Weekly | |
| Add AMTB to Watchlist: View: Get Complete AMTB Trend Analysis ➞ | |
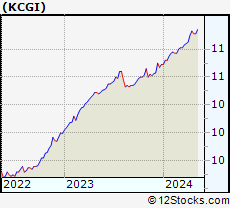 | KCGI Kensington Capital Acquisition Corp. V |
| Sector: Financials | |
| SubSector: SPAC | |
| MarketCap: 365 Millions | |
| Recent Price: 10.91 Smart Investing & Trading Score: 41 | |
| Day Percent Change: 0.00% Day Change: 0.00 | |
| Week Change: -0.18% Year-to-date Change: 2.1% | |
| KCGI Links: Profile News Message Board | |
| Charts:- Daily , Weekly | |
| Add KCGI to Watchlist: View: Get Complete KCGI Trend Analysis ➞ | |
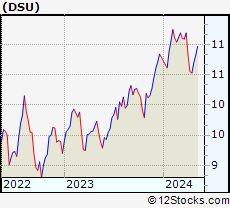 | DSU BlackRock Debt Strategies Fund, Inc. |
| Sector: Financials | |
| SubSector: Closed-End Fund - Debt | |
| MarketCap: 347.307 Millions | |
| Recent Price: 10.51 Smart Investing & Trading Score: 25 | |
| Day Percent Change: -1.50% Day Change: -0.16 | |
| Week Change: -0.19% Year-to-date Change: -2.6% | |
| DSU Links: Profile News Message Board | |
| Charts:- Daily , Weekly | |
| Add DSU to Watchlist: View: Get Complete DSU Trend Analysis ➞ | |
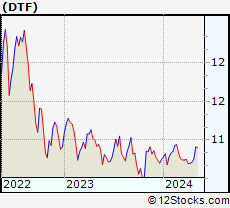 | DTF DTF Tax-Free Income Inc. |
| Sector: Financials | |
| SubSector: Closed-End Fund - Debt | |
| MarketCap: 106.407 Millions | |
| Recent Price: 10.69 Smart Investing & Trading Score: 55 | |
| Day Percent Change: -0.51% Day Change: -0.05 | |
| Week Change: -0.19% Year-to-date Change: -0.6% | |
| DTF Links: Profile News Message Board | |
| Charts:- Daily , Weekly | |
| Add DTF to Watchlist: View: Get Complete DTF Trend Analysis ➞ | |
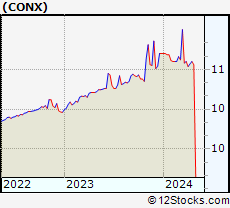 | CONX CONX Corp. |
| Sector: Financials | |
| SubSector: SPAC | |
| MarketCap: 223 Millions | |
| Recent Price: 10.58 Smart Investing & Trading Score: 25 | |
| Day Percent Change: -0.09% Day Change: -0.01 | |
| Week Change: -0.19% Year-to-date Change: -1.1% | |
| CONX Links: Profile News Message Board | |
| Charts:- Daily , Weekly | |
| Add CONX to Watchlist: View: Get Complete CONX Trend Analysis ➞ | |
 | UNM Unum Group |
| Sector: Financials | |
| SubSector: Accident & Health Insurance | |
| MarketCap: 2760.9 Millions | |
| Recent Price: 51.25 Smart Investing & Trading Score: 43 | |
| Day Percent Change: -1.39% Day Change: -0.72 | |
| Week Change: -0.21% Year-to-date Change: 13.3% | |
| UNM Links: Profile News Message Board | |
| Charts:- Daily , Weekly | |
| Add UNM to Watchlist: View: Get Complete UNM Trend Analysis ➞ | |
 | WPC W. P. Carey Inc. |
| Sector: Financials | |
| SubSector: REIT - Diversified | |
| MarketCap: 9560.03 Millions | |
| Recent Price: 56.09 Smart Investing & Trading Score: 60 | |
| Day Percent Change: -0.66% Day Change: -0.37 | |
| Week Change: -0.21% Year-to-date Change: -13.5% | |
| WPC Links: Profile News Message Board | |
| Charts:- Daily , Weekly | |
| Add WPC to Watchlist: View: Get Complete WPC Trend Analysis ➞ | |
 | BBDO Banco Bradesco S.A. |
| Sector: Financials | |
| SubSector: Foreign Regional Banks | |
| MarketCap: 27711.4 Millions | |
| Recent Price: 2.33 Smart Investing & Trading Score: 27 | |
| Day Percent Change: 0.00% Day Change: 0.00 | |
| Week Change: -0.21% Year-to-date Change: -26.9% | |
| BBDO Links: Profile News Message Board | |
| Charts:- Daily , Weekly | |
| Add BBDO to Watchlist: View: Get Complete BBDO Trend Analysis ➞ | |
 | AGO Assured Guaranty Ltd. |
| Sector: Financials | |
| SubSector: Surety & Title Insurance | |
| MarketCap: 2133.18 Millions | |
| Recent Price: 77.35 Smart Investing & Trading Score: 25 | |
| Day Percent Change: -1.44% Day Change: -1.13 | |
| Week Change: -0.22% Year-to-date Change: 3.4% | |
| AGO Links: Profile News Message Board | |
| Charts:- Daily , Weekly | |
| Add AGO to Watchlist: View: Get Complete AGO Trend Analysis ➞ | |
 | CCBG Capital City Bank Group, Inc. |
| Sector: Financials | |
| SubSector: Regional - Mid-Atlantic Banks | |
| MarketCap: 314.459 Millions | |
| Recent Price: 27.03 Smart Investing & Trading Score: 52 | |
| Day Percent Change: -0.84% Day Change: -0.23 | |
| Week Change: -0.22% Year-to-date Change: -8.2% | |
| CCBG Links: Profile News Message Board | |
| Charts:- Daily , Weekly | |
| Add CCBG to Watchlist: View: Get Complete CCBG Trend Analysis ➞ | |
| For tabular summary view of above stock list: Summary View ➞ 0 - 25 , 25 - 50 , 50 - 75 , 75 - 100 , 100 - 125 , 125 - 150 , 150 - 175 , 175 - 200 , 200 - 225 , 225 - 250 , 250 - 275 , 275 - 300 , 300 - 325 , 325 - 350 , 350 - 375 , 375 - 400 , 400 - 425 , 425 - 450 , 450 - 475 , 475 - 500 , 500 - 525 , 525 - 550 , 550 - 575 , 575 - 600 , 600 - 625 , 625 - 650 , 650 - 675 , 675 - 700 , 700 - 725 , 725 - 750 , 750 - 775 , 775 - 800 , 800 - 825 , 825 - 850 , 850 - 875 , 875 - 900 , 900 - 925 , 925 - 950 , 950 - 975 , 975 - 1000 , 1000 - 1025 , 1025 - 1050 , 1050 - 1075 , 1075 - 1100 , 1100 - 1125 , 1125 - 1150 , 1150 - 1175 | ||
| Click To Change The Sort Order: By Market Cap or Company Size Performance: Year-to-date, Week and Day | |
| Select Chart Type: | ||
|
Best Stocks Today 12Stocks.com |
© 2024 12Stocks.com Terms & Conditions Privacy Contact Us
All Information Provided Only For Education And Not To Be Used For Investing or Trading. See Terms & Conditions


One More Thing ... Get Best Stocks Delivered Daily!
Never Ever Miss A Move With Our Top Ten Stocks Lists
Find Best Stocks In Any Market - Bull or Bear Market
Take A Peek At Our Top Ten Stocks Lists: Daily, Weekly, Year-to-Date & Top Trends
Find Best Stocks In Any Market - Bull or Bear Market
Take A Peek At Our Top Ten Stocks Lists: Daily, Weekly, Year-to-Date & Top Trends
Financial Stocks With Best Up Trends [0-bearish to 100-bullish]: Deutsche Bank[100], Virtu [100], Trustmark [100], B. Riley[100], TCG BDC[100], Third Coast[100], LCNB [100], UDR [100], Fidus [100], Equity Residential[100], Capital Southwest[100]
Best Financial Stocks Year-to-Date:
Root [465%], Hippo [126.07%], Gladstone Capital[98.88%], Banco Macro[75.09%], Grupo Financiero[73.76%], Banco BBVA[67%], Yiren Digital[62.5%], Heritage Insurance[59.2%], Fidelis Insurance[54.93%], EverQuote [53.35%], First [51.34%] Best Financial Stocks This Week:
B. Riley[49.67%], Oportun [40.95%], Globe Life[14.66%], Root [14.33%], Provident Bancorp[13.67%], Deutsche Bank[12.16%], First Citizens[11.92%], TOP [11.49%], Cipher Mining[11.33%], Trustmark [10.91%], Barclays [10.21%] Best Financial Stocks Daily:
Deutsche Bank[8.28%], Barclays [7.34%], First Citizens[6.99%], MicroSectors Gold[5.71%], Meta [4.35%], Ladder Capital[4.14%], Bridge [3.93%], CNFinance [3.85%], Hanmi [3.83%], Grupo Financiero[3.20%], HarborOne Bancorp[3.18%]