
 Login Sign Up


| |||||
 |  | ||||

| 12Stocks.com Market Intelligence |
Best Financial Stocks
| In a hurry? Financial Stocks Lists: Performance Trends Table, Stock Charts
Sort Financial stocks: Daily, Weekly, Year-to-Date, Market Cap & Trends. Filter Financial stocks list by size:All Financial Large Mid-Range Small & MicroCap |
| 12Stocks.com Financial Stocks Performances & Trends Daily | |||||||||
|
|  The overall Smart Investing & Trading Score is 56 (0-bearish to 100-bullish) which puts Financial sector in short term neutral trend. The Smart Investing & Trading Score from previous trading session is 36 and hence an improvement of trend.
| ||||||||
Here are the Smart Investing & Trading Scores of the most requested Financial stocks at 12Stocks.com (click stock name for detailed review):
|


| 12Stocks.com: Investing in Financial sector with Stocks | |
|
The following table helps investors and traders sort through current performance and trends (as measured by Smart Investing & Trading Score) of various
stocks in the Financial sector. Quick View: Move mouse or cursor over stock symbol (ticker) to view short-term Technical chart and over stock name to view long term chart. Click on  to add stock symbol to your watchlist and to add stock symbol to your watchlist and  to view watchlist. Click on any ticker or stock name for detailed market intelligence report for that stock. to view watchlist. Click on any ticker or stock name for detailed market intelligence report for that stock. |
12Stocks.com Performance of Stocks in Financial Sector
| Ticker | Stock Name | Watchlist | Category | Recent Price | Smart Investing & Trading Score | Change % | Weekly Change% |
| HIFS | Hingham Institution |   | S&L | 167.33 | 52 | 1.44% | 1.31% |
| IBCP | Independent Bank | | Regional Banks | 23.58 | 32 | 1.64% | 1.29% |
| PROV | Provident | | S&L | 13.44 | 40 | 0.37% | 1.28% |
| HOMB | Home Bancshares | | Banks | 23.22 | 42 | 3.52% | 1.26% |
| FFIC | Flushing | | S&L | 11.33 | 35 | 1.71% | 1.25% |
| USCB | USCB | | Banks - Regional | 10.63 | 42 | 1.05% | 1.24% |
| CHCO | City Holding | | Regional Banks | 99.98 | 42 | 1.30% | 1.21% |
| BMRC | Bank of Marin Bancorp | | Regional Banks | 15.17 | 52 | 1.13% | 1.20% |
| UFCS | United Fire | | Insurance | 22.03 | 64 | 1.94% | 1.19% |
| FMBH | First Mid | | Regional Banks | 29.86 | 32 | 1.84% | 1.19% |
| NKX | Nuveen California | | Asset Mgmt | 11.99 | 68 | 0.76% | 1.18% |
| WF | Woori | | Foreign Banks | 29.36 | 25 | 1.80% | 1.17% |
| GLRE | Greenlight Capital | | Insurance | 12.25 | 49 | 0.74% | 1.16% |
| HIX | Western Asset | | Closed-End Fund - Debt | 4.38 | 42 | 0.46% | 1.15% |
| EIG | Employers | | Insurance | 43.10 | 58 | 1.46% | 1.15% |
| WELL | Welltower | | REIT | 90.81 | 56 | 1.24% | 1.14% |
| CSWC | Capital Southwest | | Asset Mgmt | 24.78 | 81 | -0.04% | 1.10% |
| LKFN | Lakeland | | Regional Banks | 59.12 | 23 | 0.75% | 1.09% |
| OCSL | Oaktree Specialty | | Credit Services | 19.48 | 50 | 0.26% | 1.09% |
| CNO | CNO | | Insurance | 25.69 | 32 | 2.27% | 1.06% |
| WTBA | West Ban | | Regional - Southwest Banks | 16.26 | 52 | 2.91% | 1.06% |
| HCI | HCI | | Insurance | 110.51 | 56 | 0.55% | 1.06% |
| CEF | Sprott Physical | | Asset Mgmt | 22.23 | 83 | 0.05% | 1.05% |
| CASH | Meta | | S&L | 49.00 | 35 | 1.03% | 1.01% |
| SLRC | Solar Capital | | Investments | 14.98 | 32 | 0.47% | 1.01% |
| For chart view version of above stock list: Chart View ➞ 0 - 25 , 25 - 50 , 50 - 75 , 75 - 100 , 100 - 125 , 125 - 150 , 150 - 175 , 175 - 200 , 200 - 225 , 225 - 250 , 250 - 275 , 275 - 300 , 300 - 325 , 325 - 350 , 350 - 375 , 375 - 400 , 400 - 425 , 425 - 450 , 450 - 475 , 475 - 500 , 500 - 525 , 525 - 550 , 550 - 575 , 575 - 600 , 600 - 625 , 625 - 650 , 650 - 675 , 675 - 700 , 700 - 725 , 725 - 750 , 750 - 775 , 775 - 800 , 800 - 825 , 825 - 850 , 850 - 875 , 875 - 900 , 900 - 925 , 925 - 950 , 950 - 975 , 975 - 1000 , 1000 - 1025 , 1025 - 1050 , 1050 - 1075 , 1075 - 1100 , 1100 - 1125 , 1125 - 1150 , 1150 - 1175 , 1175 - 1200 , 1200 - 1225 , 1225 - 1250 | ||
 | Click To Change The Sort Order: By Market Cap or Company Size Performance: Year-to-date, Week and Day |  |
|
Get the most comprehensive stock market coverage daily at 12Stocks.com ➞ Best Stocks Today ➞ Best Stocks Weekly ➞ Best Stocks Year-to-Date ➞ Best Stocks Trends ➞  Best Stocks Today 12Stocks.com Best Nasdaq Stocks ➞ Best S&P 500 Stocks ➞ Best Tech Stocks ➞ Best Biotech Stocks ➞ |
| Detailed Overview of Financial Stocks |
| Financial Technical Overview, Leaders & Laggards, Top Financial ETF Funds & Detailed Financial Stocks List, Charts, Trends & More |
| Financial Sector: Technical Analysis, Trends & YTD Performance | |
| Financial sector is composed of stocks
from banks, brokers, insurance, REITs
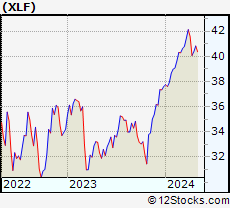
and services subsectors. Financial sector, as represented by XLF, an exchange-traded fund [ETF] that holds basket of Financial stocks (e.g, Bank of America, Goldman Sachs) is up by 5.93% and is currently outperforming the overall market by 1.74% year-to-date. Below is a quick view of Technical charts and trends: |
|
 XLF Weekly Chart |
|
| Long Term Trend: Good | |
| Medium Term Trend: Not Good | |
 XLF Daily Chart |
|
| Short Term Trend: Deteriorating | |
| Overall Trend Score: 56 | |
| YTD Performance: 5.93% | |
| **Trend Scores & Views Are Only For Educational Purposes And Not For Investing | |
| 12Stocks.com: Top Performing Financial Sector Stocks | ||||||||||||||||||||||||||||||||||||||||||||||||
 The top performing Financial sector stocks year to date are
Now, more recently, over last week, the top performing Financial sector stocks on the move are


|
||||||||||||||||||||||||||||||||||||||||||||||||
| 12Stocks.com: Investing in Financial Sector using Exchange Traded Funds | |
|
The following table shows list of key exchange traded funds (ETF) that
help investors track Financial Index. For detailed view, check out our ETF Funds section of our website. Quick View: Move mouse or cursor over ETF symbol (ticker) to view short-term Technical chart and over ETF name to view long term chart. Click on ticker or stock name for detailed view. Click on to add stock symbol to your watchlist and to view watchlist. |
12Stocks.com List of ETFs that track Financial Index
| Ticker | ETF Name | Watchlist | Recent Price | Smart Investing & Trading Score | Change % | Week % | Year-to-date % |
| XLF | Financial | | 39.83 | 56 | 0.35 | -0.57 | 5.93% |
| IAI | Broker-Dealers & Secs | | 110.51 | 56 | 0.14 | -0.29 | 1.82% |
| IYF | Financials | | 90.04 | 56 | 0.61 | -0.56 | 5.42% |
| IYG | Financial Services | | 62.67 | 56 | 0.30 | -0.85 | 4.91% |
| KRE | Regional Banking | | 46.11 | 28 | 0.61 | -0.88 | -12.05% |
| IXG | Global Financials | | 82.33 | 48 | 0.45 | -0.4 | 4.77% |
| VFH | Financials | | 96.40 | 56 | 0.39 | -0.8 | 4.49% |
| KBE | Bank | | 43.40 | 30 | 0.70 | -0.89 | -5.69% |
| FAS | Financial Bull 3X | | 94.14 | 56 | 1.00 | -2.16 | 13.9% |
| FAZ | Financial Bear 3X | | 11.66 | 40 | -0.85 | 2.19 | -14.7% |
| UYG | Financials | | 60.75 | 56 | 0.70 | -1.17 | 10.05% |
| IAT | Regional Banks | | 39.74 | 27 | 0.28 | -1.73 | -5.02% |
| KIE | Insurance | | 48.28 | 51 | 1.17 | -0.08 | 6.77% |
| PSCF | SmallCap Financials | | 44.76 | 15 | -0.22 | -1.43 | -8.99% |
| EUFN | Europe Financials | | 21.87 | 56 | 0.28 | -0.09 | 4.34% |
| PGF | Financial Preferred | | 14.45 | 10 | -0.28 | -1.57 | -0.89% |
| 12Stocks.com: Charts, Trends, Fundamental Data and Performances of Financial Stocks | |
|
We now take in-depth look at all Financial stocks including charts, multi-period performances and overall trends (as measured by Smart Investing & Trading Score). One can sort Financial stocks (click link to choose) by Daily, Weekly and by Year-to-Date performances. Also, one can sort by size of the company or by market capitalization. |
| Select Your Default Chart Type: | |||||
| |||||
| Click on stock symbol or name for detailed view. Click on to add stock symbol to your watchlist and to view watchlist. Quick View: Move mouse or cursor over "Daily" to quickly view daily Technical stock chart and over "Weekly" to view weekly Technical stock chart. | |||||

 | HIFS Hingham Institution for Savings |
| Sector: Financials | |
| SubSector: Savings & Loans | |
| MarketCap: 341.93 Millions | |
| Recent Price: 167.33 Smart Investing & Trading Score: 52 | |
| Day Percent Change: 1.44% Day Change: 2.37 | |
| Week Change: 1.31% Year-to-date Change: -13.9% | |
| HIFS Links: Profile News Message Board | |
| Charts:- Daily , Weekly | |
| Add HIFS to Watchlist: View: Get Complete HIFS Trend Analysis ➞ | |
 | IBCP Independent Bank Corporation |
| Sector: Financials | |
| SubSector: Regional - Midwest Banks | |
| MarketCap: 273.67 Millions | |
| Recent Price: 23.58 Smart Investing & Trading Score: 32 | |
| Day Percent Change: 1.64% Day Change: 0.38 | |
| Week Change: 1.29% Year-to-date Change: -9.4% | |
| IBCP Links: Profile News Message Board | |
| Charts:- Daily , Weekly | |
| Add IBCP to Watchlist: View: Get Complete IBCP Trend Analysis ➞ | |
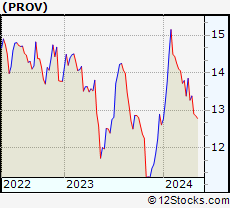 | PROV Provident Financial Holdings, Inc. |
| Sector: Financials | |
| SubSector: Savings & Loans | |
| MarketCap: 120.63 Millions | |
| Recent Price: 13.44 Smart Investing & Trading Score: 40 | |
| Day Percent Change: 0.37% Day Change: 0.05 | |
| Week Change: 1.28% Year-to-date Change: 6.6% | |
| PROV Links: Profile News Message Board | |
| Charts:- Daily , Weekly | |
| Add PROV to Watchlist: View: Get Complete PROV Trend Analysis ➞ | |
 | HOMB Home Bancshares, Inc. (Conway, AR) |
| Sector: Financials | |
| SubSector: Money Center Banks | |
| MarketCap: 2090.49 Millions | |
| Recent Price: 23.22 Smart Investing & Trading Score: 42 | |
| Day Percent Change: 3.52% Day Change: 0.79 | |
| Week Change: 1.26% Year-to-date Change: -8.3% | |
| HOMB Links: Profile News Message Board | |
| Charts:- Daily , Weekly | |
| Add HOMB to Watchlist: View: Get Complete HOMB Trend Analysis ➞ | |
 | FFIC Flushing Financial Corporation |
| Sector: Financials | |
| SubSector: Savings & Loans | |
| MarketCap: 336.43 Millions | |
| Recent Price: 11.33 Smart Investing & Trading Score: 35 | |
| Day Percent Change: 1.71% Day Change: 0.19 | |
| Week Change: 1.25% Year-to-date Change: -31.3% | |
| FFIC Links: Profile News Message Board | |
| Charts:- Daily , Weekly | |
| Add FFIC to Watchlist: View: Get Complete FFIC Trend Analysis ➞ | |
 | USCB USCB Financial Holdings, Inc. |
| Sector: Financials | |
| SubSector: Banks - Regional | |
| MarketCap: 198 Millions | |
| Recent Price: 10.63 Smart Investing & Trading Score: 42 | |
| Day Percent Change: 1.05% Day Change: 0.11 | |
| Week Change: 1.24% Year-to-date Change: -13.4% | |
| USCB Links: Profile News Message Board | |
| Charts:- Daily , Weekly | |
| Add USCB to Watchlist: View: Get Complete USCB Trend Analysis ➞ | |
 | CHCO City Holding Company |
| Sector: Financials | |
| SubSector: Regional - Mid-Atlantic Banks | |
| MarketCap: 1059.59 Millions | |
| Recent Price: 99.98 Smart Investing & Trading Score: 42 | |
| Day Percent Change: 1.30% Day Change: 1.28 | |
| Week Change: 1.21% Year-to-date Change: -9.3% | |
| CHCO Links: Profile News Message Board | |
| Charts:- Daily , Weekly | |
| Add CHCO to Watchlist: View: Get Complete CHCO Trend Analysis ➞ | |
 | BMRC Bank of Marin Bancorp |
| Sector: Financials | |
| SubSector: Regional - Pacific Banks | |
| MarketCap: 367.929 Millions | |
| Recent Price: 15.17 Smart Investing & Trading Score: 52 | |
| Day Percent Change: 1.13% Day Change: 0.17 | |
| Week Change: 1.2% Year-to-date Change: -31.1% | |
| BMRC Links: Profile News Message Board | |
| Charts:- Daily , Weekly | |
| Add BMRC to Watchlist: View: Get Complete BMRC Trend Analysis ➞ | |
 | UFCS United Fire Group, Inc. |
| Sector: Financials | |
| SubSector: Property & Casualty Insurance | |
| MarketCap: 862.812 Millions | |
| Recent Price: 22.03 Smart Investing & Trading Score: 64 | |
| Day Percent Change: 1.94% Day Change: 0.42 | |
| Week Change: 1.19% Year-to-date Change: 9.5% | |
| UFCS Links: Profile News Message Board | |
| Charts:- Daily , Weekly | |
| Add UFCS to Watchlist: View: Get Complete UFCS Trend Analysis ➞ | |
 | FMBH First Mid Bancshares, Inc. |
| Sector: Financials | |
| SubSector: Regional - Midwest Banks | |
| MarketCap: 373.27 Millions | |
| Recent Price: 29.86 Smart Investing & Trading Score: 32 | |
| Day Percent Change: 1.84% Day Change: 0.54 | |
| Week Change: 1.19% Year-to-date Change: -13.9% | |
| FMBH Links: Profile News Message Board | |
| Charts:- Daily , Weekly | |
| Add FMBH to Watchlist: View: Get Complete FMBH Trend Analysis ➞ | |
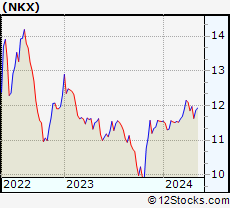 | NKX Nuveen California AMT-Free Quality Municipal Income Fund |
| Sector: Financials | |
| SubSector: Asset Management | |
| MarketCap: 595.403 Millions | |
| Recent Price: 11.99 Smart Investing & Trading Score: 68 | |
| Day Percent Change: 0.76% Day Change: 0.09 | |
| Week Change: 1.18% Year-to-date Change: 3.9% | |
| NKX Links: Profile News Message Board | |
| Charts:- Daily , Weekly | |
| Add NKX to Watchlist: View: Get Complete NKX Trend Analysis ➞ | |
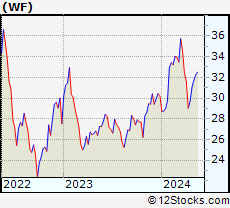 | WF Woori Financial Group Inc. |
| Sector: Financials | |
| SubSector: Foreign Regional Banks | |
| MarketCap: 4772.69 Millions | |
| Recent Price: 29.36 Smart Investing & Trading Score: 25 | |
| Day Percent Change: 1.80% Day Change: 0.52 | |
| Week Change: 1.17% Year-to-date Change: -2.9% | |
| WF Links: Profile News Message Board | |
| Charts:- Daily , Weekly | |
| Add WF to Watchlist: View: Get Complete WF Trend Analysis ➞ | |
 | GLRE Greenlight Capital Re, Ltd. |
| Sector: Financials | |
| SubSector: Accident & Health Insurance | |
| MarketCap: 228.66 Millions | |
| Recent Price: 12.25 Smart Investing & Trading Score: 49 | |
| Day Percent Change: 0.74% Day Change: 0.09 | |
| Week Change: 1.16% Year-to-date Change: 7.3% | |
| GLRE Links: Profile News Message Board | |
| Charts:- Daily , Weekly | |
| Add GLRE to Watchlist: View: Get Complete GLRE Trend Analysis ➞ | |
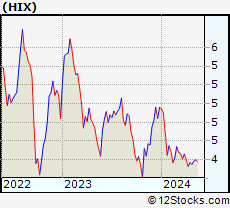 | HIX Western Asset High Income Fund II Inc. |
| Sector: Financials | |
| SubSector: Closed-End Fund - Debt | |
| MarketCap: 356.807 Millions | |
| Recent Price: 4.38 Smart Investing & Trading Score: 42 | |
| Day Percent Change: 0.46% Day Change: 0.02 | |
| Week Change: 1.15% Year-to-date Change: -11.7% | |
| HIX Links: Profile News Message Board | |
| Charts:- Daily , Weekly | |
| Add HIX to Watchlist: View: Get Complete HIX Trend Analysis ➞ | |
 | EIG Employers Holdings, Inc. |
| Sector: Financials | |
| SubSector: Accident & Health Insurance | |
| MarketCap: 1202.6 Millions | |
| Recent Price: 43.10 Smart Investing & Trading Score: 58 | |
| Day Percent Change: 1.46% Day Change: 0.62 | |
| Week Change: 1.15% Year-to-date Change: 9.4% | |
| EIG Links: Profile News Message Board | |
| Charts:- Daily , Weekly | |
| Add EIG to Watchlist: View: Get Complete EIG Trend Analysis ➞ | |
 | WELL Welltower Inc. |
| Sector: Financials | |
| SubSector: REIT - Healthcare Facilities | |
| MarketCap: 21398.8 Millions | |
| Recent Price: 90.81 Smart Investing & Trading Score: 56 | |
| Day Percent Change: 1.24% Day Change: 1.11 | |
| Week Change: 1.14% Year-to-date Change: 0.7% | |
| WELL Links: Profile News Message Board | |
| Charts:- Daily , Weekly | |
| Add WELL to Watchlist: View: Get Complete WELL Trend Analysis ➞ | |
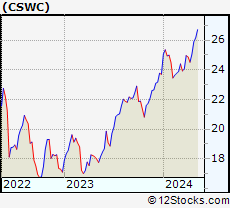 | CSWC Capital Southwest Corporation |
| Sector: Financials | |
| SubSector: Asset Management | |
| MarketCap: 213.703 Millions | |
| Recent Price: 24.78 Smart Investing & Trading Score: 81 | |
| Day Percent Change: -0.04% Day Change: -0.01 | |
| Week Change: 1.1% Year-to-date Change: 4.6% | |
| CSWC Links: Profile News Message Board | |
| Charts:- Daily , Weekly | |
| Add CSWC to Watchlist: View: Get Complete CSWC Trend Analysis ➞ | |
 | LKFN Lakeland Financial Corporation |
| Sector: Financials | |
| SubSector: Regional - Midwest Banks | |
| MarketCap: 903.27 Millions | |
| Recent Price: 59.12 Smart Investing & Trading Score: 23 | |
| Day Percent Change: 0.75% Day Change: 0.44 | |
| Week Change: 1.09% Year-to-date Change: -9.3% | |
| LKFN Links: Profile News Message Board | |
| Charts:- Daily , Weekly | |
| Add LKFN to Watchlist: View: Get Complete LKFN Trend Analysis ➞ | |
 | OCSL Oaktree Specialty Lending Corporation |
| Sector: Financials | |
| SubSector: Credit Services | |
| MarketCap: 353.808 Millions | |
| Recent Price: 19.48 Smart Investing & Trading Score: 50 | |
| Day Percent Change: 0.26% Day Change: 0.05 | |
| Week Change: 1.09% Year-to-date Change: -4.6% | |
| OCSL Links: Profile News Message Board | |
| Charts:- Daily , Weekly | |
| Add OCSL to Watchlist: View: Get Complete OCSL Trend Analysis ➞ | |
 | CNO CNO Financial Group, Inc. |
| Sector: Financials | |
| SubSector: Accident & Health Insurance | |
| MarketCap: 1746.9 Millions | |
| Recent Price: 25.69 Smart Investing & Trading Score: 32 | |
| Day Percent Change: 2.27% Day Change: 0.57 | |
| Week Change: 1.06% Year-to-date Change: -7.9% | |
| CNO Links: Profile News Message Board | |
| Charts:- Daily , Weekly | |
| Add CNO to Watchlist: View: Get Complete CNO Trend Analysis ➞ | |
 | WTBA West Bancorporation, Inc. |
| Sector: Financials | |
| SubSector: Regional - Southwest Banks | |
| MarketCap: 272.965 Millions | |
| Recent Price: 16.26 Smart Investing & Trading Score: 52 | |
| Day Percent Change: 2.91% Day Change: 0.46 | |
| Week Change: 1.06% Year-to-date Change: -23.3% | |
| WTBA Links: Profile News Message Board | |
| Charts:- Daily , Weekly | |
| Add WTBA to Watchlist: View: Get Complete WTBA Trend Analysis ➞ | |
 | HCI HCI Group, Inc. |
| Sector: Financials | |
| SubSector: Property & Casualty Insurance | |
| MarketCap: 297.412 Millions | |
| Recent Price: 110.51 Smart Investing & Trading Score: 56 | |
| Day Percent Change: 0.55% Day Change: 0.60 | |
| Week Change: 1.06% Year-to-date Change: 26.4% | |
| HCI Links: Profile News Message Board | |
| Charts:- Daily , Weekly | |
| Add HCI to Watchlist: View: Get Complete HCI Trend Analysis ➞ | |
 | CEF Sprott Physical Gold and Silver Trust |
| Sector: Financials | |
| SubSector: Asset Management | |
| MarketCap: 2485.33 Millions | |
| Recent Price: 22.23 Smart Investing & Trading Score: 83 | |
| Day Percent Change: 0.05% Day Change: 0.01 | |
| Week Change: 1.05% Year-to-date Change: 16.1% | |
| CEF Links: Profile News Message Board | |
| Charts:- Daily , Weekly | |
| Add CEF to Watchlist: View: Get Complete CEF Trend Analysis ➞ | |
 | CASH Meta Financial Group, Inc. |
| Sector: Financials | |
| SubSector: Savings & Loans | |
| MarketCap: 849.33 Millions | |
| Recent Price: 49.00 Smart Investing & Trading Score: 35 | |
| Day Percent Change: 1.03% Day Change: 0.50 | |
| Week Change: 1.01% Year-to-date Change: -7.4% | |
| CASH Links: Profile News Message Board | |
| Charts:- Daily , Weekly | |
| Add CASH to Watchlist: View: Get Complete CASH Trend Analysis ➞ | |
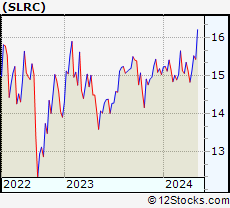 | SLRC Solar Capital Ltd. |
| Sector: Financials | |
| SubSector: Diversified Investments | |
| MarketCap: 412.87 Millions | |
| Recent Price: 14.98 Smart Investing & Trading Score: 32 | |
| Day Percent Change: 0.47% Day Change: 0.07 | |
| Week Change: 1.01% Year-to-date Change: -0.3% | |
| SLRC Links: Profile News Message Board | |
| Charts:- Daily , Weekly | |
| Add SLRC to Watchlist: View: Get Complete SLRC Trend Analysis ➞ | |
| For tabular summary view of above stock list: Summary View ➞ 0 - 25 , 25 - 50 , 50 - 75 , 75 - 100 , 100 - 125 , 125 - 150 , 150 - 175 , 175 - 200 , 200 - 225 , 225 - 250 , 250 - 275 , 275 - 300 , 300 - 325 , 325 - 350 , 350 - 375 , 375 - 400 , 400 - 425 , 425 - 450 , 450 - 475 , 475 - 500 , 500 - 525 , 525 - 550 , 550 - 575 , 575 - 600 , 600 - 625 , 625 - 650 , 650 - 675 , 675 - 700 , 700 - 725 , 725 - 750 , 750 - 775 , 775 - 800 , 800 - 825 , 825 - 850 , 850 - 875 , 875 - 900 , 900 - 925 , 925 - 950 , 950 - 975 , 975 - 1000 , 1000 - 1025 , 1025 - 1050 , 1050 - 1075 , 1075 - 1100 , 1100 - 1125 , 1125 - 1150 , 1150 - 1175 , 1175 - 1200 , 1200 - 1225 , 1225 - 1250 | ||
| Click To Change The Sort Order: By Market Cap or Company Size Performance: Year-to-date, Week and Day | |
| Select Chart Type: | ||
|
Best Stocks Today 12Stocks.com |
© 2024 12Stocks.com Terms & Conditions Privacy Contact Us
All Information Provided Only For Education And Not To Be Used For Investing or Trading. See Terms & Conditions


One More Thing ... Get Best Stocks Delivered Daily!
Never Ever Miss A Move With Our Top Ten Stocks Lists
Find Best Stocks In Any Market - Bull or Bear Market
Take A Peek At Our Top Ten Stocks Lists: Daily, Weekly, Year-to-Date & Top Trends
Find Best Stocks In Any Market - Bull or Bear Market
Take A Peek At Our Top Ten Stocks Lists: Daily, Weekly, Year-to-Date & Top Trends
Financial Stocks With Best Up Trends [0-bearish to 100-bullish]: Medical Properties[100], Victory Capital[100], TCG BDC[100], Macatawa Bank[100], Stellus Capital[100], Goldman Sachs[100], Angel Oak[95], HDFC Bank[93], Charles Schwab[93], Fidus [93], Western Asset[93]
Best Financial Stocks Year-to-Date:
Root [389.97%], Hippo [128.32%], Gladstone Capital[93.22%], Banco Macro[68.33%], Grupo Financiero[62.35%], Yiren Digital[55.45%], Fidelis Insurance[53.3%], First [50.82%], Banco BBVA[48.35%], EverQuote [48.04%], Heritage Insurance[45.55%] Best Financial Stocks This Week:
Macatawa Bank[44.42%], Medical Properties[25.06%], Globe Life[10%], James River[8.87%], GoHealth [7.45%], Victory Capital[6.87%], Bancorp [5.43%], Huize Holding[5.3%], Green Dot[5.25%], LCNB [5.2%], ESSA Bancorp[4.94%] Best Financial Stocks Daily:
Oportun [9.86%], Cipher Mining[8.65%], Ally [6.73%], eHealth [6.22%], Coinbase Global[5.90%], C&F [5.65%], James River[5.62%], Tejon Ranch[5.44%], Bank OZK[4.73%], Medical Properties[4.61%], Claros Mortgage[4.52%]