
 Login Sign Up


| |||||
 |  | ||||

| 12Stocks.com Market Intelligence |
Best Financial Stocks
| In a hurry? Financial Stocks Lists: Performance Trends Table, Stock Charts
Sort Financial stocks: Daily, Weekly, Year-to-Date, Market Cap & Trends. Filter Financial stocks list by size:All Financial Large Mid-Range Small & MicroCap |
| 12Stocks.com Financial Stocks Performances & Trends Daily | |||||||||
|
|  The overall Smart Investing & Trading Score is 30 (0-bearish to 100-bullish) which puts Financial sector in short term bearish to neutral trend. The Smart Investing & Trading Score from previous trading session is 100 and a deterioration of trend continues.
| ||||||||
Here are the Smart Investing & Trading Scores of the most requested Financial stocks at 12Stocks.com (click stock name for detailed review):
|


| 12Stocks.com: Investing in Financial sector with Stocks | |
|
The following table helps investors and traders sort through current performance and trends (as measured by Smart Investing & Trading Score) of various
stocks in the Financial sector. Quick View: Move mouse or cursor over stock symbol (ticker) to view short-term Technical chart and over stock name to view long term chart. Click on  to add stock symbol to your watchlist and to add stock symbol to your watchlist and  to view watchlist. Click on any ticker or stock name for detailed market intelligence report for that stock. to view watchlist. Click on any ticker or stock name for detailed market intelligence report for that stock. |
12Stocks.com Performance of Stocks in Financial Sector
| Ticker | Stock Name | Watchlist | Category | Recent Price | Smart Investing & Trading Score | Change % | Weekly Change% |
| SUPV | Grupo Supervielle |   | Banks - Regional | 7.84 | 50 | -1.07% | -6.38% |
| ARES | Ares Management | | Asset Mgmt | 179.20 | 40 | -0.37% | -6.40% |
| HBNC | Horizon Bancorp | | Banks - Regional | 16.86 | 80 | -5.73% | -6.43% |
| SLM | SLM Corp | | Credit Services | 31.28 | 40 | 0.59% | -6.52% |
| MC | Moelis & Co | | Capital Markets | 72.11 | 50 | -1.34% | -6.68% |
| OXSQ | Oxford Square | | Asset Mgmt | 2.19 | 20 | -1.33% | -6.72% |
| GGAL | Grupo Financiero | | Banks - Regional | 39.28 | 20 | -0.35% | -6.74% |
| AC | Associated Capital | | Asset Mgmt | 33.13 | 0 | -0.64% | -6.88% |
| XP | XP | | Capital Markets | 18.14 | 90 | 0.78% | -7.02% |
| UNIT | Uniti | | REIT - Specialty | 6.30 | 60 | -2.13% | -7.15% |
| CCI | Crown Castle | | REIT - Specialty | 96.27 | 10 | 0.85% | -7.25% |
| MLP | Maui Land | | Real Estate Services | 17.38 | 40 | -0.75% | -7.46% |
| COIN | Coinbase Global | | Financial Data & Stock Exchanges | 304.54 | 0 | -1.35% | -7.57% |
| BIT | BlackRock Multi-Sector | | Closed-End Fund - Debt | 13.70 | 10 | -1.44% | -7.81% |
| INN | Summit Hotel | | REIT - Hotel & Motel | 5.48 | 100 | -1.75% | -7.83% |
| QFIN | Qfin | | Credit Services | 29.12 | 20 | 3.34% | -7.90% |
| FRGE | Forge Global | | Capital Markets | 18.85 | 0 | -2.85% | -7.90% |
| SNFCA | Security National | | Mortgage Finance | 9.00 | 0 | -0.71% | -8.54% |
| OPFI | OppFi | | Credit Services | 10.21 | 70 | 0.73% | -8.70% |
| CMTG | Claros Mortgage | | REIT - Mortgage | 3.70 | 46 | -6.82% | -9.51% |
| SBAC | SBA | | REIT - Specialty | 199.01 | 10 | 1.97% | -10.71% |
| MKTW | Marketwise | | Financial Data & Stock Exchanges | 17.96 | 40 | -2.92% | -11.07% |
| BBAR | BBVA Argentina | | Banks - Regional | 12.25 | 20 | -5.29% | -11.18% |
| OPAD | Offerpad | | Real Estate Services | 5.15 | 80 | 2.29% | -11.26% |
| AFCG | Advanced Flower | | REIT - Mortgage | 4.66 | 70 | 3.32% | -15.03% |
| For chart view version of above stock list: Chart View ➞ 0 - 25 , 25 - 50 , 50 - 75 , 75 - 100 , 100 - 125 , 125 - 150 , 150 - 175 , 175 - 200 , 200 - 225 , 225 - 250 , 250 - 275 , 275 - 300 , 300 - 325 , 325 - 350 , 350 - 375 , 375 - 400 , 400 - 425 , 425 - 450 , 450 - 475 , 475 - 500 , 500 - 525 , 525 - 550 , 550 - 575 , 575 - 600 , 600 - 625 , 625 - 650 , 650 - 675 , 675 - 700 , 700 - 725 , 725 - 750 , 750 - 775 , 775 - 800 , 800 - 825 , 825 - 850 , 850 - 875 , 875 - 900 , 900 - 925 , 925 - 950 , 950 - 975 , 975 - 1000 , 1000 - 1025 , 1025 - 1050 , 1050 - 1075 , 1075 - 1100 | ||
 | Click To Change The Sort Order: By Market Cap or Company Size Performance: Year-to-date, Week and Day |  |
|
Get the most comprehensive stock market coverage daily at 12Stocks.com ➞ Best Stocks Today ➞ Best Stocks Weekly ➞ Best Stocks Year-to-Date ➞ Best Stocks Trends ➞  Best Stocks Today 12Stocks.com Best Nasdaq Stocks ➞ Best S&P 500 Stocks ➞ Best Tech Stocks ➞ Best Biotech Stocks ➞ |
| Detailed Overview of Financial Stocks |
| Financial Technical Overview, Leaders & Laggards, Top Financial ETF Funds & Detailed Financial Stocks List, Charts, Trends & More |
| Financial Sector: Technical Analysis, Trends & YTD Performance | |
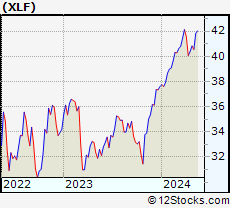
| Financial sector is composed of stocks
from banks, brokers, insurance, REITs
and services subsectors. Financial sector, as represented by XLF, an exchange-traded fund [ETF] that holds basket of Financial stocks (e.g, Bank of America, Goldman Sachs) is up by 3.84% and is currently underperforming the overall market by -3.88% year-to-date. Below is a quick view of Technical charts and trends: |
|
 XLF Weekly Chart |
|
| Long Term Trend: Good | |
| Medium Term Trend: Good | |
 XLF Daily Chart |
|
| Short Term Trend: Not Good | |
| Overall Trend Score: 30 | |
| YTD Performance: 3.84% | |
| **Trend Scores & Views Are Only For Educational Purposes And Not For Investing | |
| 12Stocks.com: Top Performing Financial Sector Stocks | ||||||||||||||||||||||||||||||||||||||||||||||||
 The top performing Financial sector stocks year to date are
Now, more recently, over last week, the top performing Financial sector stocks on the move are


|
||||||||||||||||||||||||||||||||||||||||||||||||
| 12Stocks.com: Investing in Financial Sector using Exchange Traded Funds | |
|
The following table shows list of key exchange traded funds (ETF) that
help investors track Financial Index. For detailed view, check out our ETF Funds section of our website. Quick View: Move mouse or cursor over ETF symbol (ticker) to view short-term Technical chart and over ETF name to view long term chart. Click on ticker or stock name for detailed view. Click on to add stock symbol to your watchlist and to view watchlist. |
12Stocks.com List of ETFs that track Financial Index
| Ticker | ETF Name | Watchlist | Recent Price | Smart Investing & Trading Score | Change % | Week % | Year-to-date % |
| 12Stocks.com: Charts, Trends, Fundamental Data and Performances of Financial Stocks | |
|
We now take in-depth look at all Financial stocks including charts, multi-period performances and overall trends (as measured by Smart Investing & Trading Score). One can sort Financial stocks (click link to choose) by Daily, Weekly and by Year-to-Date performances. Also, one can sort by size of the company or by market capitalization. |
| Select Your Default Chart Type: | |||||
| |||||
| Click on stock symbol or name for detailed view. Click on to add stock symbol to your watchlist and to view watchlist. Quick View: Move mouse or cursor over "Daily" to quickly view daily Technical stock chart and over "Weekly" to view weekly Technical stock chart. | |||||

 | SUPV Grupo Supervielle S.A. ADR |
| Sector: Financials | |
| SubSector: Banks - Regional | |
| MarketCap: 632.79 Millions | |
| Recent Price: 7.84 Smart Investing & Trading Score: 50 | |
| Day Percent Change: -1.07% Day Change: -0.1 | |
| Week Change: -6.38% Year-to-date Change: -38.1% | |
| SUPV Links: Profile News Message Board | |
| Charts:- Daily , Weekly | |
| Add SUPV to Watchlist: View: Get Complete SUPV Trend Analysis ➞ | |
 | ARES Ares Management Corp |
| Sector: Financials | |
| SubSector: Asset Management | |
| MarketCap: 57928.6 Millions | |
| Recent Price: 179.20 Smart Investing & Trading Score: 40 | |
| Day Percent Change: -0.37% Day Change: -0.67 | |
| Week Change: -6.4% Year-to-date Change: 2.2% | |
| ARES Links: Profile News Message Board | |
| Charts:- Daily , Weekly | |
| Add ARES to Watchlist: View: Get Complete ARES Trend Analysis ➞ | |
 | HBNC Horizon Bancorp Inc (IN) |
| Sector: Financials | |
| SubSector: Banks - Regional | |
| MarketCap: 853.08 Millions | |
| Recent Price: 16.86 Smart Investing & Trading Score: 80 | |
| Day Percent Change: -5.73% Day Change: -0.92 | |
| Week Change: -6.43% Year-to-date Change: -3.0% | |
| HBNC Links: Profile News Message Board | |
| Charts:- Daily , Weekly | |
| Add HBNC to Watchlist: View: Get Complete HBNC Trend Analysis ➞ | |
 | SLM SLM Corp |
| Sector: Financials | |
| SubSector: Credit Services | |
| MarketCap: 6485.86 Millions | |
| Recent Price: 31.28 Smart Investing & Trading Score: 40 | |
| Day Percent Change: 0.59% Day Change: 0.18 | |
| Week Change: -6.52% Year-to-date Change: 12.8% | |
| SLM Links: Profile News Message Board | |
| Charts:- Daily , Weekly | |
| Add SLM to Watchlist: View: Get Complete SLM Trend Analysis ➞ | |
 | MC Moelis & Co |
| Sector: Financials | |
| SubSector: Capital Markets | |
| MarketCap: 5704.94 Millions | |
| Recent Price: 72.11 Smart Investing & Trading Score: 50 | |
| Day Percent Change: -1.34% Day Change: -0.94 | |
| Week Change: -6.68% Year-to-date Change: -3.2% | |
| MC Links: Profile News Message Board | |
| Charts:- Daily , Weekly | |
| Add MC to Watchlist: View: Get Complete MC Trend Analysis ➞ | |
 | OXSQ Oxford Square Capital Corp |
| Sector: Financials | |
| SubSector: Asset Management | |
| MarketCap: 171.68 Millions | |
| Recent Price: 2.19 Smart Investing & Trading Score: 20 | |
| Day Percent Change: -1.33% Day Change: -0.03 | |
| Week Change: -6.72% Year-to-date Change: 0.2% | |
| OXSQ Links: Profile News Message Board | |
| Charts:- Daily , Weekly | |
| Add OXSQ to Watchlist: View: Get Complete OXSQ Trend Analysis ➞ | |
 | GGAL Grupo Financiero Galicia ADR |
| Sector: Financials | |
| SubSector: Banks - Regional | |
| MarketCap: 5313.25 Millions | |
| Recent Price: 39.28 Smart Investing & Trading Score: 20 | |
| Day Percent Change: -0.35% Day Change: -0.16 | |
| Week Change: -6.74% Year-to-date Change: -25.4% | |
| GGAL Links: Profile News Message Board | |
| Charts:- Daily , Weekly | |
| Add GGAL to Watchlist: View: Get Complete GGAL Trend Analysis ➞ | |
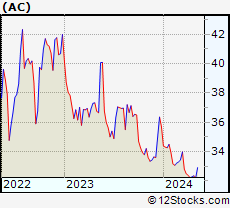 | AC Associated Capital Group Inc |
| Sector: Financials | |
| SubSector: Asset Management | |
| MarketCap: 649.89 Millions | |
| Recent Price: 33.13 Smart Investing & Trading Score: 0 | |
| Day Percent Change: -0.64% Day Change: -0.22 | |
| Week Change: -6.88% Year-to-date Change: 0.3% | |
| AC Links: Profile News Message Board | |
| Charts:- Daily , Weekly | |
| Add AC to Watchlist: View: Get Complete AC Trend Analysis ➞ | |
 | XP XP Inc |
| Sector: Financials | |
| SubSector: Capital Markets | |
| MarketCap: 9964.48 Millions | |
| Recent Price: 18.14 Smart Investing & Trading Score: 90 | |
| Day Percent Change: 0.78% Day Change: 0.13 | |
| Week Change: -7.02% Year-to-date Change: 36.5% | |
| XP Links: Profile News Message Board | |
| Charts:- Daily , Weekly | |
| Add XP to Watchlist: View: Get Complete XP Trend Analysis ➞ | |
 | UNIT Uniti Group Inc |
| Sector: Financials | |
| SubSector: REIT - Specialty | |
| MarketCap: 1536.29 Millions | |
| Recent Price: 6.30 Smart Investing & Trading Score: 60 | |
| Day Percent Change: -2.13% Day Change: -0.13 | |
| Week Change: -7.15% Year-to-date Change: -34.6% | |
| UNIT Links: Profile News Message Board | |
| Charts:- Daily , Weekly | |
| Add UNIT to Watchlist: View: Get Complete UNIT Trend Analysis ➞ | |
 | CCI Crown Castle Inc |
| Sector: Financials | |
| SubSector: REIT - Specialty | |
| MarketCap: 41870.4 Millions | |
| Recent Price: 96.27 Smart Investing & Trading Score: 10 | |
| Day Percent Change: 0.85% Day Change: 0.81 | |
| Week Change: -7.25% Year-to-date Change: 10.8% | |
| CCI Links: Profile News Message Board | |
| Charts:- Daily , Weekly | |
| Add CCI to Watchlist: View: Get Complete CCI Trend Analysis ➞ | |
 | MLP Maui Land & Pineapple Co., Inc |
| Sector: Financials | |
| SubSector: Real Estate Services | |
| MarketCap: 335.43 Millions | |
| Recent Price: 17.38 Smart Investing & Trading Score: 40 | |
| Day Percent Change: -0.75% Day Change: -0.12 | |
| Week Change: -7.46% Year-to-date Change: -27.8% | |
| MLP Links: Profile News Message Board | |
| Charts:- Daily , Weekly | |
| Add MLP to Watchlist: View: Get Complete MLP Trend Analysis ➞ | |
 | COIN Coinbase Global Inc |
| Sector: Financials | |
| SubSector: Financial Data & Stock Exchanges | |
| MarketCap: 76842.5 Millions | |
| Recent Price: 304.54 Smart Investing & Trading Score: 0 | |
| Day Percent Change: -1.35% Day Change: -4.11 | |
| Week Change: -7.57% Year-to-date Change: 20.9% | |
| COIN Links: Profile News Message Board | |
| Charts:- Daily , Weekly | |
| Add COIN to Watchlist: View: Get Complete COIN Trend Analysis ➞ | |
 | BIT BlackRock Multi-Sector Income Trust |
| Sector: Financials | |
| SubSector: Closed-End Fund - Debt | |
| MarketCap: 567.75 Millions | |
| Recent Price: 13.70 Smart Investing & Trading Score: 10 | |
| Day Percent Change: -1.44% Day Change: -0.2 | |
| Week Change: -7.81% Year-to-date Change: -0.4% | |
| BIT Links: Profile News Message Board | |
| Charts:- Daily , Weekly | |
| Add BIT to Watchlist: View: Get Complete BIT Trend Analysis ➞ | |
 | INN Summit Hotel Properties Inc |
| Sector: Financials | |
| SubSector: REIT - Hotel & Motel | |
| MarketCap: 687.05 Millions | |
| Recent Price: 5.48 Smart Investing & Trading Score: 100 | |
| Day Percent Change: -1.75% Day Change: -0.09 | |
| Week Change: -7.83% Year-to-date Change: -23.9% | |
| INN Links: Profile News Message Board | |
| Charts:- Daily , Weekly | |
| Add INN to Watchlist: View: Get Complete INN Trend Analysis ➞ | |
 | QFIN Qfin Holdings Inc. ADR |
| Sector: Financials | |
| SubSector: Credit Services | |
| MarketCap: 3718.52 Millions | |
| Recent Price: 29.12 Smart Investing & Trading Score: 20 | |
| Day Percent Change: 3.34% Day Change: 0.99 | |
| Week Change: -7.9% Year-to-date Change: -18.6% | |
| QFIN Links: Profile News Message Board | |
| Charts:- Daily , Weekly | |
| Add QFIN to Watchlist: View: Get Complete QFIN Trend Analysis ➞ | |
 | FRGE Forge Global Holdings Inc |
| Sector: Financials | |
| SubSector: Capital Markets | |
| MarketCap: 235.58 Millions | |
| Recent Price: 18.85 Smart Investing & Trading Score: 0 | |
| Day Percent Change: -2.85% Day Change: -0.56 | |
| Week Change: -7.9% Year-to-date Change: 36.8% | |
| FRGE Links: Profile News Message Board | |
| Charts:- Daily , Weekly | |
| Add FRGE to Watchlist: View: Get Complete FRGE Trend Analysis ➞ | |
 | SNFCA Security National Financial Corp |
| Sector: Financials | |
| SubSector: Mortgage Finance | |
| MarketCap: 217.89 Millions | |
| Recent Price: 9.00 Smart Investing & Trading Score: 0 | |
| Day Percent Change: -0.71% Day Change: -0.06 | |
| Week Change: -8.54% Year-to-date Change: -27.1% | |
| SNFCA Links: Profile News Message Board | |
| Charts:- Daily , Weekly | |
| Add SNFCA to Watchlist: View: Get Complete SNFCA Trend Analysis ➞ | |
 | OPFI OppFi Inc |
| Sector: Financials | |
| SubSector: Credit Services | |
| MarketCap: 913.22 Millions | |
| Recent Price: 10.21 Smart Investing & Trading Score: 70 | |
| Day Percent Change: 0.73% Day Change: 0.07 | |
| Week Change: -8.7% Year-to-date Change: 30.0% | |
| OPFI Links: Profile News Message Board | |
| Charts:- Daily , Weekly | |
| Add OPFI to Watchlist: View: Get Complete OPFI Trend Analysis ➞ | |
 | CMTG Claros Mortgage Trust Inc |
| Sector: Financials | |
| SubSector: REIT - Mortgage | |
| MarketCap: 538.31 Millions | |
| Recent Price: 3.70 Smart Investing & Trading Score: 46 | |
| Day Percent Change: -6.82% Day Change: -0.23 | |
| Week Change: -9.51% Year-to-date Change: -30.5% | |
| CMTG Links: Profile News Message Board | |
| Charts:- Daily , Weekly | |
| Add CMTG to Watchlist: View: Get Complete CMTG Trend Analysis ➞ | |
 | SBAC SBA Communications Corp |
| Sector: Financials | |
| SubSector: REIT - Specialty | |
| MarketCap: 21233.1 Millions | |
| Recent Price: 199.01 Smart Investing & Trading Score: 10 | |
| Day Percent Change: 1.97% Day Change: 3.84 | |
| Week Change: -10.71% Year-to-date Change: 1.7% | |
| SBAC Links: Profile News Message Board | |
| Charts:- Daily , Weekly | |
| Add SBAC to Watchlist: View: Get Complete SBAC Trend Analysis ➞ | |
 | MKTW Marketwise Inc |
| Sector: Financials | |
| SubSector: Financial Data & Stock Exchanges | |
| MarketCap: 294.53 Millions | |
| Recent Price: 17.96 Smart Investing & Trading Score: 40 | |
| Day Percent Change: -2.92% Day Change: -0.53 | |
| Week Change: -11.07% Year-to-date Change: 68.4% | |
| MKTW Links: Profile News Message Board | |
| Charts:- Daily , Weekly | |
| Add MKTW to Watchlist: View: Get Complete MKTW Trend Analysis ➞ | |
 | BBAR BBVA Argentina ADR |
| Sector: Financials | |
| SubSector: Banks - Regional | |
| MarketCap: 2518.28 Millions | |
| Recent Price: 12.25 Smart Investing & Trading Score: 20 | |
| Day Percent Change: -5.29% Day Change: -0.79 | |
| Week Change: -11.18% Year-to-date Change: -25.8% | |
| BBAR Links: Profile News Message Board | |
| Charts:- Daily , Weekly | |
| Add BBAR to Watchlist: View: Get Complete BBAR Trend Analysis ➞ | |
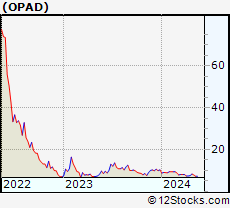 | OPAD Offerpad Solutions Inc |
| Sector: Financials | |
| SubSector: Real Estate Services | |
| MarketCap: 156.28 Millions | |
| Recent Price: 5.15 Smart Investing & Trading Score: 80 | |
| Day Percent Change: 2.29% Day Change: 0.03 | |
| Week Change: -11.26% Year-to-date Change: -53.0% | |
| OPAD Links: Profile News Message Board | |
| Charts:- Daily , Weekly | |
| Add OPAD to Watchlist: View: Get Complete OPAD Trend Analysis ➞ | |
 | AFCG Advanced Flower Capital Inc |
| Sector: Financials | |
| SubSector: REIT - Mortgage | |
| MarketCap: 103.48 Millions | |
| Recent Price: 4.66 Smart Investing & Trading Score: 70 | |
| Day Percent Change: 3.32% Day Change: 0.12 | |
| Week Change: -15.03% Year-to-date Change: -52.0% | |
| AFCG Links: Profile News Message Board | |
| Charts:- Daily , Weekly | |
| Add AFCG to Watchlist: View: Get Complete AFCG Trend Analysis ➞ | |
| For tabular summary view of above stock list: Summary View ➞ 0 - 25 , 25 - 50 , 50 - 75 , 75 - 100 , 100 - 125 , 125 - 150 , 150 - 175 , 175 - 200 , 200 - 225 , 225 - 250 , 250 - 275 , 275 - 300 , 300 - 325 , 325 - 350 , 350 - 375 , 375 - 400 , 400 - 425 , 425 - 450 , 450 - 475 , 475 - 500 , 500 - 525 , 525 - 550 , 550 - 575 , 575 - 600 , 600 - 625 , 625 - 650 , 650 - 675 , 675 - 700 , 700 - 725 , 725 - 750 , 750 - 775 , 775 - 800 , 800 - 825 , 825 - 850 , 850 - 875 , 875 - 900 , 900 - 925 , 925 - 950 , 950 - 975 , 975 - 1000 , 1000 - 1025 , 1025 - 1050 , 1050 - 1075 , 1075 - 1100 | ||
| Click To Change The Sort Order: By Market Cap or Company Size Performance: Year-to-date, Week and Day | |
| Select Chart Type: | ||
|
Best Stocks Today 12Stocks.com |
© 2025 12Stocks.com Terms & Conditions Privacy Contact Us
All Information Provided Only For Education And Not To Be Used For Investing or Trading. See Terms & Conditions


One More Thing ... Get Best Stocks Delivered Daily!
Never Ever Miss A Move With Our Top Ten Stocks Lists
Find Best Stocks In Any Market - Bull or Bear Market
Take A Peek At Our Top Ten Stocks Lists: Daily, Weekly, Year-to-Date & Top Trends
Find Best Stocks In Any Market - Bull or Bear Market
Take A Peek At Our Top Ten Stocks Lists: Daily, Weekly, Year-to-Date & Top Trends
Financial Stocks With Best Up Trends [0-bearish to 100-bullish]: Compass [100], Western Union[100], Whitestone REIT[100], Healthcare Realty[100], Public Storage[100], Alexandria Real[100], Omega Healthcare[100], LendingTree [100], Federal Realty[100], OFS Capital[100], BXP [100]
Best Financial Stocks Year-to-Date:
ESSA Bancorp[2923.51%], Robinhood Markets[185.29%], Solowin [161.21%], Metalpha Technology[143.48%], IHS Holding[139.04%], Altisource Portfolio[127.41%], Banco Santander[113.19%], Banco Bilbao[102.83%], IREN [99.49%], Grupo Cibest[93.5%], Mr. Cooper[91.06%] Best Financial Stocks This Week:
Plymouth Industrial[40.4%], SelectQuote [30.15%], Altisource Portfolio[24.32%], Seritage Growth[20.21%], MBIA [18.44%], Nu [13.82%], Qudian [11.08%], Cipher Mining[10.9%], Brookfield Business[10.18%], BXP [9.64%], Stratus Properties[8.94%] Best Financial Stocks Daily:
SelectQuote [41.53%], X [15.73%], Altisource Portfolio[9.12%], Aegon [7.64%], UP Fintech[6.65%], FinVolution [5.55%], Hippo [5.47%], Lufax Holding[5.45%], eHealth [4.65%], MarketAxess [4.54%], Yiren Digital[3.6%]