
 Login Sign Up


| |||||
 |  | ||||

| 12Stocks.com Market Intelligence |
Best Financial Stocks
| In a hurry? Financial Stocks Lists: Performance Trends Table, Stock Charts
Sort Financial stocks: Daily, Weekly, Year-to-Date, Market Cap & Trends. Filter Financial stocks list by size:All Financial Large Mid-Range Small & MicroCap |
| 12Stocks.com Financial Stocks Performances & Trends Daily | |||||||||
|
|  The overall Smart Investing & Trading Score is 30 (0-bearish to 100-bullish) which puts Financial sector in short term bearish to neutral trend. The Smart Investing & Trading Score from previous trading session is 100 and a deterioration of trend continues.
| ||||||||
Here are the Smart Investing & Trading Scores of the most requested Financial stocks at 12Stocks.com (click stock name for detailed review):
|


| 12Stocks.com: Investing in Financial sector with Stocks | |
|
The following table helps investors and traders sort through current performance and trends (as measured by Smart Investing & Trading Score) of various
stocks in the Financial sector. Quick View: Move mouse or cursor over stock symbol (ticker) to view short-term Technical chart and over stock name to view long term chart. Click on  to add stock symbol to your watchlist and to add stock symbol to your watchlist and  to view watchlist. Click on any ticker or stock name for detailed market intelligence report for that stock. to view watchlist. Click on any ticker or stock name for detailed market intelligence report for that stock. |
12Stocks.com Performance of Stocks in Financial Sector
| Ticker | Stock Name | Watchlist | Category | Recent Price | Smart Investing & Trading Score | Change % | Weekly Change% |
| FGBI | First Guaranty |   | Banks - Regional | 8.42 | 100 | -4.11% | -5.17% |
| BGC | BGC | | Capital Markets | 9.81 | 40 | 0.31% | -5.19% |
| DB | Deutsche Bank | | Banks - Regional | 35.2 | 60 | -0.34% | -5.25% |
| TWO | Two Harbors | | REIT - Mortgage | 10.00 | 90 | -5.53% | -5.25% |
| COOP | Mr. Cooper | | Mortgage Finance | 188.53 | 100 | -1.16% | -5.25% |
| TOWN | Townebank Portsmouth | | Banks - Regional | 36.69 | 30 | 0.14% | -5.31% |
| VINP | Vi Compass | | Asset Mgmt | 10.06 | 30 | -0.20% | -5.32% |
| HLNE | Hamilton Lane | | Asset Mgmt | 154.34 | 10 | -0.37% | -5.42% |
| AMP | Ameriprise | | Asset Mgmt | 488.33 | 0 | -4.60% | -5.53% |
| LDI | LoanDepot | | Mortgage Finance | 2.14 | 100 | -2.59% | -5.53% |
| OWL | Blue Owl | | Asset Mgmt | 18.52 | 0 | -0.05% | -5.60% |
| KKR | KKR | | Asset Mgmt | 139.49 | 10 | -0.18% | -5.63% |
| PWP | Perella Weinberg | | Capital Markets | 22.13 | 50 | -0.89% | -5.64% |
| GCBC | Greene County | | Banks - Regional | 23.99 | 20 | -2.16% | -5.65% |
| STEP | StepStone | | Asset Mgmt | 62.06 | 30 | 0.24% | -5.66% |
| CBOE | Cboe Global | | Financial Data & Stock Exchanges | 232.21 | 20 | -0.84% | -5.77% |
| APAM | Artisan Partners | | Asset Mgmt | 46.79 | 40 | -0.53% | -5.96% |
| OPRT | Oportun | | Credit Services | 6.61 | 60 | 3.37% | -5.98% |
| GPMT | Granite Point | | REIT - Mortgage | 2.89 | 100 | -3.96% | -5.99% |
| RKT | Rocket | | Mortgage Finance | 17.77 | 100 | -1.01% | -6.09% |
| KINS | Kingstone Cos | | Insurance - Property & Casualty | 13.46 | 60 | 2.71% | -6.15% |
| AMT | American Tower | | REIT - Specialty | 198.7 | 30 | 1.85% | -6.22% |
| CNS | Cohen & Steers | | Asset Mgmt | 73.86 | 40 | -2.00% | -6.24% |
| PMTS | CPI Card | | Credit Services | 15.58 | 10 | -1.07% | -6.30% |
| TPG | TPG | | Asset Mgmt | 60.35 | 66 | 0.81% | -6.36% |
| For chart view version of above stock list: Chart View ➞ 0 - 25 , 25 - 50 , 50 - 75 , 75 - 100 , 100 - 125 , 125 - 150 , 150 - 175 , 175 - 200 , 200 - 225 , 225 - 250 , 250 - 275 , 275 - 300 , 300 - 325 , 325 - 350 , 350 - 375 , 375 - 400 , 400 - 425 , 425 - 450 , 450 - 475 , 475 - 500 , 500 - 525 , 525 - 550 , 550 - 575 , 575 - 600 , 600 - 625 , 625 - 650 , 650 - 675 , 675 - 700 , 700 - 725 , 725 - 750 , 750 - 775 , 775 - 800 , 800 - 825 , 825 - 850 , 850 - 875 , 875 - 900 , 900 - 925 , 925 - 950 , 950 - 975 , 975 - 1000 , 1000 - 1025 , 1025 - 1050 , 1050 - 1075 , 1075 - 1100 | ||
 | Click To Change The Sort Order: By Market Cap or Company Size Performance: Year-to-date, Week and Day |  |
|
Get the most comprehensive stock market coverage daily at 12Stocks.com ➞ Best Stocks Today ➞ Best Stocks Weekly ➞ Best Stocks Year-to-Date ➞ Best Stocks Trends ➞  Best Stocks Today 12Stocks.com Best Nasdaq Stocks ➞ Best S&P 500 Stocks ➞ Best Tech Stocks ➞ Best Biotech Stocks ➞ |
| Detailed Overview of Financial Stocks |
| Financial Technical Overview, Leaders & Laggards, Top Financial ETF Funds & Detailed Financial Stocks List, Charts, Trends & More |
| Financial Sector: Technical Analysis, Trends & YTD Performance | |
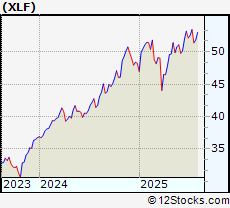
| Financial sector is composed of stocks
from banks, brokers, insurance, REITs
and services subsectors. Financial sector, as represented by XLF, an exchange-traded fund [ETF] that holds basket of Financial stocks (e.g, Bank of America, Goldman Sachs) is up by 3.84% and is currently underperforming the overall market by -3.88% year-to-date. Below is a quick view of Technical charts and trends: |
|
 XLF Weekly Chart |
|
| Long Term Trend: Good | |
| Medium Term Trend: Good | |
 XLF Daily Chart |
|
| Short Term Trend: Not Good | |
| Overall Trend Score: 30 | |
| YTD Performance: 3.84% | |
| **Trend Scores & Views Are Only For Educational Purposes And Not For Investing | |
| 12Stocks.com: Top Performing Financial Sector Stocks | ||||||||||||||||||||||||||||||||||||||||||||||||
 The top performing Financial sector stocks year to date are
Now, more recently, over last week, the top performing Financial sector stocks on the move are


|
||||||||||||||||||||||||||||||||||||||||||||||||
| 12Stocks.com: Investing in Financial Sector using Exchange Traded Funds | |
|
The following table shows list of key exchange traded funds (ETF) that
help investors track Financial Index. For detailed view, check out our ETF Funds section of our website. Quick View: Move mouse or cursor over ETF symbol (ticker) to view short-term Technical chart and over ETF name to view long term chart. Click on ticker or stock name for detailed view. Click on to add stock symbol to your watchlist and to view watchlist. |
12Stocks.com List of ETFs that track Financial Index
| Ticker | ETF Name | Watchlist | Recent Price | Smart Investing & Trading Score | Change % | Week % | Year-to-date % |
| 12Stocks.com: Charts, Trends, Fundamental Data and Performances of Financial Stocks | |
|
We now take in-depth look at all Financial stocks including charts, multi-period performances and overall trends (as measured by Smart Investing & Trading Score). One can sort Financial stocks (click link to choose) by Daily, Weekly and by Year-to-Date performances. Also, one can sort by size of the company or by market capitalization. |
| Select Your Default Chart Type: | |||||
| |||||
| Click on stock symbol or name for detailed view. Click on to add stock symbol to your watchlist and to view watchlist. Quick View: Move mouse or cursor over "Daily" to quickly view daily Technical stock chart and over "Weekly" to view weekly Technical stock chart. | |||||

 | FGBI First Guaranty Bancshares Inc |
| Sector: Financials | |
| SubSector: Banks - Regional | |
| MarketCap: 129.58 Millions | |
| Recent Price: 8.42 Smart Investing & Trading Score: 100 | |
| Day Percent Change: -4.11% Day Change: -0.33 | |
| Week Change: -5.17% Year-to-date Change: -32.1% | |
| FGBI Links: Profile News Message Board | |
| Charts:- Daily , Weekly | |
| Add FGBI to Watchlist: View: Get Complete FGBI Trend Analysis ➞ | |
 | BGC BGC Group Inc |
| Sector: Financials | |
| SubSector: Capital Markets | |
| MarketCap: 4714.69 Millions | |
| Recent Price: 9.81 Smart Investing & Trading Score: 40 | |
| Day Percent Change: 0.31% Day Change: 0.03 | |
| Week Change: -5.19% Year-to-date Change: 9.3% | |
| BGC Links: Profile News Message Board | |
| Charts:- Daily , Weekly | |
| Add BGC to Watchlist: View: Get Complete BGC Trend Analysis ➞ | |
 | DB Deutsche Bank AG |
| Sector: Financials | |
| SubSector: Banks - Regional | |
| MarketCap: 67800.5 Millions | |
| Recent Price: 35.2 Smart Investing & Trading Score: 60 | |
| Day Percent Change: -0.34% Day Change: -0.12 | |
| Week Change: -5.25% Year-to-date Change: 84.8% | |
| DB Links: Profile News Message Board | |
| Charts:- Daily , Weekly | |
| Add DB to Watchlist: View: Get Complete DB Trend Analysis ➞ | |
 | TWO Two Harbors Investment Corp |
| Sector: Financials | |
| SubSector: REIT - Mortgage | |
| MarketCap: 1078.81 Millions | |
| Recent Price: 10.00 Smart Investing & Trading Score: 90 | |
| Day Percent Change: -5.53% Day Change: -0.56 | |
| Week Change: -5.25% Year-to-date Change: -9.7% | |
| TWO Links: Profile News Message Board | |
| Charts:- Daily , Weekly | |
| Add TWO to Watchlist: View: Get Complete TWO Trend Analysis ➞ | |
 | COOP Mr. Cooper Group Inc |
| Sector: Financials | |
| SubSector: Mortgage Finance | |
| MarketCap: 13637.6 Millions | |
| Recent Price: 188.53 Smart Investing & Trading Score: 100 | |
| Day Percent Change: -1.16% Day Change: -2.14 | |
| Week Change: -5.25% Year-to-date Change: 91.1% | |
| COOP Links: Profile News Message Board | |
| Charts:- Daily , Weekly | |
| Add COOP to Watchlist: View: Get Complete COOP Trend Analysis ➞ | |
 | TOWN Townebank Portsmouth VA |
| Sector: Financials | |
| SubSector: Banks - Regional | |
| MarketCap: 2944.04 Millions | |
| Recent Price: 36.69 Smart Investing & Trading Score: 30 | |
| Day Percent Change: 0.14% Day Change: 0.05 | |
| Week Change: -5.31% Year-to-date Change: 5.8% | |
| TOWN Links: Profile News Message Board | |
| Charts:- Daily , Weekly | |
| Add TOWN to Watchlist: View: Get Complete TOWN Trend Analysis ➞ | |
 | VINP Vinci Compass Investments Ltd |
| Sector: Financials | |
| SubSector: Asset Management | |
| MarketCap: 641.93 Millions | |
| Recent Price: 10.06 Smart Investing & Trading Score: 30 | |
| Day Percent Change: -0.2% Day Change: -0.02 | |
| Week Change: -5.32% Year-to-date Change: 0.2% | |
| VINP Links: Profile News Message Board | |
| Charts:- Daily , Weekly | |
| Add VINP to Watchlist: View: Get Complete VINP Trend Analysis ➞ | |
 | HLNE Hamilton Lane Inc |
| Sector: Financials | |
| SubSector: Asset Management | |
| MarketCap: 8191.13 Millions | |
| Recent Price: 154.34 Smart Investing & Trading Score: 10 | |
| Day Percent Change: -0.37% Day Change: -0.56 | |
| Week Change: -5.42% Year-to-date Change: 2.0% | |
| HLNE Links: Profile News Message Board | |
| Charts:- Daily , Weekly | |
| Add HLNE to Watchlist: View: Get Complete HLNE Trend Analysis ➞ | |
 | AMP Ameriprise Financial Inc |
| Sector: Financials | |
| SubSector: Asset Management | |
| MarketCap: 46125.2 Millions | |
| Recent Price: 488.33 Smart Investing & Trading Score: 0 | |
| Day Percent Change: -4.6% Day Change: -23.57 | |
| Week Change: -5.53% Year-to-date Change: -9.3% | |
| AMP Links: Profile News Message Board | |
| Charts:- Daily , Weekly | |
| Add AMP to Watchlist: View: Get Complete AMP Trend Analysis ➞ | |
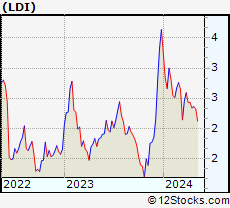 | LDI LoanDepot Inc |
| Sector: Financials | |
| SubSector: Mortgage Finance | |
| MarketCap: 956.38 Millions | |
| Recent Price: 2.14 Smart Investing & Trading Score: 100 | |
| Day Percent Change: -2.59% Day Change: -0.05 | |
| Week Change: -5.53% Year-to-date Change: -7.8% | |
| LDI Links: Profile News Message Board | |
| Charts:- Daily , Weekly | |
| Add LDI to Watchlist: View: Get Complete LDI Trend Analysis ➞ | |
 | OWL Blue Owl Capital Inc |
| Sector: Financials | |
| SubSector: Asset Management | |
| MarketCap: 27565.7 Millions | |
| Recent Price: 18.52 Smart Investing & Trading Score: 0 | |
| Day Percent Change: -0.05% Day Change: -0.01 | |
| Week Change: -5.6% Year-to-date Change: -18.7% | |
| OWL Links: Profile News Message Board | |
| Charts:- Daily , Weekly | |
| Add OWL to Watchlist: View: Get Complete OWL Trend Analysis ➞ | |
 | KKR KKR & Co. Inc |
| Sector: Financials | |
| SubSector: Asset Management | |
| MarketCap: 120750 Millions | |
| Recent Price: 139.49 Smart Investing & Trading Score: 10 | |
| Day Percent Change: -0.18% Day Change: -0.25 | |
| Week Change: -5.63% Year-to-date Change: -6.4% | |
| KKR Links: Profile News Message Board | |
| Charts:- Daily , Weekly | |
| Add KKR to Watchlist: View: Get Complete KKR Trend Analysis ➞ | |
 | PWP Perella Weinberg Partners |
| Sector: Financials | |
| SubSector: Capital Markets | |
| MarketCap: 1900.92 Millions | |
| Recent Price: 22.13 Smart Investing & Trading Score: 50 | |
| Day Percent Change: -0.89% Day Change: -0.19 | |
| Week Change: -5.64% Year-to-date Change: -11.0% | |
| PWP Links: Profile News Message Board | |
| Charts:- Daily , Weekly | |
| Add PWP to Watchlist: View: Get Complete PWP Trend Analysis ➞ | |
 | GCBC Greene County Bancorp Inc |
| Sector: Financials | |
| SubSector: Banks - Regional | |
| MarketCap: 396.73 Millions | |
| Recent Price: 23.99 Smart Investing & Trading Score: 20 | |
| Day Percent Change: -2.16% Day Change: -0.51 | |
| Week Change: -5.65% Year-to-date Change: -16.2% | |
| GCBC Links: Profile News Message Board | |
| Charts:- Daily , Weekly | |
| Add GCBC to Watchlist: View: Get Complete GCBC Trend Analysis ➞ | |
 | STEP StepStone Group Inc |
| Sector: Financials | |
| SubSector: Asset Management | |
| MarketCap: 7189.68 Millions | |
| Recent Price: 62.06 Smart Investing & Trading Score: 30 | |
| Day Percent Change: 0.24% Day Change: 0.14 | |
| Week Change: -5.66% Year-to-date Change: 3.0% | |
| STEP Links: Profile News Message Board | |
| Charts:- Daily , Weekly | |
| Add STEP to Watchlist: View: Get Complete STEP Trend Analysis ➞ | |
 | CBOE Cboe Global Markets Inc |
| Sector: Financials | |
| SubSector: Financial Data & Stock Exchanges | |
| MarketCap: 24325.6 Millions | |
| Recent Price: 232.21 Smart Investing & Trading Score: 20 | |
| Day Percent Change: -0.84% Day Change: -1.96 | |
| Week Change: -5.77% Year-to-date Change: 14.3% | |
| CBOE Links: Profile News Message Board | |
| Charts:- Daily , Weekly | |
| Add CBOE to Watchlist: View: Get Complete CBOE Trend Analysis ➞ | |
 | APAM Artisan Partners Asset Management Inc |
| Sector: Financials | |
| SubSector: Asset Management | |
| MarketCap: 3736.7 Millions | |
| Recent Price: 46.79 Smart Investing & Trading Score: 40 | |
| Day Percent Change: -0.53% Day Change: -0.24 | |
| Week Change: -5.96% Year-to-date Change: 9.3% | |
| APAM Links: Profile News Message Board | |
| Charts:- Daily , Weekly | |
| Add APAM to Watchlist: View: Get Complete APAM Trend Analysis ➞ | |
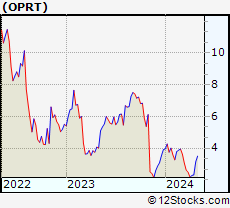 | OPRT Oportun Financial Corp |
| Sector: Financials | |
| SubSector: Credit Services | |
| MarketCap: 289.14 Millions | |
| Recent Price: 6.61 Smart Investing & Trading Score: 60 | |
| Day Percent Change: 3.37% Day Change: 0.19 | |
| Week Change: -5.98% Year-to-date Change: 50.0% | |
| OPRT Links: Profile News Message Board | |
| Charts:- Daily , Weekly | |
| Add OPRT to Watchlist: View: Get Complete OPRT Trend Analysis ➞ | |
 | GPMT Granite Point Mortgage Trust Inc |
| Sector: Financials | |
| SubSector: REIT - Mortgage | |
| MarketCap: 142.66 Millions | |
| Recent Price: 2.89 Smart Investing & Trading Score: 100 | |
| Day Percent Change: -3.96% Day Change: -0.11 | |
| Week Change: -5.99% Year-to-date Change: -0.4% | |
| GPMT Links: Profile News Message Board | |
| Charts:- Daily , Weekly | |
| Add GPMT to Watchlist: View: Get Complete GPMT Trend Analysis ➞ | |
 | RKT Rocket Companies Inc |
| Sector: Financials | |
| SubSector: Mortgage Finance | |
| MarketCap: 42637.6 Millions | |
| Recent Price: 17.77 Smart Investing & Trading Score: 100 | |
| Day Percent Change: -1.01% Day Change: -0.18 | |
| Week Change: -6.09% Year-to-date Change: 65.0% | |
| RKT Links: Profile News Message Board | |
| Charts:- Daily , Weekly | |
| Add RKT to Watchlist: View: Get Complete RKT Trend Analysis ➞ | |
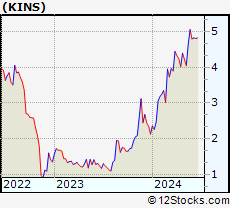 | KINS Kingstone Cos. Inc |
| Sector: Financials | |
| SubSector: Insurance - Property & Casualty | |
| MarketCap: 193.87 Millions | |
| Recent Price: 13.46 Smart Investing & Trading Score: 60 | |
| Day Percent Change: 2.71% Day Change: 0.37 | |
| Week Change: -6.15% Year-to-date Change: -7.3% | |
| KINS Links: Profile News Message Board | |
| Charts:- Daily , Weekly | |
| Add KINS to Watchlist: View: Get Complete KINS Trend Analysis ➞ | |
 | AMT American Tower Corp |
| Sector: Financials | |
| SubSector: REIT - Specialty | |
| MarketCap: 92863.6 Millions | |
| Recent Price: 198.7 Smart Investing & Trading Score: 30 | |
| Day Percent Change: 1.85% Day Change: 3.61 | |
| Week Change: -6.22% Year-to-date Change: 9.2% | |
| AMT Links: Profile News Message Board | |
| Charts:- Daily , Weekly | |
| Add AMT to Watchlist: View: Get Complete AMT Trend Analysis ➞ | |
 | CNS Cohen & Steers Inc |
| Sector: Financials | |
| SubSector: Asset Management | |
| MarketCap: 3699.3 Millions | |
| Recent Price: 73.86 Smart Investing & Trading Score: 40 | |
| Day Percent Change: -2% Day Change: -1.47 | |
| Week Change: -6.24% Year-to-date Change: -20.4% | |
| CNS Links: Profile News Message Board | |
| Charts:- Daily , Weekly | |
| Add CNS to Watchlist: View: Get Complete CNS Trend Analysis ➞ | |
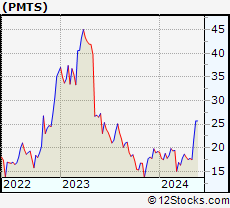 | PMTS CPI Card Group Inc |
| Sector: Financials | |
| SubSector: Credit Services | |
| MarketCap: 162.12 Millions | |
| Recent Price: 15.58 Smart Investing & Trading Score: 10 | |
| Day Percent Change: -1.07% Day Change: -0.16 | |
| Week Change: -6.3% Year-to-date Change: -50.7% | |
| PMTS Links: Profile News Message Board | |
| Charts:- Daily , Weekly | |
| Add PMTS to Watchlist: View: Get Complete PMTS Trend Analysis ➞ | |
 | TPG TPG Inc |
| Sector: Financials | |
| SubSector: Asset Management | |
| MarketCap: 22113 Millions | |
| Recent Price: 60.35 Smart Investing & Trading Score: 66 | |
| Day Percent Change: 0.81% Day Change: 0.48 | |
| Week Change: -6.36% Year-to-date Change: -2.7% | |
| TPG Links: Profile News Message Board | |
| Charts:- Daily , Weekly | |
| Add TPG to Watchlist: View: Get Complete TPG Trend Analysis ➞ | |
| For tabular summary view of above stock list: Summary View ➞ 0 - 25 , 25 - 50 , 50 - 75 , 75 - 100 , 100 - 125 , 125 - 150 , 150 - 175 , 175 - 200 , 200 - 225 , 225 - 250 , 250 - 275 , 275 - 300 , 300 - 325 , 325 - 350 , 350 - 375 , 375 - 400 , 400 - 425 , 425 - 450 , 450 - 475 , 475 - 500 , 500 - 525 , 525 - 550 , 550 - 575 , 575 - 600 , 600 - 625 , 625 - 650 , 650 - 675 , 675 - 700 , 700 - 725 , 725 - 750 , 750 - 775 , 775 - 800 , 800 - 825 , 825 - 850 , 850 - 875 , 875 - 900 , 900 - 925 , 925 - 950 , 950 - 975 , 975 - 1000 , 1000 - 1025 , 1025 - 1050 , 1050 - 1075 , 1075 - 1100 | ||
| Click To Change The Sort Order: By Market Cap or Company Size Performance: Year-to-date, Week and Day | |
| Select Chart Type: | ||
|
Best Stocks Today 12Stocks.com |
© 2025 12Stocks.com Terms & Conditions Privacy Contact Us
All Information Provided Only For Education And Not To Be Used For Investing or Trading. See Terms & Conditions


One More Thing ... Get Best Stocks Delivered Daily!
Never Ever Miss A Move With Our Top Ten Stocks Lists
Find Best Stocks In Any Market - Bull or Bear Market
Take A Peek At Our Top Ten Stocks Lists: Daily, Weekly, Year-to-Date & Top Trends
Find Best Stocks In Any Market - Bull or Bear Market
Take A Peek At Our Top Ten Stocks Lists: Daily, Weekly, Year-to-Date & Top Trends
Financial Stocks With Best Up Trends [0-bearish to 100-bullish]: Compass [100], Western Union[100], Whitestone REIT[100], Healthcare Realty[100], Public Storage[100], Alexandria Real[100], Omega Healthcare[100], LendingTree [100], Federal Realty[100], OFS Capital[100], BXP [100]
Best Financial Stocks Year-to-Date:
ESSA Bancorp[2923.51%], Robinhood Markets[185.29%], Solowin [161.21%], Metalpha Technology[143.48%], IHS Holding[139.04%], Altisource Portfolio[127.41%], Banco Santander[113.19%], Banco Bilbao[102.83%], IREN [99.49%], Grupo Cibest[93.5%], Mr. Cooper[91.06%] Best Financial Stocks This Week:
Plymouth Industrial[40.4%], SelectQuote [30.15%], Altisource Portfolio[24.32%], Seritage Growth[20.21%], MBIA [18.44%], Nu [13.82%], Qudian [11.08%], Cipher Mining[10.9%], Brookfield Business[10.18%], BXP [9.64%], Stratus Properties[8.94%] Best Financial Stocks Daily:
SelectQuote [41.53%], X [15.73%], Altisource Portfolio[9.12%], Aegon [7.64%], UP Fintech[6.65%], FinVolution [5.55%], Hippo [5.47%], Lufax Holding[5.45%], eHealth [4.65%], MarketAxess [4.54%], Yiren Digital[3.6%]