
 Login Sign Up


| |||||
 |  | ||||

| 12Stocks.com Market Intelligence |
Best Financial Stocks
| In a hurry? Financial Stocks Lists: Performance Trends Table, Stock Charts
Sort Financial stocks: Daily, Weekly, Year-to-Date, Market Cap & Trends. Filter Financial stocks list by size:All Financial Large Mid-Range Small & MicroCap |
| 12Stocks.com Financial Stocks Performances & Trends Daily | |||||||||
|
|  The overall Smart Investing & Trading Score is 30 (0-bearish to 100-bullish) which puts Financial sector in short term bearish to neutral trend. The Smart Investing & Trading Score from previous trading session is 100 and a deterioration of trend continues.
| ||||||||
Here are the Smart Investing & Trading Scores of the most requested Financial stocks at 12Stocks.com (click stock name for detailed review):
|


| 12Stocks.com: Investing in Financial sector with Stocks | |
|
The following table helps investors and traders sort through current performance and trends (as measured by Smart Investing & Trading Score) of various
stocks in the Financial sector. Quick View: Move mouse or cursor over stock symbol (ticker) to view short-term Technical chart and over stock name to view long term chart. Click on  to add stock symbol to your watchlist and to add stock symbol to your watchlist and  to view watchlist. Click on any ticker or stock name for detailed market intelligence report for that stock. to view watchlist. Click on any ticker or stock name for detailed market intelligence report for that stock. |
12Stocks.com Performance of Stocks in Financial Sector
| Ticker | Stock Name | Watchlist | Category | Recent Price | Smart Investing & Trading Score | Change % | Weekly Change% |
| JHG | Janus Henderson |   | Asset Mgmt | 44.32 | 70 | -0.31% | -4.19% |
| KB | KB | | Banks - Regional | 78.66 | 10 | 0.09% | -4.23% |
| FFWM | First Foundation | | Banks - Regional | 5.95 | 90 | -0.37% | -4.26% |
| BLK | Blackrock | | Asset Mgmt | 1099.15 | 20 | -0.87% | -4.27% |
| RMAX | RE/MAX | | Real Estate Services | 9.42 | 100 | -1.99% | -4.44% |
| STK | Columbia Seligman | | Closed-End Fund - Equity | 31.73 | 100 | -0.52% | -4.44% |
| RVSB | Riverview Bancorp | | Banks - Regional | 5.06 | 50 | -1.60% | -4.47% |
| PJT | PJT Partners | | Capital Markets | 179.00 | 60 | -0.82% | -4.52% |
| SF | Stifel | | Capital Markets | 115.29 | 10 | -0.31% | -4.53% |
| USCB | USCB | | Banks - Regional | 17.39 | 70 | -1.25% | -4.55% |
| LION | Lionsgate Studios | | Shell Companies | 6.43 | 10 | 0.64% | -4.58% |
| PRU | Prudential | | Insurance - Life | 104.85 | 0 | -3.67% | -4.59% |
| PFSI | PennyMac | | Mortgage Finance | 110.10 | 100 | -1.80% | -4.63% |
| ALTI | AlTi Global | | Asset Mgmt | 4.33 | 10 | -1.20% | -4.63% |
| ABR | Arbor Realty | | REIT - Mortgage | 11.94 | 90 | -2.15% | -4.70% |
| VRTS | Virtus | | Asset Mgmt | 201.43 | 20 | -1.12% | -4.71% |
| ITUB | Itau Unibanco | | Banks - Regional | 7.14 | 100 | 0.15% | -4.73% |
| APO | Apollo Global | | Asset Mgmt | 136.23 | 0 | -0.98% | -4.74% |
| NCTY | The9 | | Capital Markets | 9.15 | 90 | 2.23% | -4.89% |
| INTR | Inter & Co | | Banks - Regional | 8.59 | 43 | 0.13% | -4.90% |
| BRDG | Bridge | | Asset Mgmt | 9.60 | 50 | -1.15% | -4.92% |
| BAM | Brookfield Asset | | Asset Mgmt | 60.16 | 10 | -0.61% | -4.99% |
| AIG | American | | Insurance - | 79.21 | 0 | -3.08% | -5.00% |
| BMA | Banco Macro | | Banks - Regional | 57.93 | 40 | -0.35% | -5.03% |
| EQH | Equitable | | Asset Mgmt | 53.26 | 40 | -0.40% | -5.07% |
| For chart view version of above stock list: Chart View ➞ 0 - 25 , 25 - 50 , 50 - 75 , 75 - 100 , 100 - 125 , 125 - 150 , 150 - 175 , 175 - 200 , 200 - 225 , 225 - 250 , 250 - 275 , 275 - 300 , 300 - 325 , 325 - 350 , 350 - 375 , 375 - 400 , 400 - 425 , 425 - 450 , 450 - 475 , 475 - 500 , 500 - 525 , 525 - 550 , 550 - 575 , 575 - 600 , 600 - 625 , 625 - 650 , 650 - 675 , 675 - 700 , 700 - 725 , 725 - 750 , 750 - 775 , 775 - 800 , 800 - 825 , 825 - 850 , 850 - 875 , 875 - 900 , 900 - 925 , 925 - 950 , 950 - 975 , 975 - 1000 , 1000 - 1025 , 1025 - 1050 , 1050 - 1075 , 1075 - 1100 | ||
 | Click To Change The Sort Order: By Market Cap or Company Size Performance: Year-to-date, Week and Day |  |
|
Get the most comprehensive stock market coverage daily at 12Stocks.com ➞ Best Stocks Today ➞ Best Stocks Weekly ➞ Best Stocks Year-to-Date ➞ Best Stocks Trends ➞  Best Stocks Today 12Stocks.com Best Nasdaq Stocks ➞ Best S&P 500 Stocks ➞ Best Tech Stocks ➞ Best Biotech Stocks ➞ |
| Detailed Overview of Financial Stocks |
| Financial Technical Overview, Leaders & Laggards, Top Financial ETF Funds & Detailed Financial Stocks List, Charts, Trends & More |
| Financial Sector: Technical Analysis, Trends & YTD Performance | |
| Financial sector is composed of stocks
from banks, brokers, insurance, REITs
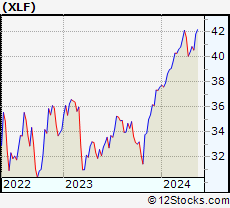
and services subsectors. Financial sector, as represented by XLF, an exchange-traded fund [ETF] that holds basket of Financial stocks (e.g, Bank of America, Goldman Sachs) is up by 3.84% and is currently underperforming the overall market by -3.88% year-to-date. Below is a quick view of Technical charts and trends: |
|
 XLF Weekly Chart |
|
| Long Term Trend: Good | |
| Medium Term Trend: Good | |
 XLF Daily Chart |
|
| Short Term Trend: Not Good | |
| Overall Trend Score: 30 | |
| YTD Performance: 3.84% | |
| **Trend Scores & Views Are Only For Educational Purposes And Not For Investing | |
| 12Stocks.com: Top Performing Financial Sector Stocks | ||||||||||||||||||||||||||||||||||||||||||||||||
 The top performing Financial sector stocks year to date are
Now, more recently, over last week, the top performing Financial sector stocks on the move are


|
||||||||||||||||||||||||||||||||||||||||||||||||
| 12Stocks.com: Investing in Financial Sector using Exchange Traded Funds | |
|
The following table shows list of key exchange traded funds (ETF) that
help investors track Financial Index. For detailed view, check out our ETF Funds section of our website. Quick View: Move mouse or cursor over ETF symbol (ticker) to view short-term Technical chart and over ETF name to view long term chart. Click on ticker or stock name for detailed view. Click on to add stock symbol to your watchlist and to view watchlist. |
12Stocks.com List of ETFs that track Financial Index
| Ticker | ETF Name | Watchlist | Recent Price | Smart Investing & Trading Score | Change % | Week % | Year-to-date % |
| 12Stocks.com: Charts, Trends, Fundamental Data and Performances of Financial Stocks | |
|
We now take in-depth look at all Financial stocks including charts, multi-period performances and overall trends (as measured by Smart Investing & Trading Score). One can sort Financial stocks (click link to choose) by Daily, Weekly and by Year-to-Date performances. Also, one can sort by size of the company or by market capitalization. |
| Select Your Default Chart Type: | |||||
| |||||
| Click on stock symbol or name for detailed view. Click on to add stock symbol to your watchlist and to view watchlist. Quick View: Move mouse or cursor over "Daily" to quickly view daily Technical stock chart and over "Weekly" to view weekly Technical stock chart. | |||||

 | JHG Janus Henderson Group plc |
| Sector: Financials | |
| SubSector: Asset Management | |
| MarketCap: 6906.73 Millions | |
| Recent Price: 44.32 Smart Investing & Trading Score: 70 | |
| Day Percent Change: -0.31% Day Change: -0.13 | |
| Week Change: -4.19% Year-to-date Change: 2.4% | |
| JHG Links: Profile News Message Board | |
| Charts:- Daily , Weekly | |
| Add JHG to Watchlist: View: Get Complete JHG Trend Analysis ➞ | |
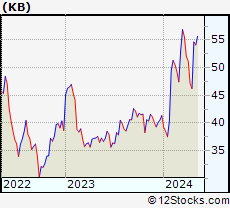 | KB KB Financial Group Inc ADR |
| Sector: Financials | |
| SubSector: Banks - Regional | |
| MarketCap: 28451 Millions | |
| Recent Price: 78.66 Smart Investing & Trading Score: 10 | |
| Day Percent Change: 0.09% Day Change: 0.07 | |
| Week Change: -4.23% Year-to-date Change: 40.6% | |
| KB Links: Profile News Message Board | |
| Charts:- Daily , Weekly | |
| Add KB to Watchlist: View: Get Complete KB Trend Analysis ➞ | |
 | FFWM First Foundation Inc |
| Sector: Financials | |
| SubSector: Banks - Regional | |
| MarketCap: 501.73 Millions | |
| Recent Price: 5.95 Smart Investing & Trading Score: 90 | |
| Day Percent Change: -0.37% Day Change: -0.02 | |
| Week Change: -4.26% Year-to-date Change: -13.0% | |
| FFWM Links: Profile News Message Board | |
| Charts:- Daily , Weekly | |
| Add FFWM to Watchlist: View: Get Complete FFWM Trend Analysis ➞ | |
 | BLK Blackrock Inc |
| Sector: Financials | |
| SubSector: Asset Management | |
| MarketCap: 179366 Millions | |
| Recent Price: 1099.15 Smart Investing & Trading Score: 20 | |
| Day Percent Change: -0.87% Day Change: -9.61 | |
| Week Change: -4.27% Year-to-date Change: 3.3% | |
| BLK Links: Profile News Message Board | |
| Charts:- Daily , Weekly | |
| Add BLK to Watchlist: View: Get Complete BLK Trend Analysis ➞ | |
 | RMAX RE/MAX Holdings Inc |
| Sector: Financials | |
| SubSector: Real Estate Services | |
| MarketCap: 316.12 Millions | |
| Recent Price: 9.42 Smart Investing & Trading Score: 100 | |
| Day Percent Change: -1.99% Day Change: -0.17 | |
| Week Change: -4.44% Year-to-date Change: -21.4% | |
| RMAX Links: Profile News Message Board | |
| Charts:- Daily , Weekly | |
| Add RMAX to Watchlist: View: Get Complete RMAX Trend Analysis ➞ | |
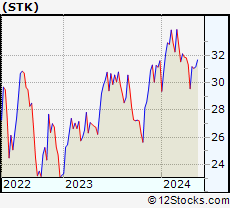 | STK Columbia Seligman Premium Technology Growth Fund Inc |
| Sector: Financials | |
| SubSector: Closed-End Fund - Equity | |
| MarketCap: 556.57 Millions | |
| Recent Price: 31.73 Smart Investing & Trading Score: 100 | |
| Day Percent Change: -0.52% Day Change: -0.16 | |
| Week Change: -4.44% Year-to-date Change: -1.5% | |
| STK Links: Profile News Message Board | |
| Charts:- Daily , Weekly | |
| Add STK to Watchlist: View: Get Complete STK Trend Analysis ➞ | |
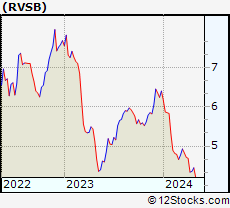 | RVSB Riverview Bancorp, Inc |
| Sector: Financials | |
| SubSector: Banks - Regional | |
| MarketCap: 105.58 Millions | |
| Recent Price: 5.06 Smart Investing & Trading Score: 50 | |
| Day Percent Change: -1.6% Day Change: -0.08 | |
| Week Change: -4.47% Year-to-date Change: -13.6% | |
| RVSB Links: Profile News Message Board | |
| Charts:- Daily , Weekly | |
| Add RVSB to Watchlist: View: Get Complete RVSB Trend Analysis ➞ | |
 | PJT PJT Partners Inc |
| Sector: Financials | |
| SubSector: Capital Markets | |
| MarketCap: 6267.7 Millions | |
| Recent Price: 179.00 Smart Investing & Trading Score: 60 | |
| Day Percent Change: -0.82% Day Change: -1.45 | |
| Week Change: -4.52% Year-to-date Change: 11.5% | |
| PJT Links: Profile News Message Board | |
| Charts:- Daily , Weekly | |
| Add PJT to Watchlist: View: Get Complete PJT Trend Analysis ➞ | |
 | SF Stifel Financial Corp |
| Sector: Financials | |
| SubSector: Capital Markets | |
| MarketCap: 11502.7 Millions | |
| Recent Price: 115.29 Smart Investing & Trading Score: 10 | |
| Day Percent Change: -0.31% Day Change: -0.34 | |
| Week Change: -4.53% Year-to-date Change: 5.3% | |
| SF Links: Profile News Message Board | |
| Charts:- Daily , Weekly | |
| Add SF to Watchlist: View: Get Complete SF Trend Analysis ➞ | |
 | USCB USCB Financial Holdings Inc |
| Sector: Financials | |
| SubSector: Banks - Regional | |
| MarketCap: 349.97 Millions | |
| Recent Price: 17.39 Smart Investing & Trading Score: 70 | |
| Day Percent Change: -1.25% Day Change: -0.21 | |
| Week Change: -4.55% Year-to-date Change: -5.5% | |
| USCB Links: Profile News Message Board | |
| Charts:- Daily , Weekly | |
| Add USCB to Watchlist: View: Get Complete USCB Trend Analysis ➞ | |
 | LION Lionsgate Studios Corp |
| Sector: Financials | |
| SubSector: Shell Companies | |
| MarketCap: 1783.43 Millions | |
| Recent Price: 6.43 Smart Investing & Trading Score: 10 | |
| Day Percent Change: 0.64% Day Change: 0.04 | |
| Week Change: -4.58% Year-to-date Change: -17.8% | |
| LION Links: Profile News Message Board | |
| Charts:- Daily , Weekly | |
| Add LION to Watchlist: View: Get Complete LION Trend Analysis ➞ | |
 | PRU Prudential Financial Inc |
| Sector: Financials | |
| SubSector: Insurance - Life | |
| MarketCap: 37209.9 Millions | |
| Recent Price: 104.85 Smart Investing & Trading Score: 0 | |
| Day Percent Change: -3.67% Day Change: -3.99 | |
| Week Change: -4.59% Year-to-date Change: -11.0% | |
| PRU Links: Profile News Message Board | |
| Charts:- Daily , Weekly | |
| Add PRU to Watchlist: View: Get Complete PRU Trend Analysis ➞ | |
 | PFSI PennyMac Financial Services Inc |
| Sector: Financials | |
| SubSector: Mortgage Finance | |
| MarketCap: 6075.41 Millions | |
| Recent Price: 110.10 Smart Investing & Trading Score: 100 | |
| Day Percent Change: -1.8% Day Change: -1.9 | |
| Week Change: -4.63% Year-to-date Change: 1.8% | |
| PFSI Links: Profile News Message Board | |
| Charts:- Daily , Weekly | |
| Add PFSI to Watchlist: View: Get Complete PFSI Trend Analysis ➞ | |
 | ALTI AlTi Global Inc |
| Sector: Financials | |
| SubSector: Asset Management | |
| MarketCap: 607.14 Millions | |
| Recent Price: 4.33 Smart Investing & Trading Score: 10 | |
| Day Percent Change: -1.2% Day Change: -0.05 | |
| Week Change: -4.63% Year-to-date Change: -6.6% | |
| ALTI Links: Profile News Message Board | |
| Charts:- Daily , Weekly | |
| Add ALTI to Watchlist: View: Get Complete ALTI Trend Analysis ➞ | |
 | ABR Arbor Realty Trust Inc |
| Sector: Financials | |
| SubSector: REIT - Mortgage | |
| MarketCap: 2340.31 Millions | |
| Recent Price: 11.94 Smart Investing & Trading Score: 90 | |
| Day Percent Change: -2.15% Day Change: -0.25 | |
| Week Change: -4.7% Year-to-date Change: -12.6% | |
| ABR Links: Profile News Message Board | |
| Charts:- Daily , Weekly | |
| Add ABR to Watchlist: View: Get Complete ABR Trend Analysis ➞ | |
 | VRTS Virtus Investment Partners Inc |
| Sector: Financials | |
| SubSector: Asset Management | |
| MarketCap: 1308.99 Millions | |
| Recent Price: 201.43 Smart Investing & Trading Score: 20 | |
| Day Percent Change: -1.12% Day Change: -2.15 | |
| Week Change: -4.71% Year-to-date Change: -11.1% | |
| VRTS Links: Profile News Message Board | |
| Charts:- Daily , Weekly | |
| Add VRTS to Watchlist: View: Get Complete VRTS Trend Analysis ➞ | |
 | ITUB Itau Unibanco Holding S.A. ADR |
| Sector: Financials | |
| SubSector: Banks - Regional | |
| MarketCap: 37841.9 Millions | |
| Recent Price: 7.14 Smart Investing & Trading Score: 100 | |
| Day Percent Change: 0.15% Day Change: 0.01 | |
| Week Change: -4.73% Year-to-date Change: 56.3% | |
| ITUB Links: Profile News Message Board | |
| Charts:- Daily , Weekly | |
| Add ITUB to Watchlist: View: Get Complete ITUB Trend Analysis ➞ | |
 | APO Apollo Global Management Inc |
| Sector: Financials | |
| SubSector: Asset Management | |
| MarketCap: 75692.1 Millions | |
| Recent Price: 136.23 Smart Investing & Trading Score: 0 | |
| Day Percent Change: -0.98% Day Change: -1.33 | |
| Week Change: -4.74% Year-to-date Change: -18.3% | |
| APO Links: Profile News Message Board | |
| Charts:- Daily , Weekly | |
| Add APO to Watchlist: View: Get Complete APO Trend Analysis ➞ | |
 | NCTY The9 Limited ADR |
| Sector: Financials | |
| SubSector: Capital Markets | |
| MarketCap: 118.27 Millions | |
| Recent Price: 9.15 Smart Investing & Trading Score: 90 | |
| Day Percent Change: 2.23% Day Change: 0.17 | |
| Week Change: -4.89% Year-to-date Change: -46.5% | |
| NCTY Links: Profile News Message Board | |
| Charts:- Daily , Weekly | |
| Add NCTY to Watchlist: View: Get Complete NCTY Trend Analysis ➞ | |
 | INTR Inter & Co Inc |
| Sector: Financials | |
| SubSector: Banks - Regional | |
| MarketCap: 3855.96 Millions | |
| Recent Price: 8.59 Smart Investing & Trading Score: 43 | |
| Day Percent Change: 0.13% Day Change: 0.01 | |
| Week Change: -4.9% Year-to-date Change: 86.9% | |
| INTR Links: Profile News Message Board | |
| Charts:- Daily , Weekly | |
| Add INTR to Watchlist: View: Get Complete INTR Trend Analysis ➞ | |
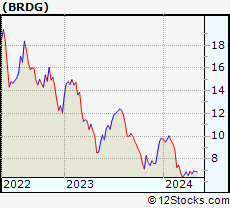 | BRDG Bridge Investment Group Holdings Inc |
| Sector: Financials | |
| SubSector: Asset Management | |
| MarketCap: 2578.25 Millions | |
| Recent Price: 9.60 Smart Investing & Trading Score: 50 | |
| Day Percent Change: -1.15% Day Change: -0.11 | |
| Week Change: -4.92% Year-to-date Change: 14.1% | |
| BRDG Links: Profile News Message Board | |
| Charts:- Daily , Weekly | |
| Add BRDG to Watchlist: View: Get Complete BRDG Trend Analysis ➞ | |
 | BAM Brookfield Asset Management Ltd |
| Sector: Financials | |
| SubSector: Asset Management | |
| MarketCap: 93997.1 Millions | |
| Recent Price: 60.16 Smart Investing & Trading Score: 10 | |
| Day Percent Change: -0.61% Day Change: -0.36 | |
| Week Change: -4.99% Year-to-date Change: 10.6% | |
| BAM Links: Profile News Message Board | |
| Charts:- Daily , Weekly | |
| Add BAM to Watchlist: View: Get Complete BAM Trend Analysis ➞ | |
 | AIG American International Group Inc |
| Sector: Financials | |
| SubSector: Insurance - Diversified | |
| MarketCap: 43882.6 Millions | |
| Recent Price: 79.21 Smart Investing & Trading Score: 0 | |
| Day Percent Change: -3.08% Day Change: -2.52 | |
| Week Change: -5% Year-to-date Change: 8.6% | |
| AIG Links: Profile News Message Board | |
| Charts:- Daily , Weekly | |
| Add AIG to Watchlist: View: Get Complete AIG Trend Analysis ➞ | |
 | BMA Banco Macro S.A. ADR |
| Sector: Financials | |
| SubSector: Banks - Regional | |
| MarketCap: 3700.73 Millions | |
| Recent Price: 57.93 Smart Investing & Trading Score: 40 | |
| Day Percent Change: -0.35% Day Change: -0.23 | |
| Week Change: -5.03% Year-to-date Change: -31.1% | |
| BMA Links: Profile News Message Board | |
| Charts:- Daily , Weekly | |
| Add BMA to Watchlist: View: Get Complete BMA Trend Analysis ➞ | |
 | EQH Equitable Holdings Inc |
| Sector: Financials | |
| SubSector: Asset Management | |
| MarketCap: 15986.3 Millions | |
| Recent Price: 53.26 Smart Investing & Trading Score: 40 | |
| Day Percent Change: -0.4% Day Change: -0.21 | |
| Week Change: -5.07% Year-to-date Change: 11.6% | |
| EQH Links: Profile News Message Board | |
| Charts:- Daily , Weekly | |
| Add EQH to Watchlist: View: Get Complete EQH Trend Analysis ➞ | |
| For tabular summary view of above stock list: Summary View ➞ 0 - 25 , 25 - 50 , 50 - 75 , 75 - 100 , 100 - 125 , 125 - 150 , 150 - 175 , 175 - 200 , 200 - 225 , 225 - 250 , 250 - 275 , 275 - 300 , 300 - 325 , 325 - 350 , 350 - 375 , 375 - 400 , 400 - 425 , 425 - 450 , 450 - 475 , 475 - 500 , 500 - 525 , 525 - 550 , 550 - 575 , 575 - 600 , 600 - 625 , 625 - 650 , 650 - 675 , 675 - 700 , 700 - 725 , 725 - 750 , 750 - 775 , 775 - 800 , 800 - 825 , 825 - 850 , 850 - 875 , 875 - 900 , 900 - 925 , 925 - 950 , 950 - 975 , 975 - 1000 , 1000 - 1025 , 1025 - 1050 , 1050 - 1075 , 1075 - 1100 | ||
| Click To Change The Sort Order: By Market Cap or Company Size Performance: Year-to-date, Week and Day | |
| Select Chart Type: | ||
|
Best Stocks Today 12Stocks.com |
© 2025 12Stocks.com Terms & Conditions Privacy Contact Us
All Information Provided Only For Education And Not To Be Used For Investing or Trading. See Terms & Conditions


One More Thing ... Get Best Stocks Delivered Daily!
Never Ever Miss A Move With Our Top Ten Stocks Lists
Find Best Stocks In Any Market - Bull or Bear Market
Take A Peek At Our Top Ten Stocks Lists: Daily, Weekly, Year-to-Date & Top Trends
Find Best Stocks In Any Market - Bull or Bear Market
Take A Peek At Our Top Ten Stocks Lists: Daily, Weekly, Year-to-Date & Top Trends
Financial Stocks With Best Up Trends [0-bearish to 100-bullish]: Compass [100], Western Union[100], Whitestone REIT[100], Healthcare Realty[100], Public Storage[100], Alexandria Real[100], Omega Healthcare[100], LendingTree [100], Federal Realty[100], OFS Capital[100], BXP [100]
Best Financial Stocks Year-to-Date:
ESSA Bancorp[2923.51%], Robinhood Markets[185.29%], Solowin [161.21%], Metalpha Technology[143.48%], IHS Holding[139.04%], Altisource Portfolio[127.41%], Banco Santander[113.19%], Banco Bilbao[102.83%], IREN [99.49%], Grupo Cibest[93.5%], Mr. Cooper[91.06%] Best Financial Stocks This Week:
Plymouth Industrial[40.4%], SelectQuote [30.15%], Altisource Portfolio[24.32%], Seritage Growth[20.21%], MBIA [18.44%], Nu [13.82%], Qudian [11.08%], Cipher Mining[10.9%], Brookfield Business[10.18%], BXP [9.64%], Stratus Properties[8.94%] Best Financial Stocks Daily:
SelectQuote [41.53%], X [15.73%], Altisource Portfolio[9.12%], Aegon [7.64%], UP Fintech[6.65%], FinVolution [5.55%], Hippo [5.47%], Lufax Holding[5.45%], eHealth [4.65%], MarketAxess [4.54%], Yiren Digital[3.6%]