
 Login Sign Up


| |||||
 |  | ||||

| 12Stocks.com Market Intelligence |
Best Emerging Markets Stocks
| In a hurry? Emerging Markets Stocks Lists: Trends Table, Stock Charts
Sort Emerging Markets stocks: Daily, Weekly, Year-to-Date, Market Cap & Trends. Filter Emerging Markets stocks list by sector: Show all, Tech, Finance, Energy, Staples, Retail, Industrial, Materials, Utilities and HealthCare Filter Emerging Markets stocks list by size:All Large Medium Small |
| 12Stocks.com Emerging Markets Stocks Performances & Trends Daily | |||||||||
|
|  The overall Smart Investing & Trading Score is 100 (0-bearish to 100-bullish) which puts Emerging Markets index in short term bullish trend. The Smart Investing & Trading Score from previous trading session is 100 and an improvement of trend continues.
| ||||||||
Here are the Smart Investing & Trading Scores of the most requested Emerging Markets stocks at 12Stocks.com (click stock name for detailed review):
|


| 12Stocks.com: Top Performing Emerging Markets Index Stocks | |||||||||||||||||||||||||||||||||||||||||||||||
 The top performing Emerging Markets Index stocks year to date are
Now, more recently, over last week, the top performing Emerging Markets Index stocks on the move are


|
|||||||||||||||||||||||||||||||||||||||||||||||
| 12Stocks.com: Investing in Emerging Markets Index with Stocks | |
|
The following table helps investors and traders sort through current performance and trends (as measured by Smart Investing & Trading Score ) of various
stocks in the Emerging Markets Index. Quick View: Move mouse or cursor over stock symbol (ticker) to view short-term technical chart and over stock name to view long term chart. Click on  to add stock symbol to your watchlist and to add stock symbol to your watchlist and  to view watchlist. Click on any ticker or stock name for detailed market intelligence report for that stock. to view watchlist. Click on any ticker or stock name for detailed market intelligence report for that stock. |
12Stocks.com Performance of Stocks in Emerging Markets Index
| Ticker | Stock Name | Watchlist | Category | Recent Price | Smart Investing & Trading Score | Change % | YTD Change% |
| CANG | Cango |   | Financials | 4.58 | 20 | 0.00% | -8.76% |
| GHG | GreenTree Hospitality | | Services & Goods | 2.24 | 90 | 7.30% | -11.36% |
| EDU | New Oriental | | Consumer Staples | 53.74 | 60 | -1.58% | -12.70% |
| API | Agora | | Technology | 3.78 | 70 | -2.33% | -13.50% |
| MMYT | MakeMyTrip | | Services & Goods | 97.81 | 20 | -2.87% | -15.85% |
| AMBI | Ambipar Emergency | | Industrials | 4.50 | 0 | -4.41% | -15.89% |
| CINT | CI&T | | Technology | 5.17 | 36 | -0.59% | -16.64% |
| BAK | Braskem S.A. | | Materials | 3.33 | 50 | -0.89% | -16.75% |
| VLRS | Controladora Vuela | | Industrials | 6.04 | 50 | -3.21% | -18.38% |
| WIT | Wipro . | | Technology | 2.77 | 20 | -0.72% | -20.34% |
| MSC | Studio City | | Services & Goods | 4.41 | 60 | -6.96% | -20.54% |
| INFY | Infosys | | Technology | 16.96 | 30 | -0.64% | -23.96% |
| QFIN | Qfin | | Financials | 28.36 | 40 | -1.46% | -25.32% |
| UXIN | Uxin | | Services & Goods | 3.50 | 50 | -3.05% | -25.37% |
| DOYU | DouYu | | Technology | 8.03 | 60 | 0.12% | -28.11% |
| PERF | Perfect Corp | | Technology | 2.08 | 80 | 8.33% | -28.77% |
| NCTY | The9 | | Financials | 10.31 | 90 | 1.48% | -31.08% |
| DDL | Dingdong (Cayman) | | Consumer Staples | 2.20 | 60 | -3.08% | -32.10% |
| GGR | Gogoro | | Services & Goods | 0.33 | 20 | -4.45% | -34.69% |
| VIST | Vista Energy | | Energy | 35.71 | 10 | -4.16% | -36.12% |
| CHA | Chagee | | Services & Goods | 16.64 | 10 | -3.03% | -40.57% |
| HDB | HDFC Bank | | Financials | 35.07 | 20 | -0.90% | -44.65% |
| SXTC | China SXT | | Health Care | 1.98 | 90 | 15.12% | -49.25% |
| LVRO | Lavoro | | Materials | 1.30 | 71 | -1.76% | -65.14% |
| SDA | SunCar | | Services & Goods | 2.70 | 70 | -1.46% | -70.03% |
| For chart view version of above stock list: Chart View ➞ 0 - 25 , 25 - 50 , 50 - 75 , 75 - 100 , 100 - 125 , 125 - 150 , 150 - 175 , 175 - 200 , 200 - 225 , 225 - 250 , 250 - 275 | ||
 | Click To Change The Sort Order: By Market Cap or Company Size Performance: Year-to-date, Week and Day |  |
|
Get the most comprehensive stock market coverage daily at 12Stocks.com ➞ Best Stocks Today ➞ Best Stocks Weekly ➞ Best Stocks Year-to-Date ➞ Best Stocks Trends ➞  Best Stocks Today 12Stocks.com Best Nasdaq Stocks ➞ Best S&P 500 Stocks ➞ Best Tech Stocks ➞ Best Biotech Stocks ➞ |
| Detailed Overview of Emerging Markets Stocks |
| Emerging Markets Technical Overview, Leaders & Laggards, Top Emerging Markets ETF Funds & Detailed Emerging Markets Stocks List, Charts, Trends & More |
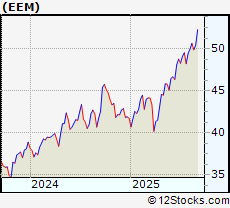
| Emerging Markets: Technical Analysis, Trends & YTD Performance | |
 EEM Weekly Chart |
|
| Long Term Trend: Very Good | |
| Medium Term Trend: Good | |
 EEM Daily Chart |
|
| Short Term Trend: Very Good | |
| Overall Trend Score: 100 | |
| YTD Performance: 26.3561% | |
| **Trend Scores & Views Are Only For Educational Purposes And Not For Investing | |
| 12Stocks.com: Investing in Emerging Markets Index using Exchange Traded Funds | |
|
The following table shows list of key exchange traded funds (ETF) that
help investors play Emerging Markets stock market. For detailed view, check out our ETF Funds section of our website. Quick View: Move mouse or cursor over ETF symbol (ticker) to view short-term technical chart and over ETF name to view long term chart. Click on ticker or stock name for detailed view. Click on to add stock symbol to your watchlist and to view watchlist. |
12Stocks.com List of ETFs that track Emerging Markets Index
| Ticker | ETF Name | Watchlist | Recent Price | Smart Investing & Trading Score | Change % | Week % | Year-to-date % |
| EWEM | Em Mkts Eql | | 95.84 | 70 | -0.457 | 5.08772 | 0% |
| 12Stocks.com: Charts, Trends, Fundamental Data and Performances of Emerging Markets Stocks | |
|
We now take in-depth look at all Emerging Markets stocks including charts, multi-period performances and overall trends (as measured by Smart Investing & Trading Score ). One can sort Emerging Markets stocks (click link to choose) by Daily, Weekly and by Year-to-Date performances. Also, one can sort by size of the company or by market capitalization. |
| Select Your Default Chart Type: | |||||
| |||||
| Click on stock symbol or name for detailed view. Click on to add stock symbol to your watchlist and to view watchlist. Quick View: Move mouse or cursor over "Daily" to quickly view daily technical stock chart and over "Weekly" to view weekly technical stock chart. | |||||

 | CANG Cango Inc ADR |
| Sector: Financials | |
| SubSector: Capital Markets | |
| MarketCap: 868.19 Millions | |
| Recent Price: 4.58 Smart Investing & Trading Score : 20 | |
| Day Percent Change: 0% Day Change: 0.1 | |
| Week Change: -3.17125% Year-to-date Change: -8.8% | |
| CANG Links: Profile News Message Board | |
| Charts:- Daily , Weekly | |
| Add CANG to Watchlist: View: Get Complete CANG Trend Analysis ➞ | |
 | GHG GreenTree Hospitality Group Ltd ADR |
| Sector: Services & Goods | |
| SubSector: Lodging | |
| MarketCap: 134.19 Millions | |
| Recent Price: 2.24 Smart Investing & Trading Score : 90 | |
| Day Percent Change: 7.29665% Day Change: 0 | |
| Week Change: 2.86697% Year-to-date Change: -11.4% | |
| GHG Links: Profile News Message Board | |
| Charts:- Daily , Weekly | |
| Add GHG to Watchlist: View: Get Complete GHG Trend Analysis ➞ | |
 | EDU New Oriental Education & Technology Group Inc. ADR |
| Sector: Consumer Staples | |
| SubSector: Education & Training Services | |
| MarketCap: 7983.53 Millions | |
| Recent Price: 53.74 Smart Investing & Trading Score : 60 | |
| Day Percent Change: -1.57509% Day Change: 0.37 | |
| Week Change: 10.1681% Year-to-date Change: -12.7% | |
| EDU Links: Profile News Message Board | |
| Charts:- Daily , Weekly | |
| Add EDU to Watchlist: View: Get Complete EDU Trend Analysis ➞ | |
 | API Agora Inc ADR |
| Sector: Technology | |
| SubSector: Software - Application | |
| MarketCap: 254.69 Millions | |
| Recent Price: 3.78 Smart Investing & Trading Score : 70 | |
| Day Percent Change: -2.32558% Day Change: 0.07 | |
| Week Change: 14.5455% Year-to-date Change: -13.5% | |
| API Links: Profile News Message Board | |
| Charts:- Daily , Weekly | |
| Add API to Watchlist: View: Get Complete API Trend Analysis ➞ | |
 | MMYT MakeMyTrip Ltd |
| Sector: Services & Goods | |
| SubSector: Travel Services | |
| MarketCap: 9557.55 Millions | |
| Recent Price: 97.81 Smart Investing & Trading Score : 20 | |
| Day Percent Change: -2.86991% Day Change: -1.42 | |
| Week Change: -2.27795% Year-to-date Change: -15.8% | |
| MMYT Links: Profile News Message Board | |
| Charts:- Daily , Weekly | |
| Add MMYT to Watchlist: View: Get Complete MMYT Trend Analysis ➞ | |
 | AMBI Ambipar Emergency Response |
| Sector: Industrials | |
| SubSector: Waste Management | |
| MarketCap: 251.65 Millions | |
| Recent Price: 4.50 Smart Investing & Trading Score : 0 | |
| Day Percent Change: -4.40989% Day Change: -0.07 | |
| Week Change: -1.0989% Year-to-date Change: -15.9% | |
| AMBI Links: Profile News Message Board | |
| Charts:- Daily , Weekly | |
| Add AMBI to Watchlist: View: Get Complete AMBI Trend Analysis ➞ | |
 | CINT CI&T Inc |
| Sector: Technology | |
| SubSector: Software - Infrastructure | |
| MarketCap: 693.03 Millions | |
| Recent Price: 5.17 Smart Investing & Trading Score : 36 | |
| Day Percent Change: -0.59% Day Change: -0.03 | |
| Week Change: -6.12% Year-to-date Change: -16.6% | |
| CINT Links: Profile News Message Board | |
| Charts:- Daily , Weekly | |
| Add CINT to Watchlist: View: Get Complete CINT Trend Analysis ➞ | |
 | BAK Braskem S.A. ADR |
| Sector: Materials | |
| SubSector: Chemicals | |
| MarketCap: 609.03 Millions | |
| Recent Price: 3.33 Smart Investing & Trading Score : 50 | |
| Day Percent Change: -0.892857% Day Change: 0.13 | |
| Week Change: -2.34604% Year-to-date Change: -16.8% | |
| BAK Links: Profile News Message Board | |
| Charts:- Daily , Weekly | |
| Add BAK to Watchlist: View: Get Complete BAK Trend Analysis ➞ | |
 | VLRS Controladora Vuela Cia De Aviacion ADR |
| Sector: Industrials | |
| SubSector: Airlines | |
| MarketCap: 706.64 Millions | |
| Recent Price: 6.04 Smart Investing & Trading Score : 50 | |
| Day Percent Change: -3.20513% Day Change: -0.09 | |
| Week Change: -1.14566% Year-to-date Change: -18.4% | |
| VLRS Links: Profile News Message Board | |
| Charts:- Daily , Weekly | |
| Add VLRS to Watchlist: View: Get Complete VLRS Trend Analysis ➞ | |
 | WIT Wipro Ltd. ADR |
| Sector: Technology | |
| SubSector: Information Technology Services | |
| MarketCap: 28586.7 Millions | |
| Recent Price: 2.77 Smart Investing & Trading Score : 20 | |
| Day Percent Change: -0.716846% Day Change: 0.01 | |
| Week Change: 1.4652% Year-to-date Change: -20.3% | |
| WIT Links: Profile News Message Board | |
| Charts:- Daily , Weekly | |
| Add WIT to Watchlist: View: Get Complete WIT Trend Analysis ➞ | |
 | MSC Studio City International Holdings Ltd ADR |
| Sector: Services & Goods | |
| SubSector: Resorts & Casinos | |
| MarketCap: 741.47 Millions | |
| Recent Price: 4.41 Smart Investing & Trading Score : 60 | |
| Day Percent Change: -6.96203% Day Change: -0.24 | |
| Week Change: 6.77966% Year-to-date Change: -20.5% | |
| MSC Links: Profile News Message Board | |
| Charts:- Daily , Weekly | |
| Add MSC to Watchlist: View: Get Complete MSC Trend Analysis ➞ | |
 | INFY Infosys Ltd ADR |
| Sector: Technology | |
| SubSector: Information Technology Services | |
| MarketCap: 68048.6 Millions | |
| Recent Price: 16.96 Smart Investing & Trading Score : 30 | |
| Day Percent Change: -0.644405% Day Change: -0.07 | |
| Week Change: 2.23026% Year-to-date Change: -24.0% | |
| INFY Links: Profile News Message Board | |
| Charts:- Daily , Weekly | |
| Add INFY to Watchlist: View: Get Complete INFY Trend Analysis ➞ | |
 | QFIN Qfin Holdings Inc. ADR |
| Sector: Financials | |
| SubSector: Credit Services | |
| MarketCap: 3718.52 Millions | |
| Recent Price: 28.36 Smart Investing & Trading Score : 40 | |
| Day Percent Change: -1.45935% Day Change: 0.99 | |
| Week Change: -1.86851% Year-to-date Change: -25.3% | |
| QFIN Links: Profile News Message Board | |
| Charts:- Daily , Weekly | |
| Add QFIN to Watchlist: View: Get Complete QFIN Trend Analysis ➞ | |
 | UXIN Uxin Ltd ADR |
| Sector: Services & Goods | |
| SubSector: Auto & Truck Dealerships | |
| MarketCap: 721.11 Millions | |
| Recent Price: 3.50 Smart Investing & Trading Score : 50 | |
| Day Percent Change: -3.04709% Day Change: 0.1 | |
| Week Change: -1.12994% Year-to-date Change: -25.4% | |
| UXIN Links: Profile News Message Board | |
| Charts:- Daily , Weekly | |
| Add UXIN to Watchlist: View: Get Complete UXIN Trend Analysis ➞ | |
 | DOYU DouYu International Holdings Ltd ADR |
| Sector: Technology | |
| SubSector: Internet Content & Information | |
| MarketCap: 233.9 Millions | |
| Recent Price: 8.03 Smart Investing & Trading Score : 60 | |
| Day Percent Change: 0.124688% Day Change: -0.13 | |
| Week Change: -3.01932% Year-to-date Change: -28.1% | |
| DOYU Links: Profile News Message Board | |
| Charts:- Daily , Weekly | |
| Add DOYU to Watchlist: View: Get Complete DOYU Trend Analysis ➞ | |
 | PERF Perfect Corp |
| Sector: Technology | |
| SubSector: Software - Application | |
| MarketCap: 195.55 Millions | |
| Recent Price: 2.08 Smart Investing & Trading Score : 80 | |
| Day Percent Change: 8.33333% Day Change: -0.02 | |
| Week Change: 7.2165% Year-to-date Change: -28.8% | |
| PERF Links: Profile News Message Board | |
| Charts:- Daily , Weekly | |
| Add PERF to Watchlist: View: Get Complete PERF Trend Analysis ➞ | |
 | NCTY The9 Limited ADR |
| Sector: Financials | |
| SubSector: Capital Markets | |
| MarketCap: 118.27 Millions | |
| Recent Price: 10.31 Smart Investing & Trading Score : 90 | |
| Day Percent Change: 1.47638% Day Change: 0.17 | |
| Week Change: 10.6223% Year-to-date Change: -31.1% | |
| NCTY Links: Profile News Message Board | |
| Charts:- Daily , Weekly | |
| Add NCTY to Watchlist: View: Get Complete NCTY Trend Analysis ➞ | |
 | DDL Dingdong (Cayman) Ltd ADR |
| Sector: Consumer Staples | |
| SubSector: Grocery Stores | |
| MarketCap: 391.49 Millions | |
| Recent Price: 2.20 Smart Investing & Trading Score : 60 | |
| Day Percent Change: -3.0837% Day Change: -0.11 | |
| Week Change: 7.84314% Year-to-date Change: -32.1% | |
| DDL Links: Profile News Message Board | |
| Charts:- Daily , Weekly | |
| Add DDL to Watchlist: View: Get Complete DDL Trend Analysis ➞ | |
 | GGR Gogoro Inc |
| Sector: Services & Goods | |
| SubSector: Auto Manufacturers | |
| MarketCap: 103.1 Millions | |
| Recent Price: 0.33 Smart Investing & Trading Score : 20 | |
| Day Percent Change: -4.45274% Day Change: 0 | |
| Week Change: 0.0601685% Year-to-date Change: -34.7% | |
| GGR Links: Profile News Message Board | |
| Charts:- Daily , Weekly | |
| Add GGR to Watchlist: View: Get Complete GGR Trend Analysis ➞ | |
 | VIST Vista Energy S.A.B. de C.V ADR |
| Sector: Energy | |
| SubSector: Oil & Gas E&P | |
| MarketCap: 3625.22 Millions | |
| Recent Price: 35.71 Smart Investing & Trading Score : 10 | |
| Day Percent Change: -4.15996% Day Change: 0.26 | |
| Week Change: -8.27126% Year-to-date Change: -36.1% | |
| VIST Links: Profile News Message Board | |
| Charts:- Daily , Weekly | |
| Add VIST to Watchlist: View: Get Complete VIST Trend Analysis ➞ | |
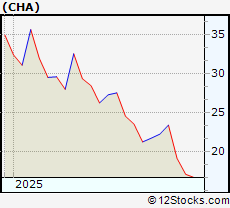 | CHA Chagee Holdings Ltd. ADR |
| Sector: Services & Goods | |
| SubSector: Restaurants | |
| MarketCap: 2019.04 Millions | |
| Recent Price: 16.64 Smart Investing & Trading Score : 10 | |
| Day Percent Change: -3.0303% Day Change: 0.24 | |
| Week Change: -6.72646% Year-to-date Change: -40.6% | |
| CHA Links: Profile News Message Board | |
| Charts:- Daily , Weekly | |
| Add CHA to Watchlist: View: Get Complete CHA Trend Analysis ➞ | |
 | HDB HDFC Bank Ltd. ADR |
| Sector: Financials | |
| SubSector: Banks - Regional | |
| MarketCap: 361333 Millions | |
| Recent Price: 35.07 Smart Investing & Trading Score : 20 | |
| Day Percent Change: -0.90421% Day Change: 0.43 | |
| Week Change: -50.3539% Year-to-date Change: -44.6% | |
| HDB Links: Profile News Message Board | |
| Charts:- Daily , Weekly | |
| Add HDB to Watchlist: View: Get Complete HDB Trend Analysis ➞ | |
 | SXTC China SXT Pharmaceuticals Inc |
| Sector: Health Care | |
| SubSector: Drug Manufacturers - Specialty & Generic | |
| MarketCap: 186.8 Millions | |
| Recent Price: 1.98 Smart Investing & Trading Score : 90 | |
| Day Percent Change: 15.1163% Day Change: -0.03 | |
| Week Change: 43.4783% Year-to-date Change: -49.3% | |
| SXTC Links: Profile News Message Board | |
| Charts:- Daily , Weekly | |
| Add SXTC to Watchlist: View: Get Complete SXTC Trend Analysis ➞ | |
 | LVRO Lavoro Ltd |
| Sector: Materials | |
| SubSector: Agricultural Inputs | |
| MarketCap: 155.59 Millions | |
| Recent Price: 1.30 Smart Investing & Trading Score : 71 | |
| Day Percent Change: -1.76% Day Change: -0.03 | |
| Week Change: -18.54% Year-to-date Change: -65.1% | |
| LVRO Links: Profile News Message Board | |
| Charts:- Daily , Weekly | |
| Add LVRO to Watchlist: View: Get Complete LVRO Trend Analysis ➞ | |
 | SDA SunCar Technology Group Inc |
| Sector: Services & Goods | |
| SubSector: Auto & Truck Dealerships | |
| MarketCap: 270.98 Millions | |
| Recent Price: 2.70 Smart Investing & Trading Score : 70 | |
| Day Percent Change: -1.45985% Day Change: -0.02 | |
| Week Change: -3.91459% Year-to-date Change: -70.0% | |
| SDA Links: Profile News Message Board | |
| Charts:- Daily , Weekly | |
| Add SDA to Watchlist: View: Get Complete SDA Trend Analysis ➞ | |
| For tabular summary view of above stock list: Summary View ➞ 0 - 25 , 25 - 50 , 50 - 75 , 75 - 100 , 100 - 125 , 125 - 150 , 150 - 175 , 175 - 200 , 200 - 225 , 225 - 250 , 250 - 275 | ||
| Click To Change The Sort Order: By Market Cap or Company Size Performance: Year-to-date, Week and Day | |
| Select Chart Type: | ||
|
Best Stocks Today 12Stocks.com |
© 2025 12Stocks.com Terms & Conditions Privacy Contact Us
All Information Provided Only For Education And Not To Be Used For Investing or Trading. See Terms & Conditions


One More Thing ... Get Best Stocks Delivered Daily!
Never Ever Miss A Move With Our Top Ten Stocks Lists
Find Best Stocks In Any Market - Bull or Bear Market
Take A Peek At Our Top Ten Stocks Lists: Daily, Weekly, Year-to-Date & Top Trends
Find Best Stocks In Any Market - Bull or Bear Market
Take A Peek At Our Top Ten Stocks Lists: Daily, Weekly, Year-to-Date & Top Trends
Emerging Markets Stocks With Best Up Trends [0-bearish to 100-bullish]: Net 1[100], Baozun [100], VNET [100], Baidu [100], Grupo Aeroportuario[100], BRF S.A.[100], NetEase [100], China [100], Industrias Bachoco[100], Ctrip.com [100], SINA [100]
Best Emerging Markets Stocks Year-to-Date:
Regencell Bioscience[11493.1%], So-Young [375.53%], Sify [281.373%], QuantaSing [269.91%], Xunlei [259.524%], Oneconnect Financial[196.708%], Gold Fields[172.347%], Yatsen Holding[165.104%], DRDGold .[151.458%], Sibanye Stillwater[151.297%], Niu [132.759%] Best Emerging Markets Stocks This Week:
CNOOC [137266%], Companhia Brasileira[18587.4%], Cosan [16415.2%], Nam Tai[5033.33%], Fang [4150%], Sinopec Shanghai[1992.58%], Grupo Financiero[1283.52%], PetroChina [1137.09%], China [1104.2%], China Life[690.958%], Leju [539.091%] Best Emerging Markets Stocks Daily:
China SXT[15.1163%], Grupo Simec[12.2572%], HUTCHMED (China)[9.52963%], Net 1[9.46197%], Regencell Bioscience[9.29368%], Perfect Corp[8.33333%], Jianpu [7.78054%], Baozun [6.95067%], JinkoSolar Holding[6.31356%], Sibanye Gold[5.06135%], VNET [5.0494%]