
 Login Sign Up


| |||||
 |  | ||||

| 12Stocks.com Market Intelligence |
Best Emerging Markets Stocks
| In a hurry? Emerging Markets Stocks Lists: Trends Table, Stock Charts
Sort Emerging Markets stocks: Daily, Weekly, Year-to-Date, Market Cap & Trends. Filter Emerging Markets stocks list by sector: Show all, Tech, Finance, Energy, Staples, Retail, Industrial, Materials, Utilities and HealthCare Filter Emerging Markets stocks list by size:All Large Medium Small |
| 12Stocks.com Emerging Markets Stocks Performances & Trends Daily | |||||||||
|
|  The overall Smart Investing & Trading Score is 48 (0-bearish to 100-bullish) which puts Emerging Markets index in short term neutral trend. The Smart Investing & Trading Score from previous trading session is 38 and hence an improvement of trend.
| ||||||||
Here are the Smart Investing & Trading Scores of the most requested Emerging Markets stocks at 12Stocks.com (click stock name for detailed review):
|


| 12Stocks.com: Top Performing Emerging Markets Index Stocks | ||||||||||||||||||||||||||||||||||||||||||||||||
 The top performing Emerging Markets Index stocks year to date are
Now, more recently, over last week, the top performing Emerging Markets Index stocks on the move are


|
||||||||||||||||||||||||||||||||||||||||||||||||
| 12Stocks.com: Investing in Emerging Markets Index with Stocks | |
|
The following table helps investors and traders sort through current performance and trends (as measured by Smart Investing & Trading Score ) of various
stocks in the Emerging Markets Index. Quick View: Move mouse or cursor over stock symbol (ticker) to view short-term technical chart and over stock name to view long term chart. Click on  to add stock symbol to your watchlist and to add stock symbol to your watchlist and  to view watchlist. Click on any ticker or stock name for detailed market intelligence report for that stock. to view watchlist. Click on any ticker or stock name for detailed market intelligence report for that stock. |
12Stocks.com Performance of Stocks in Emerging Markets Index
| Ticker | Stock Name | Watchlist | Category | Recent Price | Smart Investing & Trading Score | Change % | YTD Change% |
| MLCO | Melco Resorts |   | Services & Goods | 6.20 | 0 | -0.56% | -30.16% |
| CSAN | Cosan S.A | | Energy | 11.00 | 17 | 0.87% | -30.18% |
| TUYA | Tuya | | Technology | 1.60 | 17 | -2.44% | -30.28% |
| SID | Companhia Siderurgica | | Materials | 2.73 | 10 | 0.18% | -30.66% |
| GDS | GDS | | Technology | 6.29 | 88 | -1.79% | -30.98% |
| LVRO | Lavoro | | Materials | 6.03 | 17 | 3.24% | -32.04% |
| KRKR | 36Kr | | Technology | 0.38 | 50 | 0.13% | -32.54% |
| ICG | Intchains | | Technology | 8.17 | 17 | 0.86% | -33.58% |
| THCH | TH | | Services & Goods | 1.15 | 74 | -11.54% | -33.91% |
| AIXI | Xiao-I | | Technology | 1.49 | 10 | -0.34% | -34.00% |
| SIFY | Sify | | Technology | 1.23 | 10 | 0.00% | -34.05% |
| YI | 111 | | Services & Goods | 1.00 | 17 | 0.00% | -35.48% |
| TOP | TOP Financial | | Financials | 2.39 | 10 | 3.02% | -35.75% |
| AMBI | Ambipar Emergency | | Industrials | 5.00 | 42 | 8.70% | -36.39% |
| DUO | Fangdd Network | | Financials | 0.42 | 32 | 4.75% | -37.74% |
| BQ | Boqii Holding | | Services & Goods | 0.28 | 47 | 6.63% | -38.19% |
| AGMH | AGM | | Technology | 1.11 | 0 | 0.00% | -38.67% |
| SFWL | Shengfeng Development | | Industrials | 1.66 | 10 | 4.40% | -39.64% |
| AZUL | Azul S.A | | Transports | 5.77 | 10 | -0.52% | -40.45% |
| AIH | Aesthetic Medical | | Health Care | 0.41 | 15 | 6.77% | -40.55% |
| JKS | JinkoSolar Holding | | Technology | 21.61 | 10 | -0.23% | -41.50% |
| OCFT | OneConnect Financial | | Technology | 1.82 | 10 | -1.62% | -42.22% |
| DADA | Dada Nexus | | Services & Goods | 1.87 | 15 | 1.36% | -43.67% |
| IH | iHuman | | Consumer Staples | 1.72 | 18 | 0.00% | -43.77% |
| GGR | Gogoro | | Services & Goods | 1.45 | 17 | -1.69% | -44.23% |
| For chart view version of above stock list: Chart View ➞ 0 - 25 , 25 - 50 , 50 - 75 , 75 - 100 , 100 - 125 , 125 - 150 , 150 - 175 , 175 - 200 | ||
 | Click To Change The Sort Order: By Market Cap or Company Size Performance: Year-to-date, Week and Day |  |
|
Get the most comprehensive stock market coverage daily at 12Stocks.com ➞ Best Stocks Today ➞ Best Stocks Weekly ➞ Best Stocks Year-to-Date ➞ Best Stocks Trends ➞  Best Stocks Today 12Stocks.com Best Nasdaq Stocks ➞ Best S&P 500 Stocks ➞ Best Tech Stocks ➞ Best Biotech Stocks ➞ |
| Detailed Overview of Emerging Markets Stocks |
| Emerging Markets Technical Overview, Leaders & Laggards, Top Emerging Markets ETF Funds & Detailed Emerging Markets Stocks List, Charts, Trends & More |
| Emerging Markets: Technical Analysis, Trends & YTD Performance | |
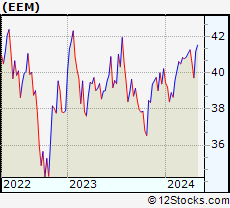
 EEM Weekly Chart |
|
| Long Term Trend: Very Good | |
| Medium Term Trend: Not Good | |
 EEM Daily Chart |
|
| Short Term Trend: Not Good | |
| Overall Trend Score: 48 | |
| YTD Performance: -1.17% | |
| **Trend Scores & Views Are Only For Educational Purposes And Not For Investing | |
| 12Stocks.com: Investing in Emerging Markets Index using Exchange Traded Funds | |
|
The following table shows list of key exchange traded funds (ETF) that
help investors play Emerging Markets stock market. For detailed view, check out our ETF Funds section of our website. Quick View: Move mouse or cursor over ETF symbol (ticker) to view short-term technical chart and over ETF name to view long term chart. Click on ticker or stock name for detailed view. Click on to add stock symbol to your watchlist and to view watchlist. |
12Stocks.com List of ETFs that track Emerging Markets Index
| Ticker | ETF Name | Watchlist | Recent Price | Smart Investing & Trading Score | Change % | Week % | Year-to-date % |
| EEM | Emerging Markets | | 39.74 | 48 | -0.33 | -1.95 | -1.17% |
| VWO | Emerging Markets | | 40.88 | 53 | -0.32 | -1.73 | -0.54% |
| EET | Emerging Markets | | 47.72 | 41 | -0.65 | -4.17 | -6.17% |
| EDC | Emrg Mkts Bull | | 27.20 | 48 | -0.95 | -5.82 | -10.61% |
| EUM | Short Emerging | | 14.48 | 62 | 0.42 | 2.08 | 2.33% |
| 12Stocks.com: Charts, Trends, Fundamental Data and Performances of Emerging Markets Stocks | |
|
We now take in-depth look at all Emerging Markets stocks including charts, multi-period performances and overall trends (as measured by Smart Investing & Trading Score ). One can sort Emerging Markets stocks (click link to choose) by Daily, Weekly and by Year-to-Date performances. Also, one can sort by size of the company or by market capitalization. |
| Select Your Default Chart Type: | |||||
| |||||
| Click on stock symbol or name for detailed view. Click on to add stock symbol to your watchlist and to view watchlist. Quick View: Move mouse or cursor over "Daily" to quickly view daily technical stock chart and over "Weekly" to view weekly technical stock chart. | |||||

 | MLCO Melco Resorts & Entertainment Limited |
| Sector: Services & Goods | |
| SubSector: Resorts & Casinos | |
| MarketCap: 7031.14 Millions | |
| Recent Price: 6.20 Smart Investing & Trading Score : 0 | |
| Day Percent Change: -0.56% Day Change: -0.04 | |
| Week Change: -10.86% Year-to-date Change: -30.2% | |
| MLCO Links: Profile News Message Board | |
| Charts:- Daily , Weekly | |
| Add MLCO to Watchlist: View: Get Complete MLCO Trend Analysis ➞ | |
 | CSAN Cosan S.A. |
| Sector: Energy | |
| SubSector: Oil & Gas Refining & Marketing | |
| MarketCap: 6890 Millions | |
| Recent Price: 11.00 Smart Investing & Trading Score : 17 | |
| Day Percent Change: 0.87% Day Change: 0.10 | |
| Week Change: -5.58% Year-to-date Change: -30.2% | |
| CSAN Links: Profile News Message Board | |
| Charts:- Daily , Weekly | |
| Add CSAN to Watchlist: View: Get Complete CSAN Trend Analysis ➞ | |
 | TUYA Tuya Inc. |
| Sector: Technology | |
| SubSector: Software - Infrastructure | |
| MarketCap: 1050 Millions | |
| Recent Price: 1.60 Smart Investing & Trading Score : 17 | |
| Day Percent Change: -2.44% Day Change: -0.04 | |
| Week Change: -6.43% Year-to-date Change: -30.3% | |
| TUYA Links: Profile News Message Board | |
| Charts:- Daily , Weekly | |
| Add TUYA to Watchlist: View: Get Complete TUYA Trend Analysis ➞ | |
 | SID Companhia Siderurgica Nacional |
| Sector: Materials | |
| SubSector: Steel & Iron | |
| MarketCap: 2087.58 Millions | |
| Recent Price: 2.73 Smart Investing & Trading Score : 10 | |
| Day Percent Change: 0.18% Day Change: 0.00 | |
| Week Change: -3.02% Year-to-date Change: -30.7% | |
| SID Links: Profile News Message Board | |
| Charts:- Daily , Weekly | |
| Add SID to Watchlist: View: Get Complete SID Trend Analysis ➞ | |
 | GDS GDS Holdings Limited |
| Sector: Technology | |
| SubSector: Data Storage Devices | |
| MarketCap: 8597.99 Millions | |
| Recent Price: 6.29 Smart Investing & Trading Score : 88 | |
| Day Percent Change: -1.79% Day Change: -0.12 | |
| Week Change: -6.6% Year-to-date Change: -31.0% | |
| GDS Links: Profile News Message Board | |
| Charts:- Daily , Weekly | |
| Add GDS to Watchlist: View: Get Complete GDS Trend Analysis ➞ | |
 | LVRO Lavoro Limited |
| Sector: Materials | |
| SubSector: Agricultural Inputs | |
| MarketCap: 686 Millions | |
| Recent Price: 6.03 Smart Investing & Trading Score : 17 | |
| Day Percent Change: 3.24% Day Change: 0.19 | |
| Week Change: -0.91% Year-to-date Change: -32.0% | |
| LVRO Links: Profile News Message Board | |
| Charts:- Daily , Weekly | |
| Add LVRO to Watchlist: View: Get Complete LVRO Trend Analysis ➞ | |
 | KRKR 36Kr Holdings Inc. |
| Sector: Technology | |
| SubSector: Internet Information Providers | |
| MarketCap: 173.18 Millions | |
| Recent Price: 0.38 Smart Investing & Trading Score : 50 | |
| Day Percent Change: 0.13% Day Change: 0.00 | |
| Week Change: 1.94% Year-to-date Change: -32.5% | |
| KRKR Links: Profile News Message Board | |
| Charts:- Daily , Weekly | |
| Add KRKR to Watchlist: View: Get Complete KRKR Trend Analysis ➞ | |
 | ICG Intchains Group Limited |
| Sector: Technology | |
| SubSector: Semiconductors | |
| MarketCap: 450 Millions | |
| Recent Price: 8.17 Smart Investing & Trading Score : 17 | |
| Day Percent Change: 0.86% Day Change: 0.07 | |
| Week Change: -0.97% Year-to-date Change: -33.6% | |
| ICG Links: Profile News Message Board | |
| Charts:- Daily , Weekly | |
| Add ICG to Watchlist: View: Get Complete ICG Trend Analysis ➞ | |
 | THCH TH International Limited |
| Sector: Services & Goods | |
| SubSector: Restaurants | |
| MarketCap: 452 Millions | |
| Recent Price: 1.15 Smart Investing & Trading Score : 74 | |
| Day Percent Change: -11.54% Day Change: -0.15 | |
| Week Change: 4.55% Year-to-date Change: -33.9% | |
| THCH Links: Profile News Message Board | |
| Charts:- Daily , Weekly | |
| Add THCH to Watchlist: View: Get Complete THCH Trend Analysis ➞ | |
 | AIXI Xiao-I Corporation |
| Sector: Technology | |
| SubSector: Software - Application | |
| MarketCap: 431 Millions | |
| Recent Price: 1.49 Smart Investing & Trading Score : 10 | |
| Day Percent Change: -0.34% Day Change: 0.00 | |
| Week Change: -11.61% Year-to-date Change: -34.0% | |
| AIXI Links: Profile News Message Board | |
| Charts:- Daily , Weekly | |
| Add AIXI to Watchlist: View: Get Complete AIXI Trend Analysis ➞ | |
 | SIFY Sify Technologies Limited |
| Sector: Technology | |
| SubSector: Internet Service Providers | |
| MarketCap: 159.38 Millions | |
| Recent Price: 1.23 Smart Investing & Trading Score : 10 | |
| Day Percent Change: 0.00% Day Change: 0.00 | |
| Week Change: -1.6% Year-to-date Change: -34.1% | |
| SIFY Links: Profile News Message Board | |
| Charts:- Daily , Weekly | |
| Add SIFY to Watchlist: View: Get Complete SIFY Trend Analysis ➞ | |
 | YI 111, Inc. |
| Sector: Services & Goods | |
| SubSector: Drug Stores | |
| MarketCap: 520.351 Millions | |
| Recent Price: 1.00 Smart Investing & Trading Score : 17 | |
| Day Percent Change: 0.00% Day Change: 0.00 | |
| Week Change: -9.09% Year-to-date Change: -35.5% | |
| YI Links: Profile News Message Board | |
| Charts:- Daily , Weekly | |
| Add YI to Watchlist: View: Get Complete YI Trend Analysis ➞ | |
 | TOP TOP Financial Group Limited |
| Sector: Financials | |
| SubSector: Capital Markets | |
| MarketCap: 329 Millions | |
| Recent Price: 2.39 Smart Investing & Trading Score : 10 | |
| Day Percent Change: 3.02% Day Change: 0.07 | |
| Week Change: -7.36% Year-to-date Change: -35.8% | |
| TOP Links: Profile News Message Board | |
| Charts:- Daily , Weekly | |
| Add TOP to Watchlist: View: Get Complete TOP Trend Analysis ➞ | |
 | AMBI Ambipar Emergency Response |
| Sector: Industrials | |
| SubSector: Waste Management | |
| MarketCap: 462 Millions | |
| Recent Price: 5.00 Smart Investing & Trading Score : 42 | |
| Day Percent Change: 8.70% Day Change: 0.40 | |
| Week Change: -1.57% Year-to-date Change: -36.4% | |
| AMBI Links: Profile News Message Board | |
| Charts:- Daily , Weekly | |
| Add AMBI to Watchlist: View: Get Complete AMBI Trend Analysis ➞ | |
 | DUO Fangdd Network Group Ltd. |
| Sector: Financials | |
| SubSector: Property Management | |
| MarketCap: 783.142 Millions | |
| Recent Price: 0.42 Smart Investing & Trading Score : 32 | |
| Day Percent Change: 4.75% Day Change: 0.02 | |
| Week Change: 3.97% Year-to-date Change: -37.7% | |
| DUO Links: Profile News Message Board | |
| Charts:- Daily , Weekly | |
| Add DUO to Watchlist: View: Get Complete DUO Trend Analysis ➞ | |
 | BQ Boqii Holding Limited |
| Sector: Services & Goods | |
| SubSector: Specialty Retail | |
| MarketCap: 33027 Millions | |
| Recent Price: 0.28 Smart Investing & Trading Score : 47 | |
| Day Percent Change: 6.63% Day Change: 0.02 | |
| Week Change: 8.28% Year-to-date Change: -38.2% | |
| BQ Links: Profile News Message Board | |
| Charts:- Daily , Weekly | |
| Add BQ to Watchlist: View: Get Complete BQ Trend Analysis ➞ | |
 | AGMH AGM Group Holdings Inc. |
| Sector: Technology | |
| SubSector: Application Software | |
| MarketCap: 320.362 Millions | |
| Recent Price: 1.11 Smart Investing & Trading Score : 0 | |
| Day Percent Change: 0.00% Day Change: 0.00 | |
| Week Change: -30.63% Year-to-date Change: -38.7% | |
| AGMH Links: Profile News Message Board | |
| Charts:- Daily , Weekly | |
| Add AGMH to Watchlist: View: Get Complete AGMH Trend Analysis ➞ | |
 | SFWL Shengfeng Development Limited |
| Sector: Industrials | |
| SubSector: Integrated Freight & Logistics | |
| MarketCap: 747 Millions | |
| Recent Price: 1.66 Smart Investing & Trading Score : 10 | |
| Day Percent Change: 4.40% Day Change: 0.07 | |
| Week Change: -7.78% Year-to-date Change: -39.6% | |
| SFWL Links: Profile News Message Board | |
| Charts:- Daily , Weekly | |
| Add SFWL to Watchlist: View: Get Complete SFWL Trend Analysis ➞ | |
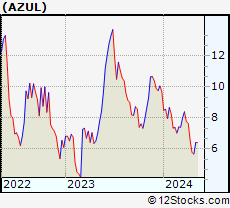 | AZUL Azul S.A. |
| Sector: Transports | |
| SubSector: Major Airlines | |
| MarketCap: 1289.85 Millions | |
| Recent Price: 5.77 Smart Investing & Trading Score : 10 | |
| Day Percent Change: -0.52% Day Change: -0.03 | |
| Week Change: -12.18% Year-to-date Change: -40.5% | |
| AZUL Links: Profile News Message Board | |
| Charts:- Daily , Weekly | |
| Add AZUL to Watchlist: View: Get Complete AZUL Trend Analysis ➞ | |
 | AIH Aesthetic Medical International Holdings Group Limited |
| Sector: Health Care | |
| SubSector: Specialized Health Services | |
| MarketCap: 205.356 Millions | |
| Recent Price: 0.41 Smart Investing & Trading Score : 15 | |
| Day Percent Change: 6.77% Day Change: 0.03 | |
| Week Change: -5.96% Year-to-date Change: -40.6% | |
| AIH Links: Profile News Message Board | |
| Charts:- Daily , Weekly | |
| Add AIH to Watchlist: View: Get Complete AIH Trend Analysis ➞ | |
 | JKS JinkoSolar Holding Co., Ltd. |
| Sector: Technology | |
| SubSector: Semiconductor - Specialized | |
| MarketCap: 629.36 Millions | |
| Recent Price: 21.61 Smart Investing & Trading Score : 10 | |
| Day Percent Change: -0.23% Day Change: -0.05 | |
| Week Change: -6.13% Year-to-date Change: -41.5% | |
| JKS Links: Profile News Message Board | |
| Charts:- Daily , Weekly | |
| Add JKS to Watchlist: View: Get Complete JKS Trend Analysis ➞ | |
 | OCFT OneConnect Financial Technology Co., Ltd. |
| Sector: Technology | |
| SubSector: Software Application | |
| MarketCap: 80387 Millions | |
| Recent Price: 1.82 Smart Investing & Trading Score : 10 | |
| Day Percent Change: -1.62% Day Change: -0.03 | |
| Week Change: -6.67% Year-to-date Change: -42.2% | |
| OCFT Links: Profile News Message Board | |
| Charts:- Daily , Weekly | |
| Add OCFT to Watchlist: View: Get Complete OCFT Trend Analysis ➞ | |
 | DADA Dada Nexus Limited |
| Sector: Services & Goods | |
| SubSector: Internet Retail | |
| MarketCap: 98527 Millions | |
| Recent Price: 1.87 Smart Investing & Trading Score : 15 | |
| Day Percent Change: 1.36% Day Change: 0.03 | |
| Week Change: -2.09% Year-to-date Change: -43.7% | |
| DADA Links: Profile News Message Board | |
| Charts:- Daily , Weekly | |
| Add DADA to Watchlist: View: Get Complete DADA Trend Analysis ➞ | |
 | IH iHuman Inc. |
| Sector: Consumer Staples | |
| SubSector: Education & Training Services | |
| MarketCap: 12247 Millions | |
| Recent Price: 1.72 Smart Investing & Trading Score : 18 | |
| Day Percent Change: 0.00% Day Change: 0.00 | |
| Week Change: -3.65% Year-to-date Change: -43.8% | |
| IH Links: Profile News Message Board | |
| Charts:- Daily , Weekly | |
| Add IH to Watchlist: View: Get Complete IH Trend Analysis ➞ | |
 | GGR Gogoro Inc. |
| Sector: Services & Goods | |
| SubSector: Auto Parts | |
| MarketCap: 856 Millions | |
| Recent Price: 1.45 Smart Investing & Trading Score : 17 | |
| Day Percent Change: -1.69% Day Change: -0.03 | |
| Week Change: -10.49% Year-to-date Change: -44.2% | |
| GGR Links: Profile News Message Board | |
| Charts:- Daily , Weekly | |
| Add GGR to Watchlist: View: Get Complete GGR Trend Analysis ➞ | |
| For tabular summary view of above stock list: Summary View ➞ 0 - 25 , 25 - 50 , 50 - 75 , 75 - 100 , 100 - 125 , 125 - 150 , 150 - 175 , 175 - 200 | ||
| Click To Change The Sort Order: By Market Cap or Company Size Performance: Year-to-date, Week and Day | |
| Select Chart Type: | ||
|
Best Stocks Today 12Stocks.com |
© 2024 12Stocks.com Terms & Conditions Privacy Contact Us
All Information Provided Only For Education And Not To Be Used For Investing or Trading. See Terms & Conditions


One More Thing ... Get Best Stocks Delivered Daily!
Never Ever Miss A Move With Our Top Ten Stocks Lists
Find Best Stocks In Any Market - Bull or Bear Market
Take A Peek At Our Top Ten Stocks Lists: Daily, Weekly, Year-to-Date & Top Trends
Find Best Stocks In Any Market - Bull or Bear Market
Take A Peek At Our Top Ten Stocks Lists: Daily, Weekly, Year-to-Date & Top Trends
Emerging Markets Stocks With Best Up Trends [0-bearish to 100-bullish]: GigaCloud [100], Zhongchao [100], HDFC Bank[93], Smart Share[93], DouYu [90], So-Young [88], JOYY [88], GDS [88], Gold Fields[85], Lufax Holding[83], Yatsen Holding[83]
Best Emerging Markets Stocks Year-to-Date:
U Power[2818.53%], DouYu [745.26%], MicroCloud Hologram[635.25%], Zhongchao [486.14%], China Liberal[476.51%], Yatsen Holding[381.82%], Uxin [136.8%], QuantaSing [115.43%], GigaCloud [95.93%], Bright Scholar[76%], Yiren Digital[54.81%] Best Emerging Markets Stocks This Week:
Regencell Bioscience[37.01%], Zhongchao [30.49%], Bright Scholar[19.57%], MingZhu Logistics[17.48%], Yatsen Holding[17.11%], Secoo Holding[15.24%], Controladora Vuela[11.35%], EHang [8.94%], Quhuo [8.87%], Smart Share[8.51%], Boqii Holding[8.28%] Best Emerging Markets Stocks Daily:
Bright Scholar[17.02%], MingZhu Logistics[10.31%], Ambipar Emergency[8.70%], Lanvin [6.99%], Aesthetic Medical[6.77%], Boqii Holding[6.63%], Fangdd Network[4.75%], Shengfeng Development[4.40%], Wipro [3.68%], Burning Rock[3.52%], Studio City[3.52%]