
 Login Sign Up


| |||||
 |  | ||||

| 12Stocks.com Market Intelligence |
Best Dow Stocks
|
On this page, you will find the most comprehensive analysis of Dow stocks and ETFs - from latest trends to performances to charts ➞. First, here are the year-to-date (YTD) performances of the most requested Dow stocks at 12Stocks.com (click stock for review):
| Intel Corp 84% | ||
| Caterpillar 38% | ||
| Goldman Sachs 37% | ||
| IBM Corp 33% | ||
| Johnson & Johnson 31% | ||
| JPMorgan Chase 30% | ||
| Boeing Co 27% | ||
| Microsoft 24% | ||
| Walmart 13% | ||
| Visa 11% | ||
| Coca-Cola Co 8% | ||
| Apple 6% | ||
| Exxon Mobil 6% | ||
| McDonald's Corp 4% | ||
| Home Depot 3% | ||
| Nike 2% | ||
| Walt Disney 2% | ||
| Procter & Gamble Co -7% | ||
| Dow Stocks Lists: Performances & Trends, Dow Stock Charts
Sort Dow stocks: Daily, Weekly, Year-to-Date, Market Cap & Trends. |
| 12Stocks.com Market Intelligence: Dow Industrials Daily Technical Insight | |||||||||
|
|  The overall Smart Investing & Trading Score is 90 (0-bearish to 100-bullish) which puts Dow index in short term bullish trend. The Smart Investing & Trading Score from previous trading session is 80 and an improvement of trend continues.
| ||||||||
Here are the Smart Investing & Trading Scores of the most requested Dow stocks at 12Stocks.com (click stock name for detailed review):
|


| 12Stocks.com: Top Performing Dow Index Stocks | ||||||||||||||||||||||||||||||||||||||||||||||||
 The top performing Dow Index stocks year to date are
Now, more recently, over last week, the top performing Dow Index stocks on the move are


|
||||||||||||||||||||||||||||||||||||||||||||||||
| 12Stocks.com: Investing in Dow Jones 30 Index with Stocks | |
|
The following table helps investors and traders sort through current performance and trends (as measured by Smart Investing & Trading Score) of various
stocks in the Dow 30 Index. Quick View: Move mouse or cursor over stock symbol (ticker) to view short-term technical chart and over stock name to view long term chart. Click on  to add stock symbol to your watchlist and to add stock symbol to your watchlist and  to view watchlist. Click on any ticker or stock name for detailed market intelligence report for that stock. to view watchlist. Click on any ticker or stock name for detailed market intelligence report for that stock. |
12Stocks.com Performance of Stocks in Dow Index
| Ticker | Stock Name | Watchlist | Category | Recent Price | Smart Investing & Trading Score | Change % | YTD Change% |
| INTC | Intel Corp |   | Technology | 37.30 | 100 | 3.78 | 84.47% |
| DOW | Dow | | Materials | 23.69 | 80 | 2.78 | -37.47% |
| CAT | Caterpillar | | Industrials | 490.57 | 100 | 2.03 | 38.04% |
| MMM | 3M Co | | Industrials | 158.80 | 90 | 1.79 | 23.64% |
| UNH | Unitedhealth | | Health Care | 353.72 | 100 | 1.56 | -29.09% |
| CRM | Salesforce | | Technology | 238.88 | 10 | 1.35 | -27.53% |
| BA | Boeing Co | | Industrials | 217.43 | 60 | 1.04 | 26.51% |
| TRV | Travelers | | Financials | 280.04 | 90 | 1.01 | 17.21% |
| AMZN | Amazon.com | | Services & Goods | 222.42 | 50 | 0.81 | 1.00% |
| AXP | American Express | | Financials | 330.48 | 30 | 0.58 | 11.65% |
| NKE | Nike | | Services & Goods | 74.57 | 90 | 0.50 | 2.41% |
| DDM | Ultra | | Financials | 107.86 | 90 | 0.40 | 14.70% |
| HON | Honeywell | | Industrials | 210.96 | 60 | 0.37 | -5.47% |
| SPY | SPDR S&P | | Financials | 669.22 | 90 | 0.12 | 15.15% |
| IBM | IBM Corp | | Technology | 286.72 | 90 | 0.08 | 33.00% |
| JNJ | Johnson & Johnson | | Health Care | 185.98 | 100 | -0.04 | 31.28% |
| MCD | McDonald's Corp | | Services & Goods | 299.88 | 10 | -0.21 | 3.70% |
| DXD | UltraShort | | Financials | 21.89 | 10 | -0.32 | -18.13% |
| AMGN | AMGEN | | Health Care | 297.40 | 100 | -0.37 | 16.65% |
| WMT | Walmart | | Consumer Staples | 101.57 | 20 | -0.38 | 13.44% |
| HD | Home Depot | | Services & Goods | 395.01 | 10 | -0.51 | 2.97% |
| V | Visa | | Financials | 345.95 | 80 | -0.54 | 10.60% |
| XOM | Exxon Mobil | | Energy | 111.29 | 20 | -0.63 | 5.60% |
| CSCO | Cisco Systems | | Technology | 68.31 | 70 | -0.64 | 17.85% |
| MRK | Merck & Co | | Health Care | 89.51 | 100 | -0.69 | -8.05% |
| DIS | Walt Disney | | Technology | 112.14 | 0 | -0.72 | 1.62% |
| PG | Procter & Gamble Co | | Consumer Staples | 152.05 | 20 | -0.74 | -6.61% |
| MSFT | Microsoft | | Technology | 515.74 | 60 | -0.76 | 23.69% |
| CVX | Chevron Corp | | Energy | 153.37 | 50 | -0.78 | 6.99% |
| GS | Goldman Sachs | | Financials | 779.38 | 20 | -0.78 | 36.90% |
| For chart view version of above stock list: Chart View ➞ 0 - 30 , 30 - 60 | ||
 | Click To Change The Sort Order: By Market Cap or Company Size Performance: Year-to-date, Week and Day |  |
|
Get the most comprehensive stock market coverage daily at 12Stocks.com ➞ Best Stocks Today ➞ Best Stocks Weekly ➞ Best Stocks Year-to-Date ➞ Best Stocks Trends ➞  Best Stocks Today 12Stocks.com Best Nasdaq Stocks ➞ Best S&P 500 Stocks ➞ Best Tech Stocks ➞ Best Biotech Stocks ➞ |
| Detailed Overview of Dow Stocks |
| Dow Technical Overview, Leaders & Laggards, Top Dow ETF Funds & Detailed Dow Stocks List, Charts, Trends & More |
| Dow: Technical Analysis, Trends & YTD Performance | |
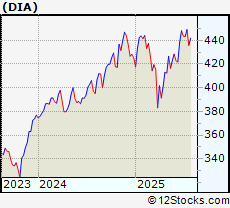
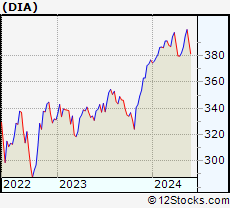
| Dow Jones Industrial index as represented by
DIA, an exchange-traded fund [ETF], holds basket of all thirty Dow stocks. The Dow 30 index (contains stocks like Microsoft and Pfizer) is up by 10.6604% and is currently underperforming the overall market by -4.0975% year-to-date. Below is a quick view of technical charts and trends: | |
 DIA Weekly Chart |
|
| Long Term Trend: Very Good | |
| Medium Term Trend: Good | |
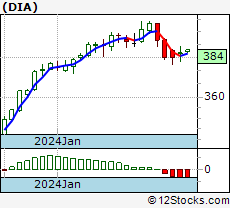
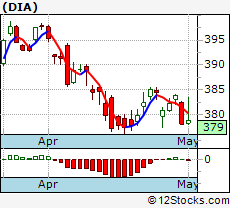 DIA Daily Chart |
|
| Short Term Trend: Very Good | |
| Overall Trend Score: 90 | |
| YTD Performance: 10.6604% | |
| **Trend Scores & Views Are Only For Educational Purposes And Not For Investing | |
| 12Stocks.com: Investing in Dow Jones 30 Index using Exchange Traded Funds | |
|
The following table shows list of key exchange traded funds (ETF) that
help investors track Dow Jones 30 industrial index. The following list also includes leveraged ETF funds that track twice or thrice the daily returns of Dow indices. Short or inverse ETF funds move in the opposite direction to the index they track and are useful during market pullbacks or during bear markets. Quick View: Move mouse or cursor over ETF symbol (ticker) to view short-term technical chart and over ETF name to view long term chart. Click on ticker or stock name for detailed view. Click on to add stock symbol to your watchlist and to view watchlist. |
12Stocks.com List of ETFs that track Dow Jones 30 Index
| Ticker | ETF Name | Watchlist | Recent Price | Smart Investing & Trading Score | Change % | Week % | Year-to-date % |
| DIA | SPDR Dow Jones Industrial Average ETF | | 465.11 | 90 | 0.183087 | 0.887163 | 10.6604% |
| SDOW | ProShares UltraPro Short Dow30 -3x Shares | | 35.47 | 10 | -0.504909 | -2.34031 | -29.3485% |
| UDOW | ProShares UltraPro Dow30 3x Shares | | 107.96 | 90 | 0.558867 | 2.42884 | 16.4587% |
| DXD | ProShares UltraShort Dow 30-2X Shares | | 21.89 | 10 | -0.318761 | -1.52946 | -18.1346% |
| DDM | ProShares Ultra Dow30 2x Shares | | 107.86 | 90 | 0.400261 | 1.64923 | 14.7034% |
| 12Stocks.com: Charts, Trends, Fundamental Data and Performances of Dow Stocks | |
|
We now take in-depth look at all Dow stocks including charts, multi-period performances and overall trends (as measured by Smart Investing & Trading Score). One can sort Dow stocks (click link to choose) by Daily, Weekly and by Year-to-Date performances. Also, one can sort by size of the company or by market capitalization. |
| Select Your Default Chart Type: | |||||
| |||||
| Click on stock symbol or name for detailed view. Click on to add stock symbol to your watchlist and to view watchlist. Quick View: Move mouse or cursor over "Daily" to quickly view daily technical stock chart and over "Weekly" to view weekly technical stock chart. | |||||
 | INTC Intel Corp |
| Sector: Technology | |
| SubSector: Semiconductors | |
| MarketCap: 107193 Millions | |
| Recent Price: 37.30 Smart Investing & Trading Score: 100 | |
| Day Percent Change: 3.78408% Day Change: 1.22 | |
| Week Change: 19.4747% Year-to-date Change: 84.5% | |
| INTC Links: Profile News Message Board | |
| Charts:- Daily , Weekly | |
| Add INTC to Watchlist: View: Get Complete INTC Trend Analysis ➞ | |
 | DOW Dow Inc |
| Sector: Materials | |
| SubSector: Chemicals | |
| MarketCap: 17366.7 Millions | |
| Recent Price: 23.69 Smart Investing & Trading Score: 80 | |
| Day Percent Change: 2.77657% Day Change: 0.75 | |
| Week Change: 2.4211% Year-to-date Change: -37.5% | |
| DOW Links: Profile News Message Board | |
| Charts:- Daily , Weekly | |
| Add DOW to Watchlist: View: Get Complete DOW Trend Analysis ➞ | |
 | CAT Caterpillar Inc |
| Sector: Industrials | |
| SubSector: Farm & Heavy Construction Machinery | |
| MarketCap: 198204 Millions | |
| Recent Price: 490.57 Smart Investing & Trading Score: 100 | |
| Day Percent Change: 2.02779% Day Change: 10.38 | |
| Week Change: 4.42325% Year-to-date Change: 38.0% | |
| CAT Links: Profile News Message Board | |
| Charts:- Daily , Weekly | |
| Add CAT to Watchlist: View: Get Complete CAT Trend Analysis ➞ | |
 | MMM 3M Co |
| Sector: Industrials | |
| SubSector: Conglomerates | |
| MarketCap: 82717.4 Millions | |
| Recent Price: 158.80 Smart Investing & Trading Score: 90 | |
| Day Percent Change: 1.79487% Day Change: 2.66 | |
| Week Change: 2.71669% Year-to-date Change: 23.6% | |
| MMM Links: Profile News Message Board | |
| Charts:- Daily , Weekly | |
| Add MMM to Watchlist: View: Get Complete MMM Trend Analysis ➞ | |
 | UNH Unitedhealth Group Inc |
| Sector: Health Care | |
| SubSector: Healthcare Plans | |
| MarketCap: 285640 Millions | |
| Recent Price: 353.72 Smart Investing & Trading Score: 100 | |
| Day Percent Change: 1.55613% Day Change: 5.44 | |
| Week Change: 0.542907% Year-to-date Change: -29.1% | |
| UNH Links: Profile News Message Board | |
| Charts:- Daily , Weekly | |
| Add UNH to Watchlist: View: Get Complete UNH Trend Analysis ➞ | |
 | CRM Salesforce Inc |
| Sector: Technology | |
| SubSector: Software - Application | |
| MarketCap: 238724 Millions | |
| Recent Price: 238.88 Smart Investing & Trading Score: 10 | |
| Day Percent Change: 1.35347% Day Change: 3.19 | |
| Week Change: -2.85087% Year-to-date Change: -27.5% | |
| CRM Links: Profile News Message Board | |
| Charts:- Daily , Weekly | |
| Add CRM to Watchlist: View: Get Complete CRM Trend Analysis ➞ | |
 | BA Boeing Co |
| Sector: Industrials | |
| SubSector: Aerospace & Defense | |
| MarketCap: 173621 Millions | |
| Recent Price: 217.43 Smart Investing & Trading Score: 60 | |
| Day Percent Change: 1.03625% Day Change: 2.92 | |
| Week Change: 1.08322% Year-to-date Change: 26.5% | |
| BA Links: Profile News Message Board | |
| Charts:- Daily , Weekly | |
| Add BA to Watchlist: View: Get Complete BA Trend Analysis ➞ | |
 | TRV Travelers Companies Inc |
| Sector: Financials | |
| SubSector: Insurance - Property & Casualty | |
| MarketCap: 61961.3 Millions | |
| Recent Price: 280.04 Smart Investing & Trading Score: 90 | |
| Day Percent Change: 1.00996% Day Change: 2.31 | |
| Week Change: 1.22172% Year-to-date Change: 17.2% | |
| TRV Links: Profile News Message Board | |
| Charts:- Daily , Weekly | |
| Add TRV to Watchlist: View: Get Complete TRV Trend Analysis ➞ | |
 | AMZN Amazon.com Inc |
| Sector: Services & Goods | |
| SubSector: Internet Retail | |
| MarketCap: 2477780 Millions | |
| Recent Price: 222.42 Smart Investing & Trading Score: 50 | |
| Day Percent Change: 0.811313% Day Change: 1.41 | |
| Week Change: 1.00359% Year-to-date Change: 1.0% | |
| AMZN Links: Profile News Message Board | |
| Charts:- Daily , Weekly | |
| Add AMZN to Watchlist: View: Get Complete AMZN Trend Analysis ➞ | |
 | AXP American Express Co |
| Sector: Financials | |
| SubSector: Credit Services | |
| MarketCap: 227011 Millions | |
| Recent Price: 330.48 Smart Investing & Trading Score: 30 | |
| Day Percent Change: 0.584368% Day Change: 2.35 | |
| Week Change: -2.93703% Year-to-date Change: 11.6% | |
| AXP Links: Profile News Message Board | |
| Charts:- Daily , Weekly | |
| Add AXP to Watchlist: View: Get Complete AXP Trend Analysis ➞ | |
 | NKE Nike, Inc |
| Sector: Services & Goods | |
| SubSector: Footwear & Accessories | |
| MarketCap: 109158 Millions | |
| Recent Price: 74.57 Smart Investing & Trading Score: 90 | |
| Day Percent Change: 0.498652% Day Change: -0.02 | |
| Week Change: 4.70373% Year-to-date Change: 2.4% | |
| NKE Links: Profile News Message Board | |
| Charts:- Daily , Weekly | |
| Add NKE to Watchlist: View: Get Complete NKE Trend Analysis ➞ | |
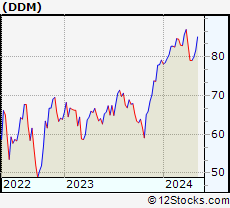 | DDM ProShares Ultra Dow30 2x Shares |
| Sector: Financials | |
| SubSector: Exchange Traded Fund | |
| MarketCap: Millions | |
| Recent Price: 107.86 Smart Investing & Trading Score: 90 | |
| Day Percent Change: 0.400261% Day Change: 0.67 | |
| Week Change: 1.64923% Year-to-date Change: 14.7% | |
| DDM Links: Profile News Message Board | |
| Charts:- Daily , Weekly | |
| Add DDM to Watchlist: View: Get Complete DDM Trend Analysis ➞ | |
 | HON Honeywell International Inc |
| Sector: Industrials | |
| SubSector: Conglomerates | |
| MarketCap: 136027 Millions | |
| Recent Price: 210.96 Smart Investing & Trading Score: 60 | |
| Day Percent Change: 0.37111% Day Change: 1.73 | |
| Week Change: 1.13135% Year-to-date Change: -5.5% | |
| HON Links: Profile News Message Board | |
| Charts:- Daily , Weekly | |
| Add HON to Watchlist: View: Get Complete HON Trend Analysis ➞ | |
 | SPY SPDR S&P 500 ETF Trust |
| Sector: Financials | |
| SubSector: Exchange Traded Fund | |
| MarketCap: Millions | |
| Recent Price: 669.22 Smart Investing & Trading Score: 90 | |
| Day Percent Change: 0.115192% Day Change: 1.12 | |
| Week Change: 1.22826% Year-to-date Change: 15.2% | |
| SPY Links: Profile News Message Board | |
| Charts:- Daily , Weekly | |
| Add SPY to Watchlist: View: Get Complete SPY Trend Analysis ➞ | |
 | IBM International Business Machines Corp |
| Sector: Technology | |
| SubSector: Information Technology Services | |
| MarketCap: 231510 Millions | |
| Recent Price: 286.72 Smart Investing & Trading Score: 90 | |
| Day Percent Change: 0.080282% Day Change: 0.96 | |
| Week Change: 7.17303% Year-to-date Change: 33.0% | |
| IBM Links: Profile News Message Board | |
| Charts:- Daily , Weekly | |
| Add IBM to Watchlist: View: Get Complete IBM Trend Analysis ➞ | |
 | JNJ Johnson & Johnson |
| Sector: Health Care | |
| SubSector: Drug Manufacturers - General | |
| MarketCap: 429720 Millions | |
| Recent Price: 185.98 Smart Investing & Trading Score: 100 | |
| Day Percent Change: -0.0376243% Day Change: -0.07 | |
| Week Change: 5.2578% Year-to-date Change: 31.3% | |
| JNJ Links: Profile News Message Board | |
| Charts:- Daily , Weekly | |
| Add JNJ to Watchlist: View: Get Complete JNJ Trend Analysis ➞ | |
 | MCD McDonald's Corp |
| Sector: Services & Goods | |
| SubSector: Restaurants | |
| MarketCap: 224343 Millions | |
| Recent Price: 299.88 Smart Investing & Trading Score: 10 | |
| Day Percent Change: -0.212964% Day Change: 1.48 | |
| Week Change: -1.46223% Year-to-date Change: 3.7% | |
| MCD Links: Profile News Message Board | |
| Charts:- Daily , Weekly | |
| Add MCD to Watchlist: View: Get Complete MCD Trend Analysis ➞ | |
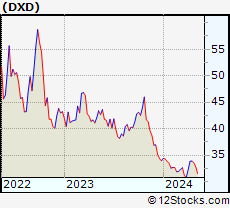 | DXD ProShares UltraShort Dow 30-2X Shares |
| Sector: Financials | |
| SubSector: Exchange Traded Fund | |
| MarketCap: Millions | |
| Recent Price: 21.89 Smart Investing & Trading Score: 10 | |
| Day Percent Change: -0.318761% Day Change: -0.09 | |
| Week Change: -1.52946% Year-to-date Change: -18.1% | |
| DXD Links: Profile News Message Board | |
| Charts:- Daily , Weekly | |
| Add DXD to Watchlist: View: Get Complete DXD Trend Analysis ➞ | |
 | AMGN AMGEN Inc |
| Sector: Health Care | |
| SubSector: Drug Manufacturers - General | |
| MarketCap: 152701 Millions | |
| Recent Price: 297.40 Smart Investing & Trading Score: 100 | |
| Day Percent Change: -0.368509% Day Change: -2.21 | |
| Week Change: 6.51099% Year-to-date Change: 16.7% | |
| AMGN Links: Profile News Message Board | |
| Charts:- Daily , Weekly | |
| Add AMGN to Watchlist: View: Get Complete AMGN Trend Analysis ➞ | |
 | WMT Walmart Inc |
| Sector: Consumer Staples | |
| SubSector: Discount Stores | |
| MarketCap: 801351 Millions | |
| Recent Price: 101.57 Smart Investing & Trading Score: 20 | |
| Day Percent Change: -0.382503% Day Change: 0.05 | |
| Week Change: -1.12917% Year-to-date Change: 13.4% | |
| WMT Links: Profile News Message Board | |
| Charts:- Daily , Weekly | |
| Add WMT to Watchlist: View: Get Complete WMT Trend Analysis ➞ | |
 | HD Home Depot, Inc |
| Sector: Services & Goods | |
| SubSector: Home Improvement Retail | |
| MarketCap: 417017 Millions | |
| Recent Price: 395.01 Smart Investing & Trading Score: 10 | |
| Day Percent Change: -0.506272% Day Change: -0.97 | |
| Week Change: -3.60202% Year-to-date Change: 3.0% | |
| HD Links: Profile News Message Board | |
| Charts:- Daily , Weekly | |
| Add HD to Watchlist: View: Get Complete HD Trend Analysis ➞ | |
 | V Visa Inc |
| Sector: Financials | |
| SubSector: Credit Services | |
| MarketCap: 661248 Millions | |
| Recent Price: 345.95 Smart Investing & Trading Score: 80 | |
| Day Percent Change: -0.540494% Day Change: -1.25 | |
| Week Change: 2.14657% Year-to-date Change: 10.6% | |
| V Links: Profile News Message Board | |
| Charts:- Daily , Weekly | |
| Add V to Watchlist: View: Get Complete V Trend Analysis ➞ | |
 | XOM Exxon Mobil Corp |
| Sector: Energy | |
| SubSector: Oil & Gas Integrated | |
| MarketCap: 465674 Millions | |
| Recent Price: 111.29 Smart Investing & Trading Score: 20 | |
| Day Percent Change: -0.625056% Day Change: -0.43 | |
| Week Change: -2.8544% Year-to-date Change: 5.6% | |
| XOM Links: Profile News Message Board | |
| Charts:- Daily , Weekly | |
| Add XOM to Watchlist: View: Get Complete XOM Trend Analysis ➞ | |
 | CSCO Cisco Systems, Inc |
| Sector: Technology | |
| SubSector: Communication Equipment | |
| MarketCap: 264469 Millions | |
| Recent Price: 68.31 Smart Investing & Trading Score: 70 | |
| Day Percent Change: -0.644364% Day Change: -0.08 | |
| Week Change: 1.46613% Year-to-date Change: 17.8% | |
| CSCO Links: Profile News Message Board | |
| Charts:- Daily , Weekly | |
| Add CSCO to Watchlist: View: Get Complete CSCO Trend Analysis ➞ | |
 | MRK Merck & Co Inc |
| Sector: Health Care | |
| SubSector: Drug Manufacturers - General | |
| MarketCap: 211587 Millions | |
| Recent Price: 89.51 Smart Investing & Trading Score: 100 | |
| Day Percent Change: -0.687895% Day Change: -1.1 | |
| Week Change: 12.3509% Year-to-date Change: -8.0% | |
| MRK Links: Profile News Message Board | |
| Charts:- Daily , Weekly | |
| Add MRK to Watchlist: View: Get Complete MRK Trend Analysis ➞ | |
 | DIS Walt Disney Co |
| Sector: Technology | |
| SubSector: Entertainment | |
| MarketCap: 211994 Millions | |
| Recent Price: 112.14 Smart Investing & Trading Score: 0 | |
| Day Percent Change: -0.717131% Day Change: -0.38 | |
| Week Change: -1.13727% Year-to-date Change: 1.6% | |
| DIS Links: Profile News Message Board | |
| Charts:- Daily , Weekly | |
| Add DIS to Watchlist: View: Get Complete DIS Trend Analysis ➞ | |
 | PG Procter & Gamble Co |
| Sector: Consumer Staples | |
| SubSector: Household & Personal Products | |
| MarketCap: 374826 Millions | |
| Recent Price: 152.05 Smart Investing & Trading Score: 20 | |
| Day Percent Change: -0.737694% Day Change: -1.13 | |
| Week Change: -0.24275% Year-to-date Change: -6.6% | |
| PG Links: Profile News Message Board | |
| Charts:- Daily , Weekly | |
| Add PG to Watchlist: View: Get Complete PG Trend Analysis ➞ | |
 | MSFT Microsoft Corporation |
| Sector: Technology | |
| SubSector: Software - Infrastructure | |
| MarketCap: 3679420 Millions | |
| Recent Price: 515.74 Smart Investing & Trading Score: 60 | |
| Day Percent Change: -0.763888% Day Change: -2.57 | |
| Week Change: 1.09576% Year-to-date Change: 23.7% | |
| MSFT Links: Profile News Message Board | |
| Charts:- Daily , Weekly | |
| Add MSFT to Watchlist: View: Get Complete MSFT Trend Analysis ➞ | |
 | CVX Chevron Corp |
| Sector: Energy | |
| SubSector: Oil & Gas Integrated | |
| MarketCap: 314603 Millions | |
| Recent Price: 153.37 Smart Investing & Trading Score: 50 | |
| Day Percent Change: -0.782766% Day Change: -0.63 | |
| Week Change: -3.64996% Year-to-date Change: 7.0% | |
| CVX Links: Profile News Message Board | |
| Charts:- Daily , Weekly | |
| Add CVX to Watchlist: View: Get Complete CVX Trend Analysis ➞ | |
 | GS Goldman Sachs Group, Inc |
| Sector: Financials | |
| SubSector: Capital Markets | |
| MarketCap: 223472 Millions | |
| Recent Price: 779.38 Smart Investing & Trading Score: 20 | |
| Day Percent Change: -0.780385% Day Change: -3.74 | |
| Week Change: -1.64683% Year-to-date Change: 36.9% | |
| GS Links: Profile News Message Board | |
| Charts:- Daily , Weekly | |
| Add GS to Watchlist: View: Get Complete GS Trend Analysis ➞ | |
| For tabular summary view of above stock list: Summary View ➞ 0 - 30 , 30 - 60 | ||
| Click To Change The Sort Order: By Market Cap or Company Size Performance: Year-to-date, Week and Day | |
| Select Chart Type: | ||
|
Best Stocks Today 12Stocks.com |
© 2025 12Stocks.com Terms & Conditions Privacy Contact Us
All Information Provided Only For Education And Not To Be Used For Investing or Trading. See Terms & Conditions


One More Thing ... Get Best Stocks Delivered Daily!
Never Ever Miss A Move With Our Top Ten Stocks Lists
Find Best Stocks In Any Market - Bull or Bear Market
Take A Peek At Our Top Ten Stocks Lists: Daily, Weekly, Year-to-Date & Top Trends
Find Best Stocks In Any Market - Bull or Bear Market
Take A Peek At Our Top Ten Stocks Lists: Daily, Weekly, Year-to-Date & Top Trends
Dow Jones Industrials Stocks With Best Up Trends [0-bearish to 100-bullish]: Intel Corp[100], Caterpillar [100], Unitedhealth [100], Johnson & Johnson[100], AMGEN [100], Merck & Co[100], 3M Co[90], Travelers [90], Nike [90], Ultra[90], SPDR S&P[90]
Best Dow Jones Industrials Stocks Year-to-Date:
Intel Corp[84.4708%], Caterpillar [38.0414%], Goldman Sachs[36.9027%], IBM Corp[32.9975%], Johnson & Johnson[31.2825%], JPMorgan Chase[30.2256%], Boeing Co[26.5084%], Microsoft [23.6855%], 3M Co[23.6433%], Cisco Systems[17.8477%], Travelers [17.2093%] Best Dow Jones Industrials Stocks This Week:
Intel Corp[19.4747%], Merck & Co[12.3509%], IBM Corp[7.17303%], AMGEN [6.51099%], Johnson & Johnson[5.2578%], Nike [4.70373%], Caterpillar [4.42325%], 3M Co[2.71669%], Dow [2.4211%], Visa [2.14657%], Ultra[1.64923%] Best Dow Jones Industrials Stocks Daily:
Intel Corp[3.78408%], Dow [2.77657%], Caterpillar [2.02779%], 3M Co[1.79487%], Unitedhealth [1.55613%], Salesforce [1.35347%], Boeing Co[1.03625%], Travelers [1.00996%], Amazon.com [0.811313%], American Express[0.584368%], Nike [0.498652%]