
 Login Sign Up


| |||||
 |  | ||||

| 12Stocks.com Market Intelligence |
Best Dow Stocks
|
On this page, you will find the most comprehensive analysis of Dow stocks and ETFs - from latest trends to performances to charts ➞. First, here are the year-to-date (YTD) performances of the most requested Dow stocks at 12Stocks.com (click stock for review):
| Walt Disney 26% | ||
| Caterpillar 23% | ||
| Exxon Mobil 21% | ||
| Walmart 14% | ||
| JPMorgan Chase 14% | ||
| IBM 13% | ||
| Procter & Gamble 11% | ||
| Goldman Sachs 10% | ||
| Microsoft 9% | ||
| Visa 6% | ||
| Coca-Cola 4% | ||
| Home Depot -4% | ||
| Johnson & Johnson -5% | ||
| McDonald s -7% | ||
| Apple -12% | ||
| NIKE -13% | ||
| Intel -31% | ||
| Boeing -37% | ||
| Dow Stocks Lists: Performances & Trends, Dow Stock Charts
Sort Dow stocks: Daily, Weekly, Year-to-Date, Market Cap & Trends. |
| 12Stocks.com Market Intelligence: Dow Industrials Daily Technical Insight | |||||||||
|
|  The overall Smart Investing & Trading Score is 65 (0-bearish to 100-bullish) which puts Dow index in short term neutral to bullish trend. The Smart Investing & Trading Score from previous trading session is 52 and an improvement of trend continues.
| ||||||||
Here are the Smart Investing & Trading Scores of the most requested Dow stocks at 12Stocks.com (click stock name for detailed review):
|


| 12Stocks.com: Top Performing Dow Index Stocks | ||||||||||||||||||||||||||||||||||||||||||||||||
 The top performing Dow Index stocks year to date are
Now, more recently, over last week, the top performing Dow Index stocks on the move are


|
||||||||||||||||||||||||||||||||||||||||||||||||
| 12Stocks.com: Investing in Dow Jones 30 Index with Stocks | |
|
The following table helps investors and traders sort through current performance and trends (as measured by Smart Investing & Trading Score) of various
stocks in the Dow 30 Index. Quick View: Move mouse or cursor over stock symbol (ticker) to view short-term technical chart and over stock name to view long term chart. Click on  to add stock symbol to your watchlist and to add stock symbol to your watchlist and  to view watchlist. Click on any ticker or stock name for detailed market intelligence report for that stock. to view watchlist. Click on any ticker or stock name for detailed market intelligence report for that stock. |
12Stocks.com Performance of Stocks in Dow Index
| Ticker | Stock Name | Watchlist | Category | Recent Price | Smart Investing & Trading Score | Change % | YTD Change% |
| KO | Coca-Cola |   | Consumer Staples | 61.55 | 100 | 1.50 | 4.45% |
| WMT | Walmart | | Services & Goods | 59.87 | 56 | 1.32 | 13.93% |
| IBM | IBM | | Technology | 184.10 | 45 | 1.05 | 12.56% |
| PG | Procter & Gamble | | Consumer Staples | 162.60 | 100 | 0.68 | 10.96% |
| NKE | NIKE | | Consumer Staples | 94.64 | 52 | 0.66 | -12.83% |
| INTC | Intel | | Technology | 34.50 | 42 | 0.64 | -31.34% |
| JPM | JPMorgan Chase | | Financials | 193.08 | 70 | 0.49 | 13.51% |
| CVX | Chevron | | Energy | 163.57 | 100 | 0.44 | 9.66% |
| DOW | Dow | | Materials | 56.98 | 61 | 0.42 | 3.90% |
| MSFT | Microsoft | | Technology | 409.06 | 58 | 0.37 | 8.78% |
| V | Visa | | Financials | 275.02 | 52 | 0.33 | 5.63% |
| DXD | UltraShort | | Utilities | 33.10 | 61 | 0.33 | -2.47% |
| UNH | UnitedHealth | | Health Care | 487.30 | 32 | 0.23 | -7.44% |
| DIS | Walt Disney | | Services & Goods | 113.92 | 68 | 0.18 | 26.17% |
| MRK | Merck | | Health Care | 127.00 | 63 | 0.09 | 16.49% |
| AXP | American Express | | Financials | 239.12 | 100 | 0.07 | 27.64% |
| CAT | Caterpillar | | Industrials | 363.52 | 68 | 0.07 | 22.95% |
| CSCO | Cisco Systems | | Technology | 48.35 | 35 | 0.06 | -4.30% |
| XOM | Exxon Mobil | | Energy | 121.05 | 76 | 0.02 | 21.07% |
| MCD | McDonald s | | Services & Goods | 276.75 | 57 | -0.05 | -6.66% |
| SPY | SPDR S&P | | Utilities | 505.41 | 58 | -0.05 | 6.33% |
| CRM | salesforce.com | | Technology | 276.19 | 32 | -0.18 | 4.96% |
| AMGN | Amgen | | Health Care | 273.01 | 64 | -0.19 | -5.21% |
| GS | Goldman Sachs | | Financials | 423.04 | 100 | -0.23 | 9.66% |
| DDM | Ultra | | Utilities | 81.01 | 67 | -0.27 | 2.27% |
| TRV | Travelers | | Financials | 213.43 | 44 | -0.42 | 12.04% |
| VZ | Verizon | | Technology | 39.49 | 15 | -0.53 | 4.75% |
| JNJ | Johnson & Johnson | | Health Care | 148.53 | 25 | -0.69 | -5.24% |
| HON | Honeywell | | Industrials | 194.79 | 18 | -0.70 | -7.11% |
| MMM | 3M | | Industrials | 92.02 | 40 | -1.05 | -15.83% |
| For chart view version of above stock list: Chart View ➞ 0 - 30 , 30 - 60 | ||
 | Click To Change The Sort Order: By Market Cap or Company Size Performance: Year-to-date, Week and Day |  |
|
Get the most comprehensive stock market coverage daily at 12Stocks.com ➞ Best Stocks Today ➞ Best Stocks Weekly ➞ Best Stocks Year-to-Date ➞ Best Stocks Trends ➞  Best Stocks Today 12Stocks.com Best Nasdaq Stocks ➞ Best S&P 500 Stocks ➞ Best Tech Stocks ➞ Best Biotech Stocks ➞ |
| Detailed Overview of Dow Stocks |
| Dow Technical Overview, Leaders & Laggards, Top Dow ETF Funds & Detailed Dow Stocks List, Charts, Trends & More |
| Dow: Technical Analysis, Trends & YTD Performance | |
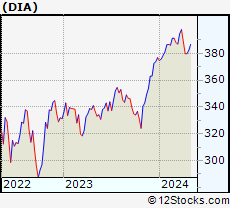
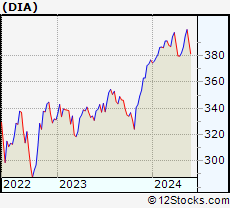
| Dow Jones Industrial index as represented by
DIA, an exchange-traded fund [ETF], holds basket of all thirty Dow stocks. The Dow 30 index (contains stocks like Microsoft and Pfizer) is up by 2.01% and is currently underperforming the overall market by -3.65% year-to-date. Below is a quick view of technical charts and trends: | |
 DIA Weekly Chart |
|
| Long Term Trend: Good | |
| Medium Term Trend: Not Good | |
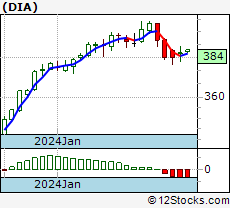
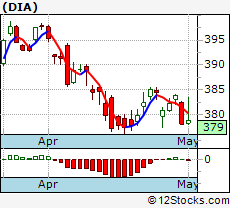 DIA Daily Chart |
|
| Short Term Trend: Very Good | |
| Overall Trend Score: 65 | |
| YTD Performance: 2.01% | |
| **Trend Scores & Views Are Only For Educational Purposes And Not For Investing | |
| 12Stocks.com: Investing in Dow Jones 30 Index using Exchange Traded Funds | |
|
The following table shows list of key exchange traded funds (ETF) that
help investors track Dow Jones 30 industrial index. The following list also includes leveraged ETF funds that track twice or thrice the daily returns of Dow indices. Short or inverse ETF funds move in the opposite direction to the index they track and are useful during market pullbacks or during bear markets. Quick View: Move mouse or cursor over ETF symbol (ticker) to view short-term technical chart and over ETF name to view long term chart. Click on ticker or stock name for detailed view. Click on to add stock symbol to your watchlist and to view watchlist. |
12Stocks.com List of ETFs that track Dow Jones 30 Index
| Ticker | ETF Name | Watchlist | Recent Price | Smart Investing & Trading Score | Change % | Week % | Year-to-date % |
| SDOW | ProShares UltraPro Short Dow30 | | 17.54 | 30 | 0.52 | -3.63 | -4.62% |
| DIA | SPDR Dow Jones Industrial Average ETF | | 384.44 | 65 | -0.15 | 1.22 | 2.01% |
| UDOW | ProShares UltraPro Dow30 | | 76.18 | 52 | -0.54 | 3.6 | 2.45% |
| DXD | ProShares UltraShort Dow30 | | 33.10 | 61 | 0.33 | -2.36 | -2.47% |
| DDM | ProShares Ultra Dow30 | | 81.01 | 67 | -0.27 | 2.45 | 2.27% |
| 12Stocks.com: Charts, Trends, Fundamental Data and Performances of Dow Stocks | |
|
We now take in-depth look at all Dow stocks including charts, multi-period performances and overall trends (as measured by Smart Investing & Trading Score). One can sort Dow stocks (click link to choose) by Daily, Weekly and by Year-to-Date performances. Also, one can sort by size of the company or by market capitalization. |
| Select Your Default Chart Type: | |||||
| |||||
| Click on stock symbol or name for detailed view. Click on to add stock symbol to your watchlist and to view watchlist. Quick View: Move mouse or cursor over "Daily" to quickly view daily technical stock chart and over "Weekly" to view weekly technical stock chart. | |||||
 | KO The Coca-Cola Company |
| Sector: Consumer Staples | |
| SubSector: Beverages - Soft Drinks | |
| MarketCap: 182046 Millions | |
| Recent Price: 61.55 Smart Investing & Trading Score: 100 | |
| Day Percent Change: 1.50% Day Change: 0.91 | |
| Week Change: 2.29% Year-to-date Change: 4.5% | |
| KO Links: Profile News Message Board | |
| Charts:- Daily , Weekly | |
| Add KO to Watchlist: View: Get Complete KO Trend Analysis ➞ | |
 | WMT Walmart Inc. |
| Sector: Services & Goods | |
| SubSector: Discount, Variety Stores | |
| MarketCap: 355610 Millions | |
| Recent Price: 59.87 Smart Investing & Trading Score: 56 | |
| Day Percent Change: 1.32% Day Change: 0.78 | |
| Week Change: 0.57% Year-to-date Change: 13.9% | |
| WMT Links: Profile News Message Board | |
| Charts:- Daily , Weekly | |
| Add WMT to Watchlist: View: Get Complete WMT Trend Analysis ➞ | |
 | IBM International Business Machines Corporation |
| Sector: Technology | |
| SubSector: Information Technology Services | |
| MarketCap: 97241.6 Millions | |
| Recent Price: 184.10 Smart Investing & Trading Score: 45 | |
| Day Percent Change: 1.05% Day Change: 1.91 | |
| Week Change: 1.39% Year-to-date Change: 12.6% | |
| IBM Links: Profile News Message Board | |
| Charts:- Daily , Weekly | |
| Add IBM to Watchlist: View: Get Complete IBM Trend Analysis ➞ | |
 | PG The Procter & Gamble Company |
| Sector: Consumer Staples | |
| SubSector: Personal Products | |
| MarketCap: 277162 Millions | |
| Recent Price: 162.60 Smart Investing & Trading Score: 100 | |
| Day Percent Change: 0.68% Day Change: 1.10 | |
| Week Change: 2.82% Year-to-date Change: 11.0% | |
| PG Links: Profile News Message Board | |
| Charts:- Daily , Weekly | |
| Add PG to Watchlist: View: Get Complete PG Trend Analysis ➞ | |
 | NKE NIKE, Inc. |
| Sector: Consumer Staples | |
| SubSector: Textile - Apparel Footwear & Accessories | |
| MarketCap: 118918 Millions | |
| Recent Price: 94.64 Smart Investing & Trading Score: 52 | |
| Day Percent Change: 0.66% Day Change: 0.62 | |
| Week Change: 0.12% Year-to-date Change: -12.8% | |
| NKE Links: Profile News Message Board | |
| Charts:- Daily , Weekly | |
| Add NKE to Watchlist: View: Get Complete NKE Trend Analysis ➞ | |
 | INTC Intel Corporation |
| Sector: Technology | |
| SubSector: Semiconductor - Broad Line | |
| MarketCap: 222357 Millions | |
| Recent Price: 34.50 Smart Investing & Trading Score: 42 | |
| Day Percent Change: 0.64% Day Change: 0.22 | |
| Week Change: 0.88% Year-to-date Change: -31.3% | |
| INTC Links: Profile News Message Board | |
| Charts:- Daily , Weekly | |
| Add INTC to Watchlist: View: Get Complete INTC Trend Analysis ➞ | |
 | JPM JPMorgan Chase & Co. |
| Sector: Financials | |
| SubSector: Money Center Banks | |
| MarketCap: 279736 Millions | |
| Recent Price: 193.08 Smart Investing & Trading Score: 70 | |
| Day Percent Change: 0.49% Day Change: 0.94 | |
| Week Change: 3.92% Year-to-date Change: 13.5% | |
| JPM Links: Profile News Message Board | |
| Charts:- Daily , Weekly | |
| Add JPM to Watchlist: View: Get Complete JPM Trend Analysis ➞ | |
 | CVX Chevron Corporation |
| Sector: Energy | |
| SubSector: Major Integrated Oil & Gas | |
| MarketCap: 121521 Millions | |
| Recent Price: 163.57 Smart Investing & Trading Score: 100 | |
| Day Percent Change: 0.44% Day Change: 0.72 | |
| Week Change: 2.23% Year-to-date Change: 9.7% | |
| CVX Links: Profile News Message Board | |
| Charts:- Daily , Weekly | |
| Add CVX to Watchlist: View: Get Complete CVX Trend Analysis ➞ | |
 | DOW Dow Inc. |
| Sector: Materials | |
| SubSector: Chemicals - Major Diversified | |
| MarketCap: 24098.6 Millions | |
| Recent Price: 56.98 Smart Investing & Trading Score: 61 | |
| Day Percent Change: 0.42% Day Change: 0.24 | |
| Week Change: 0.56% Year-to-date Change: 3.9% | |
| DOW Links: Profile News Message Board | |
| Charts:- Daily , Weekly | |
| Add DOW to Watchlist: View: Get Complete DOW Trend Analysis ➞ | |
 | MSFT Microsoft Corporation |
| Sector: Technology | |
| SubSector: Business Software & Services | |
| MarketCap: 1154150 Millions | |
| Recent Price: 409.06 Smart Investing & Trading Score: 58 | |
| Day Percent Change: 0.37% Day Change: 1.49 | |
| Week Change: 2.49% Year-to-date Change: 8.8% | |
| MSFT Links: Profile News Message Board | |
| Charts:- Daily , Weekly | |
| Add MSFT to Watchlist: View: Get Complete MSFT Trend Analysis ➞ | |
 | V Visa Inc. |
| Sector: Financials | |
| SubSector: Credit Services | |
| MarketCap: 340798 Millions | |
| Recent Price: 275.02 Smart Investing & Trading Score: 52 | |
| Day Percent Change: 0.33% Day Change: 0.91 | |
| Week Change: 1.94% Year-to-date Change: 5.6% | |
| V Links: Profile News Message Board | |
| Charts:- Daily , Weekly | |
| Add V to Watchlist: View: Get Complete V Trend Analysis ➞ | |
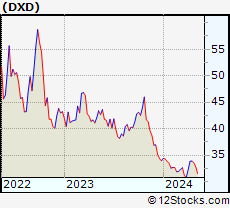 | DXD ProShares UltraShort Dow30 |
| Sector: Utilities | |
| SubSector: Exchange Traded Fund | |
| MarketCap: 0 Millions | |
| Recent Price: 33.10 Smart Investing & Trading Score: 61 | |
| Day Percent Change: 0.33% Day Change: 0.11 | |
| Week Change: -2.36% Year-to-date Change: -2.5% | |
| DXD Links: Profile News Message Board | |
| Charts:- Daily , Weekly | |
| Add DXD to Watchlist: View: Get Complete DXD Trend Analysis ➞ | |
 | UNH UnitedHealth Group Incorporated |
| Sector: Health Care | |
| SubSector: Health Care Plans | |
| MarketCap: 217384 Millions | |
| Recent Price: 487.30 Smart Investing & Trading Score: 32 | |
| Day Percent Change: 0.23% Day Change: 1.12 | |
| Week Change: -2.76% Year-to-date Change: -7.4% | |
| UNH Links: Profile News Message Board | |
| Charts:- Daily , Weekly | |
| Add UNH to Watchlist: View: Get Complete UNH Trend Analysis ➞ | |
 | DIS The Walt Disney Company |
| Sector: Services & Goods | |
| SubSector: Entertainment - Diversified | |
| MarketCap: 178396 Millions | |
| Recent Price: 113.92 Smart Investing & Trading Score: 68 | |
| Day Percent Change: 0.18% Day Change: 0.21 | |
| Week Change: 1.16% Year-to-date Change: 26.2% | |
| DIS Links: Profile News Message Board | |
| Charts:- Daily , Weekly | |
| Add DIS to Watchlist: View: Get Complete DIS Trend Analysis ➞ | |
 | MRK Merck & Co., Inc. |
| Sector: Health Care | |
| SubSector: Drug Manufacturers - Major | |
| MarketCap: 192657 Millions | |
| Recent Price: 127.00 Smart Investing & Trading Score: 63 | |
| Day Percent Change: 0.09% Day Change: 0.12 | |
| Week Change: 0.97% Year-to-date Change: 16.5% | |
| MRK Links: Profile News Message Board | |
| Charts:- Daily , Weekly | |
| Add MRK to Watchlist: View: Get Complete MRK Trend Analysis ➞ | |
 | AXP American Express Company |
| Sector: Financials | |
| SubSector: Credit Services | |
| MarketCap: 68388 Millions | |
| Recent Price: 239.12 Smart Investing & Trading Score: 100 | |
| Day Percent Change: 0.07% Day Change: 0.16 | |
| Week Change: 3.5% Year-to-date Change: 27.6% | |
| AXP Links: Profile News Message Board | |
| Charts:- Daily , Weekly | |
| Add AXP to Watchlist: View: Get Complete AXP Trend Analysis ➞ | |
 | CAT Caterpillar Inc. |
| Sector: Industrials | |
| SubSector: Farm & Construction Machinery | |
| MarketCap: 58636 Millions | |
| Recent Price: 363.52 Smart Investing & Trading Score: 68 | |
| Day Percent Change: 0.07% Day Change: 0.27 | |
| Week Change: 2.5% Year-to-date Change: 23.0% | |
| CAT Links: Profile News Message Board | |
| Charts:- Daily , Weekly | |
| Add CAT to Watchlist: View: Get Complete CAT Trend Analysis ➞ | |
 | CSCO Cisco Systems, Inc. |
| Sector: Technology | |
| SubSector: Communication Equipment | |
| MarketCap: 168483 Millions | |
| Recent Price: 48.35 Smart Investing & Trading Score: 35 | |
| Day Percent Change: 0.06% Day Change: 0.03 | |
| Week Change: 0.06% Year-to-date Change: -4.3% | |
| CSCO Links: Profile News Message Board | |
| Charts:- Daily , Weekly | |
| Add CSCO to Watchlist: View: Get Complete CSCO Trend Analysis ➞ | |
 | XOM Exxon Mobil Corporation |
| Sector: Energy | |
| SubSector: Major Integrated Oil & Gas | |
| MarketCap: 156450 Millions | |
| Recent Price: 121.05 Smart Investing & Trading Score: 76 | |
| Day Percent Change: 0.02% Day Change: 0.02 | |
| Week Change: 0.98% Year-to-date Change: 21.1% | |
| XOM Links: Profile News Message Board | |
| Charts:- Daily , Weekly | |
| Add XOM to Watchlist: View: Get Complete XOM Trend Analysis ➞ | |
 | MCD McDonald s Corporation |
| Sector: Services & Goods | |
| SubSector: Restaurants | |
| MarketCap: 122481 Millions | |
| Recent Price: 276.75 Smart Investing & Trading Score: 57 | |
| Day Percent Change: -0.05% Day Change: -0.13 | |
| Week Change: 1.75% Year-to-date Change: -6.7% | |
| MCD Links: Profile News Message Board | |
| Charts:- Daily , Weekly | |
| Add MCD to Watchlist: View: Get Complete MCD Trend Analysis ➞ | |
 | SPY SPDR S&P 500 ETF |
| Sector: Utilities | |
| SubSector: Exchange Traded Fund | |
| MarketCap: 0 Millions | |
| Recent Price: 505.41 Smart Investing & Trading Score: 58 | |
| Day Percent Change: -0.05% Day Change: -0.24 | |
| Week Change: 2.07% Year-to-date Change: 6.3% | |
| SPY Links: Profile News Message Board | |
| Charts:- Daily , Weekly | |
| Add SPY to Watchlist: View: Get Complete SPY Trend Analysis ➞ | |
 | CRM salesforce.com, inc. |
| Sector: Technology | |
| SubSector: Application Software | |
| MarketCap: 137120 Millions | |
| Recent Price: 276.19 Smart Investing & Trading Score: 32 | |
| Day Percent Change: -0.18% Day Change: -0.49 | |
| Week Change: 2.15% Year-to-date Change: 5.0% | |
| CRM Links: Profile News Message Board | |
| Charts:- Daily , Weekly | |
| Add CRM to Watchlist: View: Get Complete CRM Trend Analysis ➞ | |
 | AMGN Amgen Inc. |
| Sector: Health Care | |
| SubSector: Biotechnology | |
| MarketCap: 121030 Millions | |
| Recent Price: 273.01 Smart Investing & Trading Score: 64 | |
| Day Percent Change: -0.19% Day Change: -0.53 | |
| Week Change: 1.52% Year-to-date Change: -5.2% | |
| AMGN Links: Profile News Message Board | |
| Charts:- Daily , Weekly | |
| Add AMGN to Watchlist: View: Get Complete AMGN Trend Analysis ➞ | |
 | GS The Goldman Sachs Group, Inc. |
| Sector: Financials | |
| SubSector: Investment Brokerage - National | |
| MarketCap: 54579.3 Millions | |
| Recent Price: 423.04 Smart Investing & Trading Score: 100 | |
| Day Percent Change: -0.23% Day Change: -0.96 | |
| Week Change: 4.71% Year-to-date Change: 9.7% | |
| GS Links: Profile News Message Board | |
| Charts:- Daily , Weekly | |
| Add GS to Watchlist: View: Get Complete GS Trend Analysis ➞ | |
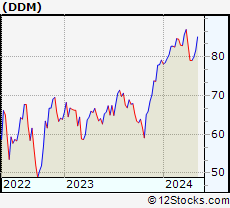 | DDM ProShares Ultra Dow30 |
| Sector: Utilities | |
| SubSector: Exchange Traded Fund | |
| MarketCap: 0 Millions | |
| Recent Price: 81.01 Smart Investing & Trading Score: 67 | |
| Day Percent Change: -0.27% Day Change: -0.22 | |
| Week Change: 2.45% Year-to-date Change: 2.3% | |
| DDM Links: Profile News Message Board | |
| Charts:- Daily , Weekly | |
| Add DDM to Watchlist: View: Get Complete DDM Trend Analysis ➞ | |
 | TRV The Travelers Companies, Inc. |
| Sector: Financials | |
| SubSector: Property & Casualty Insurance | |
| MarketCap: 25155.9 Millions | |
| Recent Price: 213.43 Smart Investing & Trading Score: 44 | |
| Day Percent Change: -0.42% Day Change: -0.89 | |
| Week Change: -0.3% Year-to-date Change: 12.0% | |
| TRV Links: Profile News Message Board | |
| Charts:- Daily , Weekly | |
| Add TRV to Watchlist: View: Get Complete TRV Trend Analysis ➞ | |
 | VZ Verizon Communications Inc. |
| Sector: Technology | |
| SubSector: Telecom Services - Domestic | |
| MarketCap: 229427 Millions | |
| Recent Price: 39.49 Smart Investing & Trading Score: 15 | |
| Day Percent Change: -0.53% Day Change: -0.21 | |
| Week Change: -2.47% Year-to-date Change: 4.8% | |
| VZ Links: Profile News Message Board | |
| Charts:- Daily , Weekly | |
| Add VZ to Watchlist: View: Get Complete VZ Trend Analysis ➞ | |
 | JNJ Johnson & Johnson |
| Sector: Health Care | |
| SubSector: Drug Manufacturers - Major | |
| MarketCap: 331972 Millions | |
| Recent Price: 148.53 Smart Investing & Trading Score: 25 | |
| Day Percent Change: -0.69% Day Change: -1.03 | |
| Week Change: 0.42% Year-to-date Change: -5.2% | |
| JNJ Links: Profile News Message Board | |
| Charts:- Daily , Weekly | |
| Add JNJ to Watchlist: View: Get Complete JNJ Trend Analysis ➞ | |
 | HON Honeywell International Inc. |
| Sector: Industrials | |
| SubSector: Diversified Machinery | |
| MarketCap: 91189.1 Millions | |
| Recent Price: 194.79 Smart Investing & Trading Score: 18 | |
| Day Percent Change: -0.70% Day Change: -1.37 | |
| Week Change: 0.27% Year-to-date Change: -7.1% | |
| HON Links: Profile News Message Board | |
| Charts:- Daily , Weekly | |
| Add HON to Watchlist: View: Get Complete HON Trend Analysis ➞ | |
 | MMM 3M Company |
| Sector: Industrials | |
| SubSector: Diversified Machinery | |
| MarketCap: 79237.7 Millions | |
| Recent Price: 92.02 Smart Investing & Trading Score: 40 | |
| Day Percent Change: -1.05% Day Change: -0.98 | |
| Week Change: -0.27% Year-to-date Change: -15.8% | |
| MMM Links: Profile News Message Board | |
| Charts:- Daily , Weekly | |
| Add MMM to Watchlist: View: Get Complete MMM Trend Analysis ➞ | |
| For tabular summary view of above stock list: Summary View ➞ 0 - 30 , 30 - 60 | ||
| Click To Change The Sort Order: By Market Cap or Company Size Performance: Year-to-date, Week and Day | |
| Select Chart Type: | ||
|
Best Stocks Today 12Stocks.com |
© 2024 12Stocks.com Terms & Conditions Privacy Contact Us
All Information Provided Only For Education And Not To Be Used For Investing or Trading. See Terms & Conditions


One More Thing ... Get Best Stocks Delivered Daily!
Never Ever Miss A Move With Our Top Ten Stocks Lists
Find Best Stocks In Any Market - Bull or Bear Market
Take A Peek At Our Top Ten Stocks Lists: Daily, Weekly, Year-to-Date & Top Trends
Find Best Stocks In Any Market - Bull or Bear Market
Take A Peek At Our Top Ten Stocks Lists: Daily, Weekly, Year-to-Date & Top Trends
Dow Jones Industrials Stocks With Best Up Trends [0-bearish to 100-bullish]: Coca-Cola [100], Procter & Gamble[100], Chevron [100], American Express[100], Goldman Sachs[100], Exxon Mobil[76], JPMorgan Chase[70], Walt Disney[68], Caterpillar [68], Ultra[67], Amgen [64]
Best Dow Jones Industrials Stocks Year-to-Date:
American Express[27.64%], Walt Disney[26.17%], Caterpillar [22.95%], Exxon Mobil[21.07%], Merck [16.49%], Amazon.com [16.22%], Walmart [13.93%], JPMorgan Chase[13.51%], IBM [12.56%], Travelers [12.04%], Procter & Gamble[10.96%] Best Dow Jones Industrials Stocks This Week:
Goldman Sachs[4.71%], JPMorgan Chase[3.92%], American Express[3.5%], Procter & Gamble[2.82%], Caterpillar [2.5%], Microsoft [2.49%], Ultra[2.45%], Coca-Cola [2.29%], Chevron [2.23%], salesforce.com [2.15%], SPDR S&P[2.07%] Best Dow Jones Industrials Stocks Daily:
Coca-Cola [1.50%], Walmart [1.32%], IBM [1.05%], Procter & Gamble[0.68%], NIKE [0.66%], Intel [0.64%], JPMorgan Chase[0.49%], Chevron [0.44%], Dow [0.42%], Microsoft [0.37%], Visa [0.33%]