
 Login Sign Up


| |||||
 |  | ||||

| 12Stocks.com Market Intelligence |
Best China Stocks
|
On this page, you will find the most comprehensive analysis of Chinese stocks and ETFs - from latest trends to performances to charts ➞. First, here are the year-to-date (YTD) performances of the most requested China stocks at 12Stocks.com (click stock for review):
| Sohu.com 20% | ||
| New Oriental 16% | ||
| JD.com 14% | ||
| NetEase 11% | ||
| Alibaba 5% | ||
| Baidu -5% | ||
| Vipshop -7% | ||
| Weibo -12% | ||
| JOYY -15% | ||
| In a hurry? China Stocks Lists: Performance Trends Table, Stock Charts
Sort China stocks: Daily, Weekly, Year-to-Date, Market Cap & Trends. Filter China stocks list by sector: Show all, Tech, Finance, Energy, Staples, Retail, Industrial, Materials, Utilities and HealthCare Filter China stocks list by size: All China Large Medium Small and MicroCap |
| May 6, 2024 - 12Stocks.com China Stocks Performances & Trends Daily | |||||||||
|
|  The overall Smart Investing & Trading Score is 100 (0-bearish to 100-bullish) which puts China index in short term bullish trend. The Smart Investing & Trading Score from previous trading session is 83 and an improvement of trend continues.
| ||||||||
| Here are the Smart Investing & Trading Scores of the most requested China stocks at 12Stocks.com (click stock name for detailed review): |

| 12Stocks.com: Top Performing China Index Stocks | ||||||||||||||||||||||||||||||||||||||||||||||||
 The top performing China Index stocks year to date are
Now, more recently, over last week, the top performing China Index stocks on the move are


|
||||||||||||||||||||||||||||||||||||||||||||||||
| 12Stocks.com: Investing in China Index with Stocks | |
|
The following table helps investors and traders sort through current performance and trends (as measured by Smart Investing & Trading Score) of various
stocks in the China Index. Quick View: Move mouse or cursor over stock symbol (ticker) to view short-term technical chart and over stock name to view long term chart. Click on  to add stock symbol to your watchlist and to add stock symbol to your watchlist and  to view watchlist. Click on any ticker or stock name for detailed market intelligence report for that stock. to view watchlist. Click on any ticker or stock name for detailed market intelligence report for that stock. |
12Stocks.com Performance of Stocks in China Index
| Ticker | Stock Name | Watchlist | Category | Recent Price | Smart Investing & Trading Score | Change % | YTD Change% |
| FENG | Phoenix New |   | Technology | 2.11 | 75 | 0.48% | 55.15% |
| HKD | AMTD Digital | | Technology | 3.77 | 74 | 8.33% | -8.72% |
| YI | 111 | | Services & Goods | 1.15 | 74 | 2.68% | -25.81% |
| JKS | JinkoSolar Holding | | Technology | 26.18 | 74 | 2.55% | -29.13% |
| OCFT | OneConnect Financial | | Technology | 2.42 | 74 | 12.04% | -23.17% |
| MLCO | Melco Resorts | | Services & Goods | 7.24 | 74 | 1.26% | -18.38% |
| XPEV | XPeng | | Services & Goods | 9.06 | 74 | -3.62% | -37.90% |
| NIO | NIO | | Consumer Staples | 5.57 | 74 | -0.36% | -38.59% |
| YQ | 17 Education | | Consumer Staples | 2.83 | 73 | -0.70% | 38.73% |
| YSG | Yatsen Holding | | Services & Goods | 4.34 | 71 | 3.09% | 493.22% |
| SY | So-Young | | Technology | 1.29 | 71 | 0.00% | 0.00% |
| VIOT | Viomi | | Technology | 0.67 | 70 | -3.51% | -32.65% |
| NTES | NetEase | | Technology | 103.02 | 69 | 4.11% | 10.58% |
| TUYA | Tuya | | Technology | 1.82 | 69 | 1.96% | -20.70% |
| MOMO | Momo | | Technology | 6.19 | 69 | 0.98% | -10.94% |
| BGNE | BeiGene | | Health Care | 162.25 | 69 | 0.15% | -10.04% |
| UCL | uCloudlink | | Technology | 1.52 | 68 | 0.00% | -17.57% |
| BEST | BEST | | Consumer Staples | 2.13 | 68 | 0.00% | -16.52% |
| TOUR | Tuniu | | Consumer Staples | 0.92 | 68 | -1.11% | 37.79% |
| UTSI | UTStarcom | | Technology | 2.79 | 67 | 3.72% | -18.90% |
| UXIN | Uxin | | Technology | 2.02 | 64 | 4.12% | 188.16% |
| TAL | TAL Education | | Services & Goods | 13.18 | 64 | 2.97% | 4.35% |
| VIPS | Vipshop | | Services & Goods | 16.45 | 64 | 2.43% | -7.38% |
| LX | LexinFintech | | Financials | 1.82 | 64 | 2.25% | -1.09% |
| APM | Aptorum | | Health Care | 5.59 | 63 | 3.33% | 128.29% |
| For chart view version of above stock list: Chart View ➞ 0 - 25 , 25 - 50 , 50 - 75 , 75 - 100 , 100 - 125 , 125 - 150 | ||
 | Click To Change The Sort Order: By Market Cap or Company Size Performance: Year-to-date, Week and Day |  |
|
Get the most comprehensive stock market coverage daily at 12Stocks.com ➞ Best Stocks Today ➞ Best Stocks Weekly ➞ Best Stocks Year-to-Date ➞ Best Stocks Trends ➞  Best Stocks Today 12Stocks.com Best Nasdaq Stocks ➞ Best S&P 500 Stocks ➞ Best Tech Stocks ➞ Best Biotech Stocks ➞ |
| Detailed Overview of China Stocks |
| China Technical Overview, Leaders & Laggards, Top China ETF Funds & Detailed China Stocks List, Charts, Trends & More |
| China: Technical Analysis, Trends & YTD Performance | |
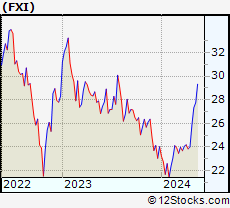
 FXI Weekly Chart |
|
| Long Term Trend: Very Good | |
| Medium Term Trend: Very Good | |
 FXI Daily Chart |
|
| Short Term Trend: Very Good | |
| Overall Trend Score: 100 | |
| YTD Performance: 13.73% | |
| **Trend Scores & Views Are Only For Educational Purposes And Not For Investing | |
| 12Stocks.com: Investing in China Index using Exchange Traded Funds | |
|
The following table shows list of key exchange traded funds (ETF) that
help investors play China stock market. For detailed view, check out our ETF Funds section of our website. Quick View: Move mouse or cursor over ETF symbol (ticker) to view short-term technical chart and over ETF name to view long term chart. Click on ticker or stock name for detailed view. Click on to add stock symbol to your watchlist and to view watchlist. |
12Stocks.com List of ETFs that track China Index
| Ticker | ETF Name | Watchlist | Recent Price | Smart Investing & Trading Score | Change % | Week % | Year-to-date % |
| FXI | China Large-Cap | | 27.33 | 100 | 0.66 | 5.64 | 13.73% |
| EWH | Hong Kong | | 16.90 | 100 | 0.66 | 5.76 | -2.71% |
| YINN | China Bull 3X | | 27.05 | 100 | 2.50 | 16.54 | 29.18% |
| YANG | China Bear 3X | | 7.73 | 0 | -2.77 | -17.24 | -39.61% |
| XPP | China 50 | | 16.65 | 100 | 1.71 | 10.78 | 21.13% |
| MCHI | China | | 44.77 | 100 | 0.67 | 5.71 | 9.89% |
| GXC | China | | 73.06 | 100 | 0.45 | 5.21 | 7.25% |
| CBON | ChinaAMC China Bond | | 22.00 | 59 | 0.11 | 0.76 | -0.43% |
| 12Stocks.com: Charts, Trends, Fundamental Data and Performances of China Stocks | |
|
We now take in-depth look at all China stocks including charts, multi-period performances and overall trends (as measured by Smart Investing & Trading Score). One can sort China stocks (click link to choose) by Daily, Weekly and by Year-to-Date performances. Also, one can sort by size of the company or by market capitalization. |
| Select Your Default Chart Type: | |||||
| |||||
| Click on stock symbol or name for detailed view. Click on to add stock symbol to your watchlist and to view watchlist. Quick View: Move mouse or cursor over "Daily" to quickly view daily technical stock chart and over "Weekly" to view weekly technical stock chart. | |||||

 | FENG Phoenix New Media Limited |
| Sector: Technology | |
| SubSector: Internet Information Providers | |
| MarketCap: 107.08 Millions | |
| Recent Price: 2.11 Smart Investing & Trading Score: 75 | |
| Day Percent Change: 0.48% Day Change: 0.01 | |
| Week Change: 20.57% Year-to-date Change: 55.2% | |
| FENG Links: Profile News Message Board | |
| Charts:- Daily , Weekly | |
| Add FENG to Watchlist: View: Get Complete FENG Trend Analysis ➞ | |
 | HKD AMTD Digital Inc. |
| Sector: Technology | |
| SubSector: Software - Application | |
| MarketCap: 1200 Millions | |
| Recent Price: 3.77 Smart Investing & Trading Score: 74 | |
| Day Percent Change: 8.33% Day Change: 0.29 | |
| Week Change: 16.36% Year-to-date Change: -8.7% | |
| HKD Links: Profile News Message Board | |
| Charts:- Daily , Weekly | |
| Add HKD to Watchlist: View: Get Complete HKD Trend Analysis ➞ | |
 | YI 111, Inc. |
| Sector: Services & Goods | |
| SubSector: Drug Stores | |
| MarketCap: 520.351 Millions | |
| Recent Price: 1.15 Smart Investing & Trading Score: 74 | |
| Day Percent Change: 2.68% Day Change: 0.03 | |
| Week Change: 12.2% Year-to-date Change: -25.8% | |
| YI Links: Profile News Message Board | |
| Charts:- Daily , Weekly | |
| Add YI to Watchlist: View: Get Complete YI Trend Analysis ➞ | |
 | JKS JinkoSolar Holding Co., Ltd. |
| Sector: Technology | |
| SubSector: Semiconductor - Specialized | |
| MarketCap: 629.36 Millions | |
| Recent Price: 26.18 Smart Investing & Trading Score: 74 | |
| Day Percent Change: 2.55% Day Change: 0.65 | |
| Week Change: 8.45% Year-to-date Change: -29.1% | |
| JKS Links: Profile News Message Board | |
| Charts:- Daily , Weekly | |
| Add JKS to Watchlist: View: Get Complete JKS Trend Analysis ➞ | |
 | OCFT OneConnect Financial Technology Co., Ltd. |
| Sector: Technology | |
| SubSector: Software Application | |
| MarketCap: 80387 Millions | |
| Recent Price: 2.42 Smart Investing & Trading Score: 74 | |
| Day Percent Change: 12.04% Day Change: 0.26 | |
| Week Change: 21% Year-to-date Change: -23.2% | |
| OCFT Links: Profile News Message Board | |
| Charts:- Daily , Weekly | |
| Add OCFT to Watchlist: View: Get Complete OCFT Trend Analysis ➞ | |
 | MLCO Melco Resorts & Entertainment Limited |
| Sector: Services & Goods | |
| SubSector: Resorts & Casinos | |
| MarketCap: 7031.14 Millions | |
| Recent Price: 7.24 Smart Investing & Trading Score: 74 | |
| Day Percent Change: 1.26% Day Change: 0.09 | |
| Week Change: 14.2% Year-to-date Change: -18.4% | |
| MLCO Links: Profile News Message Board | |
| Charts:- Daily , Weekly | |
| Add MLCO to Watchlist: View: Get Complete MLCO Trend Analysis ➞ | |
 | XPEV XPeng Inc. |
| Sector: Services & Goods | |
| SubSector: Auto Manufacturers | |
| MarketCap: 32917 Millions | |
| Recent Price: 9.06 Smart Investing & Trading Score: 74 | |
| Day Percent Change: -3.62% Day Change: -0.34 | |
| Week Change: 15.56% Year-to-date Change: -37.9% | |
| XPEV Links: Profile News Message Board | |
| Charts:- Daily , Weekly | |
| Add XPEV to Watchlist: View: Get Complete XPEV Trend Analysis ➞ | |
 | NIO NIO Limited |
| Sector: Consumer Staples | |
| SubSector: Auto Manufacturers - Major | |
| MarketCap: 2679.71 Millions | |
| Recent Price: 5.57 Smart Investing & Trading Score: 74 | |
| Day Percent Change: -0.36% Day Change: -0.02 | |
| Week Change: 24.05% Year-to-date Change: -38.6% | |
| NIO Links: Profile News Message Board | |
| Charts:- Daily , Weekly | |
| Add NIO to Watchlist: View: Get Complete NIO Trend Analysis ➞ | |
 | YQ 17 Education & Technology Group Inc. |
| Sector: Consumer Staples | |
| SubSector: Education & Training Services | |
| MarketCap: 32347 Millions | |
| Recent Price: 2.83 Smart Investing & Trading Score: 73 | |
| Day Percent Change: -0.70% Day Change: -0.02 | |
| Week Change: -2.08% Year-to-date Change: 38.7% | |
| YQ Links: Profile News Message Board | |
| Charts:- Daily , Weekly | |
| Add YQ to Watchlist: View: Get Complete YQ Trend Analysis ➞ | |
 | YSG Yatsen Holding Limited |
| Sector: Services & Goods | |
| SubSector: Specialty Retail | |
| MarketCap: 11827 Millions | |
| Recent Price: 4.34 Smart Investing & Trading Score: 71 | |
| Day Percent Change: 3.09% Day Change: 0.13 | |
| Week Change: -10.33% Year-to-date Change: 493.2% | |
| YSG Links: Profile News Message Board | |
| Charts:- Daily , Weekly | |
| Add YSG to Watchlist: View: Get Complete YSG Trend Analysis ➞ | |
 | SY So-Young International Inc. |
| Sector: Technology | |
| SubSector: Healthcare Information Services | |
| MarketCap: 1000.55 Millions | |
| Recent Price: 1.29 Smart Investing & Trading Score: 71 | |
| Day Percent Change: 0.00% Day Change: 0.00 | |
| Week Change: 2.79% Year-to-date Change: 0.0% | |
| SY Links: Profile News Message Board | |
| Charts:- Daily , Weekly | |
| Add SY to Watchlist: View: Get Complete SY Trend Analysis ➞ | |
 | VIOT Viomi Technology Co., Ltd |
| Sector: Technology | |
| SubSector: Electronic Equipment | |
| MarketCap: 357.2 Millions | |
| Recent Price: 0.67 Smart Investing & Trading Score: 70 | |
| Day Percent Change: -3.51% Day Change: -0.02 | |
| Week Change: 10.41% Year-to-date Change: -32.7% | |
| VIOT Links: Profile News Message Board | |
| Charts:- Daily , Weekly | |
| Add VIOT to Watchlist: View: Get Complete VIOT Trend Analysis ➞ | |
 | NTES NetEase, Inc. |
| Sector: Technology | |
| SubSector: Internet Software & Services | |
| MarketCap: 40105.1 Millions | |
| Recent Price: 103.02 Smart Investing & Trading Score: 69 | |
| Day Percent Change: 4.11% Day Change: 4.07 | |
| Week Change: 7.32% Year-to-date Change: 10.6% | |
| NTES Links: Profile News Message Board | |
| Charts:- Daily , Weekly | |
| Add NTES to Watchlist: View: Get Complete NTES Trend Analysis ➞ | |
 | TUYA Tuya Inc. |
| Sector: Technology | |
| SubSector: Software - Infrastructure | |
| MarketCap: 1050 Millions | |
| Recent Price: 1.82 Smart Investing & Trading Score: 69 | |
| Day Percent Change: 1.96% Day Change: 0.04 | |
| Week Change: 4.6% Year-to-date Change: -20.7% | |
| TUYA Links: Profile News Message Board | |
| Charts:- Daily , Weekly | |
| Add TUYA to Watchlist: View: Get Complete TUYA Trend Analysis ➞ | |
 | MOMO Momo Inc. |
| Sector: Technology | |
| SubSector: Internet Software & Services | |
| MarketCap: 4796.71 Millions | |
| Recent Price: 6.19 Smart Investing & Trading Score: 69 | |
| Day Percent Change: 0.98% Day Change: 0.06 | |
| Week Change: 6.17% Year-to-date Change: -10.9% | |
| MOMO Links: Profile News Message Board | |
| Charts:- Daily , Weekly | |
| Add MOMO to Watchlist: View: Get Complete MOMO Trend Analysis ➞ | |
 | BGNE BeiGene, Ltd. |
| Sector: Health Care | |
| SubSector: Biotechnology | |
| MarketCap: 10838.5 Millions | |
| Recent Price: 162.25 Smart Investing & Trading Score: 69 | |
| Day Percent Change: 0.15% Day Change: 0.24 | |
| Week Change: 5.65% Year-to-date Change: -10.0% | |
| BGNE Links: Profile News Message Board | |
| Charts:- Daily , Weekly | |
| Add BGNE to Watchlist: View: Get Complete BGNE Trend Analysis ➞ | |
 | UCL uCloudlink Group Inc. |
| Sector: Technology | |
| SubSector: Telecom Services | |
| MarketCap: 35837 Millions | |
| Recent Price: 1.52 Smart Investing & Trading Score: 68 | |
| Day Percent Change: 0.00% Day Change: 0.00 | |
| Week Change: 11.31% Year-to-date Change: -17.6% | |
| UCL Links: Profile News Message Board | |
| Charts:- Daily , Weekly | |
| Add UCL to Watchlist: View: Get Complete UCL Trend Analysis ➞ | |
 | BEST BEST Inc. |
| Sector: Consumer Staples | |
| SubSector: Packaging & Containers | |
| MarketCap: 1981.73 Millions | |
| Recent Price: 2.13 Smart Investing & Trading Score: 68 | |
| Day Percent Change: 0.00% Day Change: 0.00 | |
| Week Change: 0.95% Year-to-date Change: -16.5% | |
| BEST Links: Profile News Message Board | |
| Charts:- Daily , Weekly | |
| Add BEST to Watchlist: View: Get Complete BEST Trend Analysis ➞ | |
 | TOUR Tuniu Corporation |
| Sector: Consumer Staples | |
| SubSector: Recreational Goods, Other | |
| MarketCap: 124.459 Millions | |
| Recent Price: 0.92 Smart Investing & Trading Score: 68 | |
| Day Percent Change: -1.11% Day Change: -0.01 | |
| Week Change: 9.08% Year-to-date Change: 37.8% | |
| TOUR Links: Profile News Message Board | |
| Charts:- Daily , Weekly | |
| Add TOUR to Watchlist: View: Get Complete TOUR Trend Analysis ➞ | |
 | UTSI UTStarcom Holdings Corp. |
| Sector: Technology | |
| SubSector: Communication Equipment | |
| MarketCap: 76.6539 Millions | |
| Recent Price: 2.79 Smart Investing & Trading Score: 67 | |
| Day Percent Change: 3.72% Day Change: 0.10 | |
| Week Change: 1.45% Year-to-date Change: -18.9% | |
| UTSI Links: Profile News Message Board | |
| Charts:- Daily , Weekly | |
| Add UTSI to Watchlist: View: Get Complete UTSI Trend Analysis ➞ | |
 | UXIN Uxin Limited |
| Sector: Technology | |
| SubSector: Internet Information Providers | |
| MarketCap: 414.58 Millions | |
| Recent Price: 2.02 Smart Investing & Trading Score: 64 | |
| Day Percent Change: 4.12% Day Change: 0.08 | |
| Week Change: 10.99% Year-to-date Change: 188.2% | |
| UXIN Links: Profile News Message Board | |
| Charts:- Daily , Weekly | |
| Add UXIN to Watchlist: View: Get Complete UXIN Trend Analysis ➞ | |
 | TAL TAL Education Group |
| Sector: Services & Goods | |
| SubSector: Education & Training Services | |
| MarketCap: 30103.1 Millions | |
| Recent Price: 13.18 Smart Investing & Trading Score: 64 | |
| Day Percent Change: 2.97% Day Change: 0.38 | |
| Week Change: -1.72% Year-to-date Change: 4.4% | |
| TAL Links: Profile News Message Board | |
| Charts:- Daily , Weekly | |
| Add TAL to Watchlist: View: Get Complete TAL Trend Analysis ➞ | |
 | VIPS Vipshop Holdings Limited |
| Sector: Services & Goods | |
| SubSector: Catalog & Mail Order Houses | |
| MarketCap: 10496.2 Millions | |
| Recent Price: 16.45 Smart Investing & Trading Score: 64 | |
| Day Percent Change: 2.43% Day Change: 0.39 | |
| Week Change: 4.58% Year-to-date Change: -7.4% | |
| VIPS Links: Profile News Message Board | |
| Charts:- Daily , Weekly | |
| Add VIPS to Watchlist: View: Get Complete VIPS Trend Analysis ➞ | |
 | LX LexinFintech Holdings Ltd. |
| Sector: Financials | |
| SubSector: Credit Services | |
| MarketCap: 1674.18 Millions | |
| Recent Price: 1.82 Smart Investing & Trading Score: 64 | |
| Day Percent Change: 2.25% Day Change: 0.04 | |
| Week Change: 6.43% Year-to-date Change: -1.1% | |
| LX Links: Profile News Message Board | |
| Charts:- Daily , Weekly | |
| Add LX to Watchlist: View: Get Complete LX Trend Analysis ➞ | |
 | APM Aptorum Group Limited |
| Sector: Health Care | |
| SubSector: Biotechnology | |
| MarketCap: 88.7785 Millions | |
| Recent Price: 5.59 Smart Investing & Trading Score: 63 | |
| Day Percent Change: 3.33% Day Change: 0.18 | |
| Week Change: 5.87% Year-to-date Change: 128.3% | |
| APM Links: Profile News Message Board | |
| Charts:- Daily , Weekly | |
| Add APM to Watchlist: View: Get Complete APM Trend Analysis ➞ | |
| For tabular summary view of above stock list: Summary View ➞ 0 - 25 , 25 - 50 , 50 - 75 , 75 - 100 , 100 - 125 , 125 - 150 | ||
| Click To Change The Sort Order: By Market Cap or Company Size Performance: Year-to-date, Week and Day | |
| Select Chart Type: | ||
|
Best Stocks Today 12Stocks.com |
© 2024 12Stocks.com Terms & Conditions Privacy Contact Us
All Information Provided Only For Education And Not To Be Used For Investing or Trading. See Terms & Conditions


One More Thing ... Get Best Stocks Delivered Daily!
Never Ever Miss A Move With Our Top Ten Stocks Lists
Find Best Stocks In Any Market - Bull or Bear Market
Take A Peek At Our Top Ten Stocks Lists: Daily, Weekly, Year-to-Date & Top Trends
Find Best Stocks In Any Market - Bull or Bear Market
Take A Peek At Our Top Ten Stocks Lists: Daily, Weekly, Year-to-Date & Top Trends
China Stocks With Best Up Trends [0-bearish to 100-bullish]: SunCar [100], Hesai [100], Trip.com [100], Noah [100], Weibo [100], KE [100], Tencent Music[100], Huazhu [100], ATRenew [100], Xunlei [100], Autohome [100]
Best China Stocks Year-to-Date:
U Power[3264.96%], DouYu [854.74%], MicroCloud Hologram[553.24%], China Liberal[515.21%], Yatsen Holding[493.22%], Zhongchao [338.24%], Uxin [188.16%], GigaCloud [97.11%], QuantaSing [95.06%], Cheetah Mobile[74.12%], Smart Share[68.93%] Best China Stocks This Week:
Smart Share[40.05%], Dingdong (Cayman)[24.6%], NIO [24.05%], OneConnect Financial[21%], 21Vianet [20.89%], KE [17.8%], U Power[17.77%], Hesai [17.05%], Lixiang Education[16.68%], AMTD Digital[16.36%], XPeng [15.56%] Best China Stocks Daily:
OneConnect Financial[12.04%], U Power[9.44%], SunCar [9.43%], AMTD Digital[8.33%], Burning Rock[6.51%], Dingdong (Cayman)[5.72%], Studio City[5.54%], Lixiang Education[5.14%], Hesai [5.10%], Intchains [4.99%], New Oriental[4.77%]