
 Login Sign Up


| |||||
 |  | ||||

| 12Stocks.com Market Intelligence |
Best China Stocks
|
On this page, you will find the most comprehensive analysis of Chinese stocks and ETFs - from latest trends to performances to charts ➞. First, here are the year-to-date (YTD) performances of the most requested China stocks at 12Stocks.com (click stock for review):
| Sohu.com 20% | ||
| New Oriental 16% | ||
| JD.com 14% | ||
| NetEase 11% | ||
| Alibaba 5% | ||
| Baidu -5% | ||
| Vipshop -7% | ||
| Weibo -12% | ||
| JOYY -15% | ||
| In a hurry? China Stocks Lists: Performance Trends Table, Stock Charts
Sort China stocks: Daily, Weekly, Year-to-Date, Market Cap & Trends. Filter China stocks list by sector: Show all, Tech, Finance, Energy, Staples, Retail, Industrial, Materials, Utilities and HealthCare Filter China stocks list by size: All China Large Medium Small and MicroCap |
| May 4, 2024 - 12Stocks.com China Stocks Performances & Trends Daily | |||||||||
|
|  The overall Smart Investing & Trading Score is 100 (0-bearish to 100-bullish) which puts China index in short term bullish trend. The Smart Investing & Trading Score from previous trading session is 83 and an improvement of trend continues.
| ||||||||
| Here are the Smart Investing & Trading Scores of the most requested China stocks at 12Stocks.com (click stock name for detailed review): |

| 12Stocks.com: Top Performing China Index Stocks | ||||||||||||||||||||||||||||||||||||||||||||||||
 The top performing China Index stocks year to date are
Now, more recently, over last week, the top performing China Index stocks on the move are


|
||||||||||||||||||||||||||||||||||||||||||||||||
| 12Stocks.com: Investing in China Index with Stocks | |
|
The following table helps investors and traders sort through current performance and trends (as measured by Smart Investing & Trading Score) of various
stocks in the China Index. Quick View: Move mouse or cursor over stock symbol (ticker) to view short-term technical chart and over stock name to view long term chart. Click on  to add stock symbol to your watchlist and to add stock symbol to your watchlist and  to view watchlist. Click on any ticker or stock name for detailed market intelligence report for that stock. to view watchlist. Click on any ticker or stock name for detailed market intelligence report for that stock. |
12Stocks.com Performance of Stocks in China Index
| Ticker | Stock Name | Watchlist | Category | Recent Price | Smart Investing & Trading Score | Change % | YTD Change% |
| SDA | SunCar |   | Services & Goods | 8.30 | 100 | 9.43% | 6.82% |
| HSAI | Hesai | | Services & Goods | 5.15 | 100 | 5.10% | -43.28% |
| TCOM | Trip.com | | Services & Goods | 53.30 | 100 | 4.63% | 48.01% |
| NOAH | Noah | | Financials | 13.66 | 100 | 4.35% | -1.09% |
| WB | | Technology | 9.67 | 100 | 4.09% | -11.69% | |
| BEKE | KE | | Financials | 17.47 | 100 | 3.74% | 7.77% |
| TME | Tencent Music | | Technology | 13.50 | 100 | 3.45% | 49.83% |
| HTHT | Huazhu | | Services & Goods | 40.98 | 100 | 3.12% | 22.55% |
| RERE | ATRenew | | Services & Goods | 2.15 | 100 | 1.89% | 14.02% |
| XNET | Xunlei | | Technology | 1.65 | 100 | 1.85% | 1.85% |
| ATHM | Autohome | | Technology | 26.90 | 100 | 1.74% | -4.13% |
| SOHU | Sohu.com | | Technology | 11.96 | 100 | 1.61% | 20.44% |
| BIDU | Baidu | | Technology | 113.41 | 100 | 1.49% | -4.77% |
| BZ | Kanzhun | | Industrials | 20.40 | 100 | 1.47% | 23.42% |
| BABA | Alibaba | | Services & Goods | 81.33 | 100 | 1.24% | 4.93% |
| BILI | Bilibili | | Technology | 14.83 | 100 | 0.75% | 21.86% |
| JD | JD.com | | Technology | 32.87 | 100 | 0.70% | 13.78% |
| EM | Smart Share | | Services & Goods | 0.87 | 100 | 0.12% | 68.93% |
| DADA | Dada Nexus | | Services & Goods | 2.16 | 100 | 0.00% | -34.94% |
| VNET | 21Vianet | | Technology | 1.91 | 100 | 0.00% | -33.45% |
| MNSO | MINISO | | Services & Goods | 24.02 | 100 | -0.74% | 17.75% |
| UCAR | U Power | | Services & Goods | 6.03 | 95 | 9.44% | NA |
| DDL | Dingdong (Cayman) | | Consumer Staples | 1.57 | 95 | 5.72% | 3.29% |
| RLX | RLX | | Consumer Staples | 2.05 | 95 | 4.59% | 3.54% |
| PDD | Pinduoduo | | Services & Goods | 140.18 | 95 | 1.92% | -4.19% |
| For chart view version of above stock list: Chart View ➞ 0 - 25 , 25 - 50 , 50 - 75 , 75 - 100 , 100 - 125 , 125 - 150 | ||
 | Click To Change The Sort Order: By Market Cap or Company Size Performance: Year-to-date, Week and Day |  |
|
Get the most comprehensive stock market coverage daily at 12Stocks.com ➞ Best Stocks Today ➞ Best Stocks Weekly ➞ Best Stocks Year-to-Date ➞ Best Stocks Trends ➞  Best Stocks Today 12Stocks.com Best Nasdaq Stocks ➞ Best S&P 500 Stocks ➞ Best Tech Stocks ➞ Best Biotech Stocks ➞ |
| Detailed Overview of China Stocks |
| China Technical Overview, Leaders & Laggards, Top China ETF Funds & Detailed China Stocks List, Charts, Trends & More |
| China: Technical Analysis, Trends & YTD Performance | |
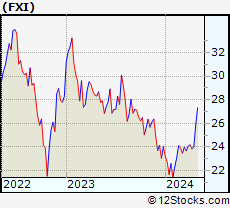
 FXI Weekly Chart |
|
| Long Term Trend: Very Good | |
| Medium Term Trend: Very Good | |
 FXI Daily Chart |
|
| Short Term Trend: Very Good | |
| Overall Trend Score: 100 | |
| YTD Performance: 13.73% | |
| **Trend Scores & Views Are Only For Educational Purposes And Not For Investing | |
| 12Stocks.com: Investing in China Index using Exchange Traded Funds | |
|
The following table shows list of key exchange traded funds (ETF) that
help investors play China stock market. For detailed view, check out our ETF Funds section of our website. Quick View: Move mouse or cursor over ETF symbol (ticker) to view short-term technical chart and over ETF name to view long term chart. Click on ticker or stock name for detailed view. Click on to add stock symbol to your watchlist and to view watchlist. |
12Stocks.com List of ETFs that track China Index
| Ticker | ETF Name | Watchlist | Recent Price | Smart Investing & Trading Score | Change % | Week % | Year-to-date % |
| FXI | China Large-Cap | | 27.33 | 100 | 0.66 | 5.64 | 13.73% |
| EWH | Hong Kong | | 16.90 | 100 | 0.66 | 5.76 | -2.71% |
| YINN | China Bull 3X | | 27.05 | 100 | 2.50 | 16.54 | 29.18% |
| YANG | China Bear 3X | | 7.73 | 0 | -2.77 | -17.24 | -39.61% |
| XPP | China 50 | | 16.65 | 100 | 1.71 | 10.78 | 21.13% |
| MCHI | China | | 44.77 | 100 | 0.67 | 5.71 | 9.89% |
| GXC | China | | 73.06 | 100 | 0.45 | 5.21 | 7.25% |
| CBON | ChinaAMC China Bond | | 22.00 | 59 | 0.11 | 0.76 | -0.43% |
| 12Stocks.com: Charts, Trends, Fundamental Data and Performances of China Stocks | |
|
We now take in-depth look at all China stocks including charts, multi-period performances and overall trends (as measured by Smart Investing & Trading Score). One can sort China stocks (click link to choose) by Daily, Weekly and by Year-to-Date performances. Also, one can sort by size of the company or by market capitalization. |
| Select Your Default Chart Type: | |||||
| |||||
| Click on stock symbol or name for detailed view. Click on to add stock symbol to your watchlist and to view watchlist. Quick View: Move mouse or cursor over "Daily" to quickly view daily technical stock chart and over "Weekly" to view weekly technical stock chart. | |||||

 | SDA SunCar Technology Group Inc. |
| Sector: Services & Goods | |
| SubSector: Auto & Truck Dealerships | |
| MarketCap: 2680 Millions | |
| Recent Price: 8.30 Smart Investing & Trading Score: 100 | |
| Day Percent Change: 9.43% Day Change: 0.72 | |
| Week Change: 14.33% Year-to-date Change: 6.8% | |
| SDA Links: Profile News Message Board | |
| Charts:- Daily , Weekly | |
| Add SDA to Watchlist: View: Get Complete SDA Trend Analysis ➞ | |
 | HSAI Hesai Group |
| Sector: Services & Goods | |
| SubSector: Auto Parts | |
| MarketCap: 1330 Millions | |
| Recent Price: 5.15 Smart Investing & Trading Score: 100 | |
| Day Percent Change: 5.10% Day Change: 0.25 | |
| Week Change: 17.05% Year-to-date Change: -43.3% | |
| HSAI Links: Profile News Message Board | |
| Charts:- Daily , Weekly | |
| Add HSAI to Watchlist: View: Get Complete HSAI Trend Analysis ➞ | |
 | TCOM Trip.com Group Limited |
| Sector: Services & Goods | |
| SubSector: Lodging | |
| MarketCap: 13449.6 Millions | |
| Recent Price: 53.30 Smart Investing & Trading Score: 100 | |
| Day Percent Change: 4.63% Day Change: 2.36 | |
| Week Change: 5.34% Year-to-date Change: 48.0% | |
| TCOM Links: Profile News Message Board | |
| Charts:- Daily , Weekly | |
| Add TCOM to Watchlist: View: Get Complete TCOM Trend Analysis ➞ | |
 | NOAH Noah Holdings Limited |
| Sector: Financials | |
| SubSector: Asset Management | |
| MarketCap: 1495.33 Millions | |
| Recent Price: 13.66 Smart Investing & Trading Score: 100 | |
| Day Percent Change: 4.35% Day Change: 0.57 | |
| Week Change: 7.39% Year-to-date Change: -1.1% | |
| NOAH Links: Profile News Message Board | |
| Charts:- Daily , Weekly | |
| Add NOAH to Watchlist: View: Get Complete NOAH Trend Analysis ➞ | |
 | WB Weibo Corporation |
| Sector: Technology | |
| SubSector: Internet Information Providers | |
| MarketCap: 8164.6 Millions | |
| Recent Price: 9.67 Smart Investing & Trading Score: 100 | |
| Day Percent Change: 4.09% Day Change: 0.38 | |
| Week Change: 9.89% Year-to-date Change: -11.7% | |
| WB Links: Profile News Message Board | |
| Charts:- Daily , Weekly | |
| Add WB to Watchlist: View: Get Complete WB Trend Analysis ➞ | |
 | BEKE KE Holdings Inc. |
| Sector: Financials | |
| SubSector: Real Estate Services | |
| MarketCap: 80167 Millions | |
| Recent Price: 17.47 Smart Investing & Trading Score: 100 | |
| Day Percent Change: 3.74% Day Change: 0.63 | |
| Week Change: 17.8% Year-to-date Change: 7.8% | |
| BEKE Links: Profile News Message Board | |
| Charts:- Daily , Weekly | |
| Add BEKE to Watchlist: View: Get Complete BEKE Trend Analysis ➞ | |
 | TME Tencent Music Entertainment Group |
| Sector: Technology | |
| SubSector: Internet Information Providers | |
| MarketCap: 16195 Millions | |
| Recent Price: 13.50 Smart Investing & Trading Score: 100 | |
| Day Percent Change: 3.45% Day Change: 0.45 | |
| Week Change: 4.81% Year-to-date Change: 49.8% | |
| TME Links: Profile News Message Board | |
| Charts:- Daily , Weekly | |
| Add TME to Watchlist: View: Get Complete TME Trend Analysis ➞ | |
 | HTHT Huazhu Group Limited |
| Sector: Services & Goods | |
| SubSector: Lodging | |
| MarketCap: 9164.46 Millions | |
| Recent Price: 40.98 Smart Investing & Trading Score: 100 | |
| Day Percent Change: 3.12% Day Change: 1.24 | |
| Week Change: 2.3% Year-to-date Change: 22.6% | |
| HTHT Links: Profile News Message Board | |
| Charts:- Daily , Weekly | |
| Add HTHT to Watchlist: View: Get Complete HTHT Trend Analysis ➞ | |
 | RERE ATRenew Inc. |
| Sector: Services & Goods | |
| SubSector: Internet Retail | |
| MarketCap: 672 Millions | |
| Recent Price: 2.15 Smart Investing & Trading Score: 100 | |
| Day Percent Change: 1.89% Day Change: 0.04 | |
| Week Change: 8.84% Year-to-date Change: 14.0% | |
| RERE Links: Profile News Message Board | |
| Charts:- Daily , Weekly | |
| Add RERE to Watchlist: View: Get Complete RERE Trend Analysis ➞ | |
 | XNET Xunlei Limited |
| Sector: Technology | |
| SubSector: Application Software | |
| MarketCap: 203.662 Millions | |
| Recent Price: 1.65 Smart Investing & Trading Score: 100 | |
| Day Percent Change: 1.85% Day Change: 0.03 | |
| Week Change: 5.43% Year-to-date Change: 1.9% | |
| XNET Links: Profile News Message Board | |
| Charts:- Daily , Weekly | |
| Add XNET to Watchlist: View: Get Complete XNET Trend Analysis ➞ | |
 | ATHM Autohome Inc. |
| Sector: Technology | |
| SubSector: Internet Information Providers | |
| MarketCap: 7984.2 Millions | |
| Recent Price: 26.90 Smart Investing & Trading Score: 100 | |
| Day Percent Change: 1.74% Day Change: 0.46 | |
| Week Change: 3.46% Year-to-date Change: -4.1% | |
| ATHM Links: Profile News Message Board | |
| Charts:- Daily , Weekly | |
| Add ATHM to Watchlist: View: Get Complete ATHM Trend Analysis ➞ | |
 | SOHU Sohu.com Limited |
| Sector: Technology | |
| SubSector: Internet Information Providers | |
| MarketCap: 243.48 Millions | |
| Recent Price: 11.96 Smart Investing & Trading Score: 100 | |
| Day Percent Change: 1.61% Day Change: 0.19 | |
| Week Change: 4.64% Year-to-date Change: 20.4% | |
| SOHU Links: Profile News Message Board | |
| Charts:- Daily , Weekly | |
| Add SOHU to Watchlist: View: Get Complete SOHU Trend Analysis ➞ | |
 | BIDU Baidu, Inc. |
| Sector: Technology | |
| SubSector: Internet Information Providers | |
| MarketCap: 33525.9 Millions | |
| Recent Price: 113.41 Smart Investing & Trading Score: 100 | |
| Day Percent Change: 1.49% Day Change: 1.66 | |
| Week Change: 12.82% Year-to-date Change: -4.8% | |
| BIDU Links: Profile News Message Board | |
| Charts:- Daily , Weekly | |
| Add BIDU to Watchlist: View: Get Complete BIDU Trend Analysis ➞ | |
 | BZ Kanzhun Limited |
| Sector: Industrials | |
| SubSector: Staffing & Employment Services | |
| MarketCap: 6680 Millions | |
| Recent Price: 20.40 Smart Investing & Trading Score: 100 | |
| Day Percent Change: 1.47% Day Change: 0.29 | |
| Week Change: 1.47% Year-to-date Change: 23.4% | |
| BZ Links: Profile News Message Board | |
| Charts:- Daily , Weekly | |
| Add BZ to Watchlist: View: Get Complete BZ Trend Analysis ➞ | |
 | BABA Alibaba Group Holding Limited |
| Sector: Services & Goods | |
| SubSector: Specialty Retail, Other | |
| MarketCap: 522666 Millions | |
| Recent Price: 81.33 Smart Investing & Trading Score: 100 | |
| Day Percent Change: 1.24% Day Change: 1.00 | |
| Week Change: 7.65% Year-to-date Change: 4.9% | |
| BABA Links: Profile News Message Board | |
| Charts:- Daily , Weekly | |
| Add BABA to Watchlist: View: Get Complete BABA Trend Analysis ➞ | |
 | BILI Bilibili Inc. |
| Sector: Technology | |
| SubSector: Internet Information Providers | |
| MarketCap: 7043.1 Millions | |
| Recent Price: 14.83 Smart Investing & Trading Score: 100 | |
| Day Percent Change: 0.75% Day Change: 0.11 | |
| Week Change: 13.03% Year-to-date Change: 21.9% | |
| BILI Links: Profile News Message Board | |
| Charts:- Daily , Weekly | |
| Add BILI to Watchlist: View: Get Complete BILI Trend Analysis ➞ | |
 | JD JD.com, Inc. |
| Sector: Technology | |
| SubSector: Internet Information Providers | |
| MarketCap: 59907.3 Millions | |
| Recent Price: 32.87 Smart Investing & Trading Score: 100 | |
| Day Percent Change: 0.70% Day Change: 0.23 | |
| Week Change: 8.34% Year-to-date Change: 13.8% | |
| JD Links: Profile News Message Board | |
| Charts:- Daily , Weekly | |
| Add JD to Watchlist: View: Get Complete JD Trend Analysis ➞ | |
 | EM Smart Share Global Limited |
| Sector: Services & Goods | |
| SubSector: Personal Services | |
| MarketCap: 238 Millions | |
| Recent Price: 0.87 Smart Investing & Trading Score: 100 | |
| Day Percent Change: 0.12% Day Change: 0.00 | |
| Week Change: 40.05% Year-to-date Change: 68.9% | |
| EM Links: Profile News Message Board | |
| Charts:- Daily , Weekly | |
| Add EM to Watchlist: View: Get Complete EM Trend Analysis ➞ | |
 | DADA Dada Nexus Limited |
| Sector: Services & Goods | |
| SubSector: Internet Retail | |
| MarketCap: 98527 Millions | |
| Recent Price: 2.16 Smart Investing & Trading Score: 100 | |
| Day Percent Change: 0.00% Day Change: 0.00 | |
| Week Change: 7.46% Year-to-date Change: -34.9% | |
| DADA Links: Profile News Message Board | |
| Charts:- Daily , Weekly | |
| Add DADA to Watchlist: View: Get Complete DADA Trend Analysis ➞ | |
 | VNET 21Vianet Group, Inc. |
| Sector: Technology | |
| SubSector: Information Technology Services | |
| MarketCap: 1846.98 Millions | |
| Recent Price: 1.91 Smart Investing & Trading Score: 100 | |
| Day Percent Change: 0.00% Day Change: 0.00 | |
| Week Change: 20.89% Year-to-date Change: -33.5% | |
| VNET Links: Profile News Message Board | |
| Charts:- Daily , Weekly | |
| Add VNET to Watchlist: View: Get Complete VNET Trend Analysis ➞ | |
 | MNSO MINISO Group Holding Limited |
| Sector: Services & Goods | |
| SubSector: Specialty Retail | |
| MarketCap: 69427 Millions | |
| Recent Price: 24.02 Smart Investing & Trading Score: 100 | |
| Day Percent Change: -0.74% Day Change: -0.18 | |
| Week Change: 1.65% Year-to-date Change: 17.8% | |
| MNSO Links: Profile News Message Board | |
| Charts:- Daily , Weekly | |
| Add MNSO to Watchlist: View: Get Complete MNSO Trend Analysis ➞ | |
 | UCAR U Power Limited |
| Sector: Services & Goods | |
| SubSector: Auto & Truck Dealerships | |
| MarketCap: 372 Millions | |
| Recent Price: 6.03 Smart Investing & Trading Score: 95 | |
| Day Percent Change: 9.44% Day Change: 0.52 | |
| Week Change: 17.77% Year-to-date Change: 3,265.0% | |
| UCAR Links: Profile News Message Board | |
| Charts:- Daily , Weekly | |
| Add UCAR to Watchlist: View: Get Complete UCAR Trend Analysis ➞ | |
 | DDL Dingdong (Cayman) Limited |
| Sector: Consumer Staples | |
| SubSector: Grocery Stores | |
| MarketCap: 708 Millions | |
| Recent Price: 1.57 Smart Investing & Trading Score: 95 | |
| Day Percent Change: 5.72% Day Change: 0.08 | |
| Week Change: 24.6% Year-to-date Change: 3.3% | |
| DDL Links: Profile News Message Board | |
| Charts:- Daily , Weekly | |
| Add DDL to Watchlist: View: Get Complete DDL Trend Analysis ➞ | |
 | RLX RLX Technology Inc. |
| Sector: Consumer Staples | |
| SubSector: Tobacco | |
| MarketCap: 2800 Millions | |
| Recent Price: 2.05 Smart Investing & Trading Score: 95 | |
| Day Percent Change: 4.59% Day Change: 0.09 | |
| Week Change: 7.33% Year-to-date Change: 3.5% | |
| RLX Links: Profile News Message Board | |
| Charts:- Daily , Weekly | |
| Add RLX to Watchlist: View: Get Complete RLX Trend Analysis ➞ | |
 | PDD Pinduoduo Inc. |
| Sector: Services & Goods | |
| SubSector: Specialty Retail, Other | |
| MarketCap: 41696.2 Millions | |
| Recent Price: 140.18 Smart Investing & Trading Score: 95 | |
| Day Percent Change: 1.92% Day Change: 2.64 | |
| Week Change: 8.41% Year-to-date Change: -4.2% | |
| PDD Links: Profile News Message Board | |
| Charts:- Daily , Weekly | |
| Add PDD to Watchlist: View: Get Complete PDD Trend Analysis ➞ | |
| For tabular summary view of above stock list: Summary View ➞ 0 - 25 , 25 - 50 , 50 - 75 , 75 - 100 , 100 - 125 , 125 - 150 | ||
| Click To Change The Sort Order: By Market Cap or Company Size Performance: Year-to-date, Week and Day | |
| Select Chart Type: | ||
|
Best Stocks Today 12Stocks.com |
© 2024 12Stocks.com Terms & Conditions Privacy Contact Us
All Information Provided Only For Education And Not To Be Used For Investing or Trading. See Terms & Conditions


One More Thing ... Get Best Stocks Delivered Daily!
Never Ever Miss A Move With Our Top Ten Stocks Lists
Find Best Stocks In Any Market - Bull or Bear Market
Take A Peek At Our Top Ten Stocks Lists: Daily, Weekly, Year-to-Date & Top Trends
Find Best Stocks In Any Market - Bull or Bear Market
Take A Peek At Our Top Ten Stocks Lists: Daily, Weekly, Year-to-Date & Top Trends
China Stocks With Best Up Trends [0-bearish to 100-bullish]: SunCar [100], Hesai [100], Trip.com [100], Noah [100], Weibo [100], KE [100], Tencent Music[100], Huazhu [100], ATRenew [100], Xunlei [100], Autohome [100]
Best China Stocks Year-to-Date:
U Power[3264.96%], DouYu [854.74%], MicroCloud Hologram[553.24%], China Liberal[515.21%], Yatsen Holding[493.22%], Zhongchao [338.24%], Uxin [188.16%], GigaCloud [97.11%], QuantaSing [95.06%], Cheetah Mobile[74.12%], Smart Share[68.93%] Best China Stocks This Week:
Smart Share[40.05%], Dingdong (Cayman)[24.6%], NIO [24.05%], OneConnect Financial[21%], 21Vianet [20.89%], KE [17.8%], U Power[17.77%], Hesai [17.05%], Lixiang Education[16.68%], AMTD Digital[16.36%], XPeng [15.56%] Best China Stocks Daily:
OneConnect Financial[12.04%], U Power[9.44%], SunCar [9.43%], AMTD Digital[8.33%], Burning Rock[6.51%], Dingdong (Cayman)[5.72%], Studio City[5.54%], Lixiang Education[5.14%], Hesai [5.10%], Intchains [4.99%], New Oriental[4.77%]