
 Login Sign Up


| |||||
 |  | ||||

| 12Stocks.com Market Intelligence |
Best China Stocks
|
On this page, you will find the most comprehensive analysis of Chinese stocks and ETFs - from latest trends to performances to charts ➞. First, here are the year-to-date (YTD) performances of the most requested China stocks at 12Stocks.com (click stock for review):
| Sohu.com 15% | ||
| New Oriental 14% | ||
| JD.com 5% | ||
| NetEase 3% | ||
| Alibaba -3% | ||
| Vipshop -11% | ||
| Baidu -16% | ||
| JOYY -16% | ||
| Weibo -20% | ||
| In a hurry? China Stocks Lists: Performance Trends Table, Stock Charts
Sort China stocks: Daily, Weekly, Year-to-Date, Market Cap & Trends. Filter China stocks list by sector: Show all, Tech, Finance, Energy, Staples, Retail, Industrial, Materials, Utilities and HealthCare Filter China stocks list by size: All China Large Medium Small and MicroCap |
| April 27, 2024 - 12Stocks.com China Stocks Performances & Trends Daily | |||||||||
|
|  The overall Smart Investing & Trading Score is 100 (0-bearish to 100-bullish) which puts China index in short term bullish trend. The Smart Investing & Trading Score from previous trading session is 74 and an improvement of trend continues.
| ||||||||
| Here are the Smart Investing & Trading Scores of the most requested China stocks at 12Stocks.com (click stock name for detailed review): |


| 12Stocks.com: Top Performing China Index Stocks | ||||||||||||||||||||||||||||||||||||||||||||||||
 The top performing China Index stocks year to date are
Now, more recently, over last week, the top performing China Index stocks on the move are


|
||||||||||||||||||||||||||||||||||||||||||||||||
| 12Stocks.com: Investing in China Index with Stocks | |
|
The following table helps investors and traders sort through current performance and trends (as measured by Smart Investing & Trading Score) of various
stocks in the China Index. Quick View: Move mouse or cursor over stock symbol (ticker) to view short-term technical chart and over stock name to view long term chart. Click on  to add stock symbol to your watchlist and to add stock symbol to your watchlist and  to view watchlist. Click on any ticker or stock name for detailed market intelligence report for that stock. to view watchlist. Click on any ticker or stock name for detailed market intelligence report for that stock. |
12Stocks.com Performance of Stocks in China Index
| Ticker | Stock Name | Watchlist | Category | Recent Price | Smart Investing & Trading Score | Change % | YTD Change% |
| IMAB | I Mab |   | Health Care | 1.80 | 41 | -0.28 | -5.26% |
| TOP | TOP Financial | | Financials | 2.67 | 59 | -0.37 | -28.23% |
| HUYA | HUYA | | Services & Goods | 4.38 | 41 | -0.68 | 19.67% |
| CMCM | Cheetah Mobile | | Technology | 4.26 | 88 | -0.70 | 86.84% |
| BEDU | Bright Scholar | | Services & Goods | 1.94 | 46 | -0.77 | 54.80% |
| EDTK | Skillful Craftsman | | Consumer Staples | 0.95 | 32 | -1.05 | -24.61% |
| LANV | Lanvin | | Services & Goods | 1.58 | 62 | -1.25 | -48.37% |
| FENG | Phoenix New | | Technology | 1.75 | 46 | -1.69 | 28.68% |
| STG | Sunlands | | Services & Goods | 7.96 | 17 | -1.79 | -21.78% |
| QFIN | 360 Finance | | Financials | 18.52 | 53 | -1.83 | 17.07% |
| DAO | Youdao | | Technology | 3.52 | 41 | -1.95 | -10.66% |
| IH | iHuman | | Consumer Staples | 1.74 | 35 | -2.25 | -42.95% |
| GCT | GigaCloud | | Technology | 35.35 | 66 | -2.27 | 93.06% |
| DUO | Fangdd Network | | Financials | 0.40 | 17 | -2.30 | -40.62% |
| YI | 111 | | Services & Goods | 1.02 | 35 | -2.38 | -33.87% |
| CLEU | China Liberal | | Consumer Staples | 1.08 | 54 | -2.70 | 504.03% |
| PT | Pintec | | Technology | 1.08 | 27 | -2.70 | -2.70% |
| KNDI | Kandi | | Consumer Staples | 2.61 | 64 | -2.97 | -6.79% |
| FANH | Fanhua | | Financials | 3.42 | 35 | -3.12 | -48.57% |
| AIH | Aesthetic Medical | | Health Care | 0.43 | 47 | -3.13 | -37.63% |
| UCAR | U Power | | Services & Goods | 5.12 | 93 | -3.21 | NA |
| ICG | Intchains | | Technology | 8.74 | 93 | -3.39 | -28.94% |
| JG | Aurora Mobile | | Technology | 3.01 | 32 | -4.14 | 5.54% |
| MOGU | MOGU | | Services & Goods | 1.85 | 93 | -4.15 | -3.14% |
| HCM | Hutchison China | | Health Care | 18.16 | 78 | -4.37 | 0.28% |
| For chart view version of above stock list: Chart View ➞ 0 - 25 , 25 - 50 , 50 - 75 , 75 - 100 , 100 - 125 , 125 - 150 | ||
 | Click To Change The Sort Order: By Market Cap or Company Size Performance: Year-to-date, Week and Day |  |
|
Get the most comprehensive stock market coverage daily at 12Stocks.com ➞ Best Stocks Today ➞ Best Stocks Weekly ➞ Best Stocks Year-to-Date ➞ Best Stocks Trends ➞  Best Stocks Today 12Stocks.com Best Nasdaq Stocks ➞ Best S&P 500 Stocks ➞ Best Tech Stocks ➞ Best Biotech Stocks ➞ |
| Detailed Overview of China Stocks |
| China Technical Overview, Leaders & Laggards, Top China ETF Funds & Detailed China Stocks List, Charts, Trends & More |
| China: Technical Analysis, Trends & YTD Performance | |
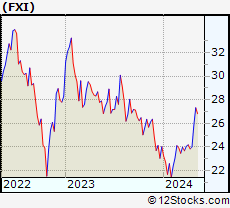
 FXI Weekly Chart |
|
| Long Term Trend: Very Good | |
| Medium Term Trend: Very Good | |
 FXI Daily Chart |
|
| Short Term Trend: Very Good | |
| Overall Trend Score: 100 | |
| YTD Performance: 7.66% | |
| **Trend Scores & Views Are Only For Educational Purposes And Not For Investing | |
| 12Stocks.com: Investing in China Index using Exchange Traded Funds | |
|
The following table shows list of key exchange traded funds (ETF) that
help investors play China stock market. For detailed view, check out our ETF Funds section of our website. Quick View: Move mouse or cursor over ETF symbol (ticker) to view short-term technical chart and over ETF name to view long term chart. Click on ticker or stock name for detailed view. Click on to add stock symbol to your watchlist and to view watchlist. |
12Stocks.com List of ETFs that track China Index
| Ticker | ETF Name | Watchlist | Recent Price | Smart Investing & Trading Score | Change % | Week % | Year-to-date % |
| FXI | China Large-Cap | | 25.87 | 100 | 1.69 | 7.75 | 7.66% |
| EWH | Hong Kong | | 15.98 | 100 | 1.72 | 8.71 | -8% |
| YINN | China Bull 3X | | 23.21 | 100 | 5.07 | 23.65 | 10.84% |
| YANG | China Bear 3X | | 9.34 | 0 | -4.98 | -19.97 | -27.03% |
| XPP | China 50 | | 15.03 | 100 | 4.01 | 15.91 | 9.35% |
| MCHI | China | | 42.35 | 100 | 1.93 | 7.46 | 3.95% |
| GXC | China | | 69.44 | 100 | 1.82 | 6.29 | 1.94% |
| CBON | ChinaAMC China Bond | | 21.84 | 41 | -0.23 | -0.39 | -1.17% |
| 12Stocks.com: Charts, Trends, Fundamental Data and Performances of China Stocks | |
|
We now take in-depth look at all China stocks including charts, multi-period performances and overall trends (as measured by Smart Investing & Trading Score). One can sort China stocks (click link to choose) by Daily, Weekly and by Year-to-Date performances. Also, one can sort by size of the company or by market capitalization. |
| Select Your Default Chart Type: | |||||
| |||||
| Click on stock symbol or name for detailed view. Click on to add stock symbol to your watchlist and to view watchlist. Quick View: Move mouse or cursor over "Daily" to quickly view daily technical stock chart and over "Weekly" to view weekly technical stock chart. | |||||

 | IMAB I Mab |
| Sector: Health Care | |
| SubSector: Biotechnology | |
| MarketCap: 26187 Millions | |
| Recent Price: 1.80 Smart Investing & Trading Score: 41 | |
| Day Percent Change: -0.28% Day Change: 0.00 | |
| Week Change: -0.55% Year-to-date Change: -5.3% | |
| IMAB Links: Profile News Message Board | |
| Charts:- Daily , Weekly | |
| Add IMAB to Watchlist: View: Get Complete IMAB Trend Analysis ➞ | |
 | TOP TOP Financial Group Limited |
| Sector: Financials | |
| SubSector: Capital Markets | |
| MarketCap: 329 Millions | |
| Recent Price: 2.67 Smart Investing & Trading Score: 59 | |
| Day Percent Change: -0.37% Day Change: -0.01 | |
| Week Change: 13.62% Year-to-date Change: -28.2% | |
| TOP Links: Profile News Message Board | |
| Charts:- Daily , Weekly | |
| Add TOP to Watchlist: View: Get Complete TOP Trend Analysis ➞ | |
 | HUYA HUYA Inc. |
| Sector: Services & Goods | |
| SubSector: Entertainment - Diversified | |
| MarketCap: 3358.17 Millions | |
| Recent Price: 4.38 Smart Investing & Trading Score: 41 | |
| Day Percent Change: -0.68% Day Change: -0.03 | |
| Week Change: -0.68% Year-to-date Change: 19.7% | |
| HUYA Links: Profile News Message Board | |
| Charts:- Daily , Weekly | |
| Add HUYA to Watchlist: View: Get Complete HUYA Trend Analysis ➞ | |
 | CMCM Cheetah Mobile Inc. |
| Sector: Technology | |
| SubSector: Application Software | |
| MarketCap: 343.362 Millions | |
| Recent Price: 4.26 Smart Investing & Trading Score: 88 | |
| Day Percent Change: -0.70% Day Change: -0.03 | |
| Week Change: 20.34% Year-to-date Change: 86.8% | |
| CMCM Links: Profile News Message Board | |
| Charts:- Daily , Weekly | |
| Add CMCM to Watchlist: View: Get Complete CMCM Trend Analysis ➞ | |
 | BEDU Bright Scholar Education Holdings Limited |
| Sector: Services & Goods | |
| SubSector: Education & Training Services | |
| MarketCap: 792.406 Millions | |
| Recent Price: 1.94 Smart Investing & Trading Score: 46 | |
| Day Percent Change: -0.77% Day Change: -0.01 | |
| Week Change: -3.73% Year-to-date Change: 54.8% | |
| BEDU Links: Profile News Message Board | |
| Charts:- Daily , Weekly | |
| Add BEDU to Watchlist: View: Get Complete BEDU Trend Analysis ➞ | |
 | EDTK Skillful Craftsman Education Technology Limited |
| Sector: Consumer Staples | |
| SubSector: Education & Training Services | |
| MarketCap: 32347 Millions | |
| Recent Price: 0.95 Smart Investing & Trading Score: 32 | |
| Day Percent Change: -1.05% Day Change: -0.01 | |
| Week Change: 3.81% Year-to-date Change: -24.6% | |
| EDTK Links: Profile News Message Board | |
| Charts:- Daily , Weekly | |
| Add EDTK to Watchlist: View: Get Complete EDTK Trend Analysis ➞ | |
 | LANV Lanvin Group Holdings Limited |
| Sector: Services & Goods | |
| SubSector: Luxury Goods | |
| MarketCap: 712 Millions | |
| Recent Price: 1.58 Smart Investing & Trading Score: 62 | |
| Day Percent Change: -1.25% Day Change: -0.02 | |
| Week Change: -0.63% Year-to-date Change: -48.4% | |
| LANV Links: Profile News Message Board | |
| Charts:- Daily , Weekly | |
| Add LANV to Watchlist: View: Get Complete LANV Trend Analysis ➞ | |
 | FENG Phoenix New Media Limited |
| Sector: Technology | |
| SubSector: Internet Information Providers | |
| MarketCap: 107.08 Millions | |
| Recent Price: 1.75 Smart Investing & Trading Score: 46 | |
| Day Percent Change: -1.69% Day Change: -0.03 | |
| Week Change: -3.85% Year-to-date Change: 28.7% | |
| FENG Links: Profile News Message Board | |
| Charts:- Daily , Weekly | |
| Add FENG to Watchlist: View: Get Complete FENG Trend Analysis ➞ | |
 | STG Sunlands Technology Group |
| Sector: Services & Goods | |
| SubSector: Education & Training Services | |
| MarketCap: 295.706 Millions | |
| Recent Price: 7.96 Smart Investing & Trading Score: 17 | |
| Day Percent Change: -1.79% Day Change: -0.14 | |
| Week Change: -2.57% Year-to-date Change: -21.8% | |
| STG Links: Profile News Message Board | |
| Charts:- Daily , Weekly | |
| Add STG to Watchlist: View: Get Complete STG Trend Analysis ➞ | |
 | QFIN 360 Finance, Inc. |
| Sector: Financials | |
| SubSector: Credit Services | |
| MarketCap: 956.208 Millions | |
| Recent Price: 18.52 Smart Investing & Trading Score: 53 | |
| Day Percent Change: -1.83% Day Change: -0.34 | |
| Week Change: 2.89% Year-to-date Change: 17.1% | |
| QFIN Links: Profile News Message Board | |
| Charts:- Daily , Weekly | |
| Add QFIN to Watchlist: View: Get Complete QFIN Trend Analysis ➞ | |
 | DAO Youdao, Inc. |
| Sector: Technology | |
| SubSector: Internet Information Providers | |
| MarketCap: 2073.2 Millions | |
| Recent Price: 3.52 Smart Investing & Trading Score: 41 | |
| Day Percent Change: -1.95% Day Change: -0.07 | |
| Week Change: -0.85% Year-to-date Change: -10.7% | |
| DAO Links: Profile News Message Board | |
| Charts:- Daily , Weekly | |
| Add DAO to Watchlist: View: Get Complete DAO Trend Analysis ➞ | |
 | IH iHuman Inc. |
| Sector: Consumer Staples | |
| SubSector: Education & Training Services | |
| MarketCap: 12247 Millions | |
| Recent Price: 1.74 Smart Investing & Trading Score: 35 | |
| Day Percent Change: -2.25% Day Change: -0.04 | |
| Week Change: 0.46% Year-to-date Change: -43.0% | |
| IH Links: Profile News Message Board | |
| Charts:- Daily , Weekly | |
| Add IH to Watchlist: View: Get Complete IH Trend Analysis ➞ | |
 | GCT GigaCloud Technology Inc. |
| Sector: Technology | |
| SubSector: Software - Infrastructure | |
| MarketCap: 240 Millions | |
| Recent Price: 35.35 Smart Investing & Trading Score: 66 | |
| Day Percent Change: -2.27% Day Change: -0.82 | |
| Week Change: 1.9% Year-to-date Change: 93.1% | |
| GCT Links: Profile News Message Board | |
| Charts:- Daily , Weekly | |
| Add GCT to Watchlist: View: Get Complete GCT Trend Analysis ➞ | |
 | DUO Fangdd Network Group Ltd. |
| Sector: Financials | |
| SubSector: Property Management | |
| MarketCap: 783.142 Millions | |
| Recent Price: 0.40 Smart Investing & Trading Score: 17 | |
| Day Percent Change: -2.30% Day Change: -0.01 | |
| Week Change: 2.46% Year-to-date Change: -40.6% | |
| DUO Links: Profile News Message Board | |
| Charts:- Daily , Weekly | |
| Add DUO to Watchlist: View: Get Complete DUO Trend Analysis ➞ | |
 | YI 111, Inc. |
| Sector: Services & Goods | |
| SubSector: Drug Stores | |
| MarketCap: 520.351 Millions | |
| Recent Price: 1.02 Smart Investing & Trading Score: 35 | |
| Day Percent Change: -2.38% Day Change: -0.03 | |
| Week Change: 0.49% Year-to-date Change: -33.9% | |
| YI Links: Profile News Message Board | |
| Charts:- Daily , Weekly | |
| Add YI to Watchlist: View: Get Complete YI Trend Analysis ➞ | |
 | CLEU China Liberal Education Holdings Limited |
| Sector: Consumer Staples | |
| SubSector: Education & Training Services | |
| MarketCap: 32347 Millions | |
| Recent Price: 1.08 Smart Investing & Trading Score: 54 | |
| Day Percent Change: -2.70% Day Change: -0.03 | |
| Week Change: 4.77% Year-to-date Change: 504.0% | |
| CLEU Links: Profile News Message Board | |
| Charts:- Daily , Weekly | |
| Add CLEU to Watchlist: View: Get Complete CLEU Trend Analysis ➞ | |
 | PT Pintec Technology Holdings Limited |
| Sector: Technology | |
| SubSector: Wireless Communications | |
| MarketCap: 87.7827 Millions | |
| Recent Price: 1.08 Smart Investing & Trading Score: 27 | |
| Day Percent Change: -2.70% Day Change: -0.03 | |
| Week Change: 0.93% Year-to-date Change: -2.7% | |
| PT Links: Profile News Message Board | |
| Charts:- Daily , Weekly | |
| Add PT to Watchlist: View: Get Complete PT Trend Analysis ➞ | |
 | KNDI Kandi Technologies Group, Inc. |
| Sector: Consumer Staples | |
| SubSector: Auto Manufacturers - Major | |
| MarketCap: 137.471 Millions | |
| Recent Price: 2.61 Smart Investing & Trading Score: 64 | |
| Day Percent Change: -2.97% Day Change: -0.08 | |
| Week Change: 2.35% Year-to-date Change: -6.8% | |
| KNDI Links: Profile News Message Board | |
| Charts:- Daily , Weekly | |
| Add KNDI to Watchlist: View: Get Complete KNDI Trend Analysis ➞ | |
 | FANH Fanhua Inc. |
| Sector: Financials | |
| SubSector: Insurance Brokers | |
| MarketCap: 1436.67 Millions | |
| Recent Price: 3.42 Smart Investing & Trading Score: 35 | |
| Day Percent Change: -3.12% Day Change: -0.11 | |
| Week Change: -2.29% Year-to-date Change: -48.6% | |
| FANH Links: Profile News Message Board | |
| Charts:- Daily , Weekly | |
| Add FANH to Watchlist: View: Get Complete FANH Trend Analysis ➞ | |
 | AIH Aesthetic Medical International Holdings Group Limited |
| Sector: Health Care | |
| SubSector: Specialized Health Services | |
| MarketCap: 205.356 Millions | |
| Recent Price: 0.43 Smart Investing & Trading Score: 47 | |
| Day Percent Change: -3.13% Day Change: -0.01 | |
| Week Change: 14.08% Year-to-date Change: -37.6% | |
| AIH Links: Profile News Message Board | |
| Charts:- Daily , Weekly | |
| Add AIH to Watchlist: View: Get Complete AIH Trend Analysis ➞ | |
 | UCAR U Power Limited |
| Sector: Services & Goods | |
| SubSector: Auto & Truck Dealerships | |
| MarketCap: 372 Millions | |
| Recent Price: 5.12 Smart Investing & Trading Score: 93 | |
| Day Percent Change: -3.21% Day Change: -0.17 | |
| Week Change: -0.39% Year-to-date Change: 2,757.1% | |
| UCAR Links: Profile News Message Board | |
| Charts:- Daily , Weekly | |
| Add UCAR to Watchlist: View: Get Complete UCAR Trend Analysis ➞ | |
 | ICG Intchains Group Limited |
| Sector: Technology | |
| SubSector: Semiconductors | |
| MarketCap: 450 Millions | |
| Recent Price: 8.74 Smart Investing & Trading Score: 93 | |
| Day Percent Change: -3.39% Day Change: -0.31 | |
| Week Change: 5.3% Year-to-date Change: -28.9% | |
| ICG Links: Profile News Message Board | |
| Charts:- Daily , Weekly | |
| Add ICG to Watchlist: View: Get Complete ICG Trend Analysis ➞ | |
 | JG Aurora Mobile Limited |
| Sector: Technology | |
| SubSector: Application Software | |
| MarketCap: 268.762 Millions | |
| Recent Price: 3.01 Smart Investing & Trading Score: 32 | |
| Day Percent Change: -4.14% Day Change: -0.13 | |
| Week Change: 3.08% Year-to-date Change: 5.5% | |
| JG Links: Profile News Message Board | |
| Charts:- Daily , Weekly | |
| Add JG to Watchlist: View: Get Complete JG Trend Analysis ➞ | |
 | MOGU MOGU Inc. |
| Sector: Services & Goods | |
| SubSector: Specialty Retail, Other | |
| MarketCap: 168.844 Millions | |
| Recent Price: 1.85 Smart Investing & Trading Score: 93 | |
| Day Percent Change: -4.15% Day Change: -0.08 | |
| Week Change: -7.04% Year-to-date Change: -3.1% | |
| MOGU Links: Profile News Message Board | |
| Charts:- Daily , Weekly | |
| Add MOGU to Watchlist: View: Get Complete MOGU Trend Analysis ➞ | |
 | HCM Hutchison China MediTech Limited |
| Sector: Health Care | |
| SubSector: Drug Manufacturers - Major | |
| MarketCap: 2324.43 Millions | |
| Recent Price: 18.16 Smart Investing & Trading Score: 78 | |
| Day Percent Change: -4.37% Day Change: -0.83 | |
| Week Change: 10.13% Year-to-date Change: 0.3% | |
| HCM Links: Profile News Message Board | |
| Charts:- Daily , Weekly | |
| Add HCM to Watchlist: View: Get Complete HCM Trend Analysis ➞ | |
| For tabular summary view of above stock list: Summary View ➞ 0 - 25 , 25 - 50 , 50 - 75 , 75 - 100 , 100 - 125 , 125 - 150 | ||
| Click To Change The Sort Order: By Market Cap or Company Size Performance: Year-to-date, Week and Day | |
| Select Chart Type: | ||
|
Best Stocks Today 12Stocks.com |
© 2024 12Stocks.com Terms & Conditions Privacy Contact Us
All Information Provided Only For Education And Not To Be Used For Investing or Trading. See Terms & Conditions


One More Thing ... Get Best Stocks Delivered Daily!
Never Ever Miss A Move With Our Top Ten Stocks Lists
Find Best Stocks In Any Market - Bull or Bear Market
Take A Peek At Our Top Ten Stocks Lists: Daily, Weekly, Year-to-Date & Top Trends
Find Best Stocks In Any Market - Bull or Bear Market
Take A Peek At Our Top Ten Stocks Lists: Daily, Weekly, Year-to-Date & Top Trends
China Stocks With Best Up Trends [0-bearish to 100-bullish]: Yatsen Holding[100], WiMi Hologram[100], MINISO [100], JD.com [100], Full Truck[100], Kanzhun [100], ZTO Express[100], Alibaba [100], Dada Nexus[100], Kingsoft Cloud[95], KE [95]
Best China Stocks Year-to-Date:
U Power[2757.14%], DouYu [803.16%], MicroCloud Hologram[619.42%], Yatsen Holding[561.56%], China Liberal[504.03%], Zhongchao [362.89%], Uxin [159.63%], QuantaSing [111.73%], GigaCloud [93.06%], Cheetah Mobile[86.84%], Yiren Digital[62.82%] Best China Stocks This Week:
WiMi Hologram[46.22%], Yatsen Holding[33.89%], ATRenew [25.32%], GDS [22.78%], iQIYI [22.15%], Golden Heaven[20.89%], Cheetah Mobile[20.34%], Bilibili [20.26%], JD.com [18.93%], BeiGene [18.58%], Kingsoft Cloud[18.57%] Best China Stocks Daily:
ATRenew [22.98%], Huize Holding[18.27%], Zhongchao [12.29%], XPeng [11.60%], Niu [10.78%], Kingsoft Cloud[9.91%], Yatsen Holding[9.75%], WiMi Hologram[9.51%], OneConnect Financial[9.35%], NIO [8.72%], KE [8.17%]