
 Login Sign Up


| |||||
 |  | ||||

| 12Stocks.com Market Intelligence |
Best China Stocks
|
On this page, you will find the most comprehensive analysis of Chinese stocks and ETFs - from latest trends to performances to charts ➞. First, here are the year-to-date (YTD) performances of the most requested China stocks at 12Stocks.com (click stock for review):
| Alibaba 41% | ||
| NetEase 34% | ||
| Weibo 32% | ||
| Vipshop 31% | ||
| Sohu.com 18% | ||
| Baidu 6% | ||
| JD.com -20% | ||
| New Oriental -26% | ||
| In a hurry? China Stocks Lists: Performance Trends Table, Stock Charts
Sort China stocks: Daily, Weekly, Year-to-Date, Market Cap & Trends. Filter China stocks list by sector: Show all, Tech, Finance, Energy, Staples, Retail, Industrial, Materials, Utilities and HealthCare Filter China stocks list by size: All China Large Medium Small and MicroCap |
| September 3, 2025 - 12Stocks.com China Stocks Performances & Trends Daily | |||||||||
|
|  The overall Smart Investing & Trading Score is 100 (0-bearish to 100-bullish) which puts China index in short term bullish trend. The Smart Investing & Trading Score from previous trading session is 90 and hence an improvement of trend.
| ||||||||
Here are the Smart Investing & Trading Scores of the most requested China stocks at 12Stocks.com (click stock name for detailed review):
|


| 12Stocks.com: Top Performing China Index Stocks | |||||||||||||||||||||||||||||||||||||||||||||||
 The top performing China Index stocks year to date are
Now, more recently, over last week, the top performing China Index stocks on the move are


|
|||||||||||||||||||||||||||||||||||||||||||||||
| 12Stocks.com: Investing in China Index with Stocks | |
|
The following table helps investors and traders sort through current performance and trends (as measured by Smart Investing & Trading Score) of various
stocks in the China Index. Quick View: Move mouse or cursor over stock symbol (ticker) to view short-term technical chart and over stock name to view long term chart. Click on  to add stock symbol to your watchlist and to add stock symbol to your watchlist and  to view watchlist. Click on any ticker or stock name for detailed market intelligence report for that stock. to view watchlist. Click on any ticker or stock name for detailed market intelligence report for that stock. |
12Stocks.com Performance of Stocks in China Index
| Ticker | Stock Name | Watchlist | Category | Recent Price | Smart Investing & Trading Score | Change % | YTD Change% |
| HCM | Hutchison China |   | Health Care | 15.01 | 60 | 1.45% | 11.80% |
| ZH | Zhihu | | Services & Goods | 4.80 | 60 | 1.43% | 40.11% |
| GHG | GreenTree Hospitality | | Services & Goods | 2.10 | 60 | 0.00% | -16.80% |
| KRKR | 36Kr | | Technology | 4.90 | 60 | -5.33% | 35.24% |
| SFWL | Shengfeng Development | | Industrials | 1.13 | 59 | 2.94% | -3.73% |
| ATAT | Atour Lifestyle | | Services & Goods | 38.92 | 51 | 1.56% | 30.01% |
| GDHG | Golden Heaven | | Services & Goods | 8.11 | 51 | -5.67% | -99.40% |
| PT | Pintec | | Technology | 0.95 | 50 | 6.40% | 10.19% |
| EDTK | Skillful Craftsman | | Consumer Staples | 1.14 | 50 | 2.97% | 2.97% |
| RERE | ATRenew | | Services & Goods | 4.72 | 50 | 1.97% | 61.46% |
| JD | JD.com | | Technology | 31.58 | 50 | 1.64% | -20.21% |
| ZLAB | Zai Lab | | Health Care | 33.10 | 50 | 1.46% | 29.78% |
| ZCMD | Zhongchao | | Health Care | 1.00 | 50 | 1.38% | -44.38% |
| LI | Li Auto | | Services & Goods | 23.35 | 50 | -0.17% | -2.21% |
| THCH | TH | | Services & Goods | 2.54 | 50 | -4.25% | -30.14% |
| LANV | Lanvin | | Services & Goods | 2.09 | 50 | -5.02% | 3.48% |
| QSG | QuantaSing | | Consumer Staples | 8.11 | 46 | 3.90% | 269.91% |
| ICG | Intchains | | Technology | 1.90 | 46 | -2.00% | -40.61% |
| AIXI | Xiao-I | | Technology | 1.59 | 43 | 1.47% | -74.85% |
| TOP | TOP Financial | | Financials | 1.16 | 43 | 0.91% | -23.53% |
| APM | Aptorum | | Health Care | 1.97 | 40 | 234.65% | 51.79% |
| XPEV | XPeng | | Services & Goods | 21.02 | 40 | 11.68% | 92.47% |
| BNR | Burning Rock | | Health Care | 8.69 | 40 | 6.02% | 46.07% |
| IMAB | I Mab | | Health Care | 4.16 | 40 | 4.20% | 454.12% |
| NIU | Niu | | Consumer Staples | 4.37 | 40 | 2.42% | 159.78% |
| For chart view version of above stock list: Chart View ➞ 0 - 25 , 25 - 50 , 50 - 75 , 75 - 100 , 100 - 125 | ||
 | Click To Change The Sort Order: By Market Cap or Company Size Performance: Year-to-date, Week and Day |  |
|
Get the most comprehensive stock market coverage daily at 12Stocks.com ➞ Best Stocks Today ➞ Best Stocks Weekly ➞ Best Stocks Year-to-Date ➞ Best Stocks Trends ➞  Best Stocks Today 12Stocks.com Best Nasdaq Stocks ➞ Best S&P 500 Stocks ➞ Best Tech Stocks ➞ Best Biotech Stocks ➞ |
| Detailed Overview of China Stocks |
| China Technical Overview, Leaders & Laggards, Top China ETF Funds & Detailed China Stocks List, Charts, Trends & More |
| China: Technical Analysis, Trends & YTD Performance | |
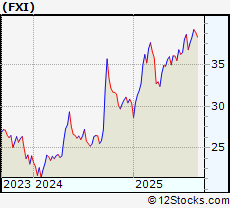
 FXI Weekly Chart |
|
| Long Term Trend: Very Good | |
| Medium Term Trend: Very Good | |
 FXI Daily Chart |
|
| Short Term Trend: Very Good | |
| Overall Trend Score: 100 | |
| YTD Performance: 23.11% | |
| **Trend Scores & Views Are Only For Educational Purposes And Not For Investing | |
| 12Stocks.com: Investing in China Index using Exchange Traded Funds | |
|
The following table shows list of key exchange traded funds (ETF) that
help investors play China stock market. For detailed view, check out our ETF Funds section of our website. Quick View: Move mouse or cursor over ETF symbol (ticker) to view short-term technical chart and over ETF name to view long term chart. Click on ticker or stock name for detailed view. Click on to add stock symbol to your watchlist and to view watchlist. |
12Stocks.com List of ETFs that track China Index
| Ticker | ETF Name | Watchlist | Recent Price | Smart Investing & Trading Score | Change % | Week % | Year-to-date % |
| FXI | China Large-Cap | | 39.26 | 100 | 0.9 | 0.9 | 23.11% |
| EWH | Hong Kong | | 21.16 | 60 | 1.46 | 1.37 | 33% |
| HAO | China Small Cap | | 1.17 | 30 | 3.42 | 1.68 | -51.6% |
| YINN | China Bull 3X | | 46.80 | 90 | 6.42 | 6.3 | 55.38% |
| YANG | China Bear 3X | | 25.72 | 20 | 0.49 | -0.15 | -60.96% |
| XPP | China 50 | | 27.62 | 90 | 4.34 | 4.3 | 42.61% |
| MCHI | China | | 61.31 | 100 | 0.13 | 1.18 | 29.31% |
| GXC | China | | 98.55 | 100 | 0.22 | 1.96 | 26.85% |
| CBON | ChinaAMC China Bond | | 22.51 | 90 | 0.02 | -0.22 | 1.79% |
| 12Stocks.com: Charts, Trends, Fundamental Data and Performances of China Stocks | |
|
We now take in-depth look at all China stocks including charts, multi-period performances and overall trends (as measured by Smart Investing & Trading Score). One can sort China stocks (click link to choose) by Daily, Weekly and by Year-to-Date performances. Also, one can sort by size of the company or by market capitalization. |
| Select Your Default Chart Type: | |||||
| |||||
| Click on stock symbol or name for detailed view. Click on to add stock symbol to your watchlist and to view watchlist. Quick View: Move mouse or cursor over "Daily" to quickly view daily technical stock chart and over "Weekly" to view weekly technical stock chart. | |||||

 | HCM Hutchison China MediTech Limited |
| Sector: Health Care | |
| SubSector: Drug Manufacturers - Major | |
| MarketCap: 2324.43 Millions | |
| Recent Price: 15.01 Smart Investing & Trading Score: 60 | |
| Day Percent Change: 1.45% Day Change: 0.23 | |
| Week Change: 1.51% Year-to-date Change: 11.8% | |
| HCM Links: Profile News Message Board | |
| Charts:- Daily , Weekly | |
| Add HCM to Watchlist: View: Get Complete HCM Trend Analysis ➞ | |
 | ZH Zhihu Inc. |
| Sector: Services & Goods | |
| SubSector: Internet Content & Information | |
| MarketCap: 741 Millions | |
| Recent Price: 4.80 Smart Investing & Trading Score: 60 | |
| Day Percent Change: 1.43% Day Change: 0.07 | |
| Week Change: 18.1% Year-to-date Change: 40.1% | |
| ZH Links: Profile News Message Board | |
| Charts:- Daily , Weekly | |
| Add ZH to Watchlist: View: Get Complete ZH Trend Analysis ➞ | |
 | GHG GreenTree Hospitality Group Ltd. |
| Sector: Services & Goods | |
| SubSector: Lodging | |
| MarketCap: 1195.36 Millions | |
| Recent Price: 2.10 Smart Investing & Trading Score: 60 | |
| Day Percent Change: 0% Day Change: 0 | |
| Week Change: -4.05% Year-to-date Change: -16.8% | |
| GHG Links: Profile News Message Board | |
| Charts:- Daily , Weekly | |
| Add GHG to Watchlist: View: Get Complete GHG Trend Analysis ➞ | |
 | KRKR 36Kr Holdings Inc. |
| Sector: Technology | |
| SubSector: Internet Information Providers | |
| MarketCap: 173.18 Millions | |
| Recent Price: 4.90 Smart Investing & Trading Score: 60 | |
| Day Percent Change: -5.33% Day Change: -0.24 | |
| Week Change: -13.59% Year-to-date Change: 35.2% | |
| KRKR Links: Profile News Message Board | |
| Charts:- Daily , Weekly | |
| Add KRKR to Watchlist: View: Get Complete KRKR Trend Analysis ➞ | |
 | SFWL Shengfeng Development Limited |
| Sector: Industrials | |
| SubSector: Integrated Freight & Logistics | |
| MarketCap: 747 Millions | |
| Recent Price: 1.13 Smart Investing & Trading Score: 59 | |
| Day Percent Change: 2.94% Day Change: 0.03 | |
| Week Change: 0.94% Year-to-date Change: -3.7% | |
| SFWL Links: Profile News Message Board | |
| Charts:- Daily , Weekly | |
| Add SFWL to Watchlist: View: Get Complete SFWL Trend Analysis ➞ | |
 | ATAT Atour Lifestyle Holdings Limited |
| Sector: Services & Goods | |
| SubSector: Lodging | |
| MarketCap: 2120 Millions | |
| Recent Price: 38.92 Smart Investing & Trading Score: 51 | |
| Day Percent Change: 1.56% Day Change: 0.53 | |
| Week Change: 0.03% Year-to-date Change: 30.0% | |
| ATAT Links: Profile News Message Board | |
| Charts:- Daily , Weekly | |
| Add ATAT to Watchlist: View: Get Complete ATAT Trend Analysis ➞ | |
 | GDHG Golden Heaven Group Holdings Ltd. |
| Sector: Services & Goods | |
| SubSector: Leisure | |
| MarketCap: 230 Millions | |
| Recent Price: 8.11 Smart Investing & Trading Score: 51 | |
| Day Percent Change: -5.67% Day Change: -0.02 | |
| Week Change: -19.69% Year-to-date Change: -99.4% | |
| GDHG Links: Profile News Message Board | |
| Charts:- Daily , Weekly | |
| Add GDHG to Watchlist: View: Get Complete GDHG Trend Analysis ➞ | |
 | PT Pintec Technology Holdings Limited |
| Sector: Technology | |
| SubSector: Wireless Communications | |
| MarketCap: 87.7827 Millions | |
| Recent Price: 0.95 Smart Investing & Trading Score: 50 | |
| Day Percent Change: 6.4% Day Change: 0.06 | |
| Week Change: 7.53% Year-to-date Change: 10.2% | |
| PT Links: Profile News Message Board | |
| Charts:- Daily , Weekly | |
| Add PT to Watchlist: View: Get Complete PT Trend Analysis ➞ | |
 | EDTK Skillful Craftsman Education Technology Limited |
| Sector: Consumer Staples | |
| SubSector: Education & Training Services | |
| MarketCap: 32347 Millions | |
| Recent Price: 1.14 Smart Investing & Trading Score: 50 | |
| Day Percent Change: 2.97% Day Change: 0.03 | |
| Week Change: 0.97% Year-to-date Change: 3.0% | |
| EDTK Links: Profile News Message Board | |
| Charts:- Daily , Weekly | |
| Add EDTK to Watchlist: View: Get Complete EDTK Trend Analysis ➞ | |
 | RERE ATRenew Inc. |
| Sector: Services & Goods | |
| SubSector: Internet Retail | |
| MarketCap: 672 Millions | |
| Recent Price: 4.72 Smart Investing & Trading Score: 50 | |
| Day Percent Change: 1.97% Day Change: 0.09 | |
| Week Change: 9.67% Year-to-date Change: 61.5% | |
| RERE Links: Profile News Message Board | |
| Charts:- Daily , Weekly | |
| Add RERE to Watchlist: View: Get Complete RERE Trend Analysis ➞ | |
 | JD JD.com, Inc. |
| Sector: Technology | |
| SubSector: Internet Information Providers | |
| MarketCap: 59907.3 Millions | |
| Recent Price: 31.58 Smart Investing & Trading Score: 50 | |
| Day Percent Change: 1.64% Day Change: 0.51 | |
| Week Change: 1.64% Year-to-date Change: -20.2% | |
| JD Links: Profile News Message Board | |
| Charts:- Daily , Weekly | |
| Add JD to Watchlist: View: Get Complete JD Trend Analysis ➞ | |
 | ZLAB Zai Lab Limited |
| Sector: Health Care | |
| SubSector: Biotechnology | |
| MarketCap: 3970.35 Millions | |
| Recent Price: 33.10 Smart Investing & Trading Score: 50 | |
| Day Percent Change: 1.46% Day Change: 0.49 | |
| Week Change: -2.69% Year-to-date Change: 29.8% | |
| ZLAB Links: Profile News Message Board | |
| Charts:- Daily , Weekly | |
| Add ZLAB to Watchlist: View: Get Complete ZLAB Trend Analysis ➞ | |
 | ZCMD Zhongchao Inc. |
| Sector: Health Care | |
| SubSector: Health Information Services | |
| MarketCap: 41487 Millions | |
| Recent Price: 1.00 Smart Investing & Trading Score: 50 | |
| Day Percent Change: 1.38% Day Change: 0.01 | |
| Week Change: -7.11% Year-to-date Change: -44.4% | |
| ZCMD Links: Profile News Message Board | |
| Charts:- Daily , Weekly | |
| Add ZCMD to Watchlist: View: Get Complete ZCMD Trend Analysis ➞ | |
 | LI Li Auto Inc. |
| Sector: Services & Goods | |
| SubSector: Auto Manufacturers | |
| MarketCap: 29167 Millions | |
| Recent Price: 23.35 Smart Investing & Trading Score: 50 | |
| Day Percent Change: -0.17% Day Change: -0.04 | |
| Week Change: -1.22% Year-to-date Change: -2.2% | |
| LI Links: Profile News Message Board | |
| Charts:- Daily , Weekly | |
| Add LI to Watchlist: View: Get Complete LI Trend Analysis ➞ | |
 | THCH TH International Limited |
| Sector: Services & Goods | |
| SubSector: Restaurants | |
| MarketCap: 452 Millions | |
| Recent Price: 2.54 Smart Investing & Trading Score: 50 | |
| Day Percent Change: -4.25% Day Change: -0.11 | |
| Week Change: -4.06% Year-to-date Change: -30.1% | |
| THCH Links: Profile News Message Board | |
| Charts:- Daily , Weekly | |
| Add THCH to Watchlist: View: Get Complete THCH Trend Analysis ➞ | |
 | LANV Lanvin Group Holdings Limited |
| Sector: Services & Goods | |
| SubSector: Luxury Goods | |
| MarketCap: 712 Millions | |
| Recent Price: 2.09 Smart Investing & Trading Score: 50 | |
| Day Percent Change: -5.02% Day Change: -0.11 | |
| Week Change: -10.73% Year-to-date Change: 3.5% | |
| LANV Links: Profile News Message Board | |
| Charts:- Daily , Weekly | |
| Add LANV to Watchlist: View: Get Complete LANV Trend Analysis ➞ | |
 | QSG QuantaSing Group Limited |
| Sector: Consumer Staples | |
| SubSector: Education & Training Services | |
| MarketCap: 433 Millions | |
| Recent Price: 8.11 Smart Investing & Trading Score: 46 | |
| Day Percent Change: 3.9% Day Change: 0.3 | |
| Week Change: 13.01% Year-to-date Change: 269.9% | |
| QSG Links: Profile News Message Board | |
| Charts:- Daily , Weekly | |
| Add QSG to Watchlist: View: Get Complete QSG Trend Analysis ➞ | |
 | ICG Intchains Group Limited |
| Sector: Technology | |
| SubSector: Semiconductors | |
| MarketCap: 450 Millions | |
| Recent Price: 1.90 Smart Investing & Trading Score: 46 | |
| Day Percent Change: -2% Day Change: -0.04 | |
| Week Change: -18.84% Year-to-date Change: -40.6% | |
| ICG Links: Profile News Message Board | |
| Charts:- Daily , Weekly | |
| Add ICG to Watchlist: View: Get Complete ICG Trend Analysis ➞ | |
 | AIXI Xiao-I Corporation |
| Sector: Technology | |
| SubSector: Software - Application | |
| MarketCap: 431 Millions | |
| Recent Price: 1.59 Smart Investing & Trading Score: 43 | |
| Day Percent Change: 1.47% Day Change: 0.02 | |
| Week Change: -6.39% Year-to-date Change: -74.9% | |
| AIXI Links: Profile News Message Board | |
| Charts:- Daily , Weekly | |
| Add AIXI to Watchlist: View: Get Complete AIXI Trend Analysis ➞ | |
 | TOP TOP Financial Group Limited |
| Sector: Financials | |
| SubSector: Capital Markets | |
| MarketCap: 329 Millions | |
| Recent Price: 1.16 Smart Investing & Trading Score: 43 | |
| Day Percent Change: 0.91% Day Change: 0.01 | |
| Week Change: -0.07% Year-to-date Change: -23.5% | |
| TOP Links: Profile News Message Board | |
| Charts:- Daily , Weekly | |
| Add TOP to Watchlist: View: Get Complete TOP Trend Analysis ➞ | |
 | APM Aptorum Group Limited |
| Sector: Health Care | |
| SubSector: Biotechnology | |
| MarketCap: 88.7785 Millions | |
| Recent Price: 1.97 Smart Investing & Trading Score: 40 | |
| Day Percent Change: 234.65% Day Change: 2.98 | |
| Week Change: 191.1% Year-to-date Change: 51.8% | |
| APM Links: Profile News Message Board | |
| Charts:- Daily , Weekly | |
| Add APM to Watchlist: View: Get Complete APM Trend Analysis ➞ | |
 | XPEV XPeng Inc. |
| Sector: Services & Goods | |
| SubSector: Auto Manufacturers | |
| MarketCap: 32917 Millions | |
| Recent Price: 21.02 Smart Investing & Trading Score: 40 | |
| Day Percent Change: 11.68% Day Change: 2.38 | |
| Week Change: 17.39% Year-to-date Change: 92.5% | |
| XPEV Links: Profile News Message Board | |
| Charts:- Daily , Weekly | |
| Add XPEV to Watchlist: View: Get Complete XPEV Trend Analysis ➞ | |
 | BNR Burning Rock Biotech Limited |
| Sector: Health Care | |
| SubSector: Diagnostics & Research | |
| MarketCap: 27887 Millions | |
| Recent Price: 8.69 Smart Investing & Trading Score: 40 | |
| Day Percent Change: 6.02% Day Change: 0.56 | |
| Week Change: 41.87% Year-to-date Change: 46.1% | |
| BNR Links: Profile News Message Board | |
| Charts:- Daily , Weekly | |
| Add BNR to Watchlist: View: Get Complete BNR Trend Analysis ➞ | |
 | IMAB I Mab |
| Sector: Health Care | |
| SubSector: Biotechnology | |
| MarketCap: 26187 Millions | |
| Recent Price: 4.16 Smart Investing & Trading Score: 40 | |
| Day Percent Change: 4.2% Day Change: 0.19 | |
| Week Change: -8.72% Year-to-date Change: 454.1% | |
| IMAB Links: Profile News Message Board | |
| Charts:- Daily , Weekly | |
| Add IMAB to Watchlist: View: Get Complete IMAB Trend Analysis ➞ | |
 | NIU Niu Technologies |
| Sector: Consumer Staples | |
| SubSector: Auto Manufacturers - Major | |
| MarketCap: 543.271 Millions | |
| Recent Price: 4.37 Smart Investing & Trading Score: 40 | |
| Day Percent Change: 2.42% Day Change: 0.11 | |
| Week Change: -7.19% Year-to-date Change: 159.8% | |
| NIU Links: Profile News Message Board | |
| Charts:- Daily , Weekly | |
| Add NIU to Watchlist: View: Get Complete NIU Trend Analysis ➞ | |
| For tabular summary view of above stock list: Summary View ➞ 0 - 25 , 25 - 50 , 50 - 75 , 75 - 100 , 100 - 125 | ||
| Click To Change The Sort Order: By Market Cap or Company Size Performance: Year-to-date, Week and Day | |
| Select Chart Type: | ||
|
Best Stocks Today 12Stocks.com |
© 2025 12Stocks.com Terms & Conditions Privacy Contact Us
All Information Provided Only For Education And Not To Be Used For Investing or Trading. See Terms & Conditions


One More Thing ... Get Best Stocks Delivered Daily!
Never Ever Miss A Move With Our Top Ten Stocks Lists
Find Best Stocks In Any Market - Bull or Bear Market
Take A Peek At Our Top Ten Stocks Lists: Daily, Weekly, Year-to-Date & Top Trends
Find Best Stocks In Any Market - Bull or Bear Market
Take A Peek At Our Top Ten Stocks Lists: Daily, Weekly, Year-to-Date & Top Trends
China Stocks With Best Up Trends [0-bearish to 100-bullish]: Full Truck[100], NIO [100], Kanzhun [100], Alibaba [100], Baozun [100], Huazhu [100], iQIYI [100], Sohu.com [100], Smart Share[100], Baidu [100], China Online[100]
Best China Stocks Year-to-Date:
Regencell Bioscience[9561.54%], I Mab[454.12%], So-Young [384.74%], QuantaSing [269.91%], Xunlei [264.32%], OneConnect Financial[205.35%], Niu [159.78%], Viomi [154.48%], Yatsen Holding[141.21%], Tencent Music[120.18%], XPeng [92.47%] Best China Stocks This Week:
Xunlei [43.56%], Burning Rock[41.87%], NIO [24.49%], iQIYI [23.04%], Zhihu [18.1%], XPeng [17.39%], Smart Share[14.53%], Cheetah Mobile[13.59%], MINISO [13.58%], QuantaSing [13.01%], Full Truck[12.26%] Best China Stocks Daily:
X Financial[15.73%], XPeng [11.68%], Full Truck[9.81%], Viomi [9.39%], NIO [9.27%], CNFinance [7.77%], Lixiang Education[7.32%], Kanzhun [6.61%], MINISO [6.38%], Burning Rock[6.02%], FinVolution [5.55%]