
 Login Sign Up


| |||||
 |  | ||||

| 12Stocks.com Market Intelligence |
Best China Stocks
|
On this page, you will find the most comprehensive analysis of Chinese stocks and ETFs - from latest trends to performances to charts ➞. First, here are the year-to-date (YTD) performances of the most requested China stocks at 12Stocks.com (click stock for review):
| New Oriental 22% | ||
| Sohu.com 13% | ||
| NetEase -0% | ||
| JD.com -5% | ||
| Alibaba -6% | ||
| Vipshop -11% | ||
| JOYY -17% | ||
| Baidu -18% | ||
| Weibo -26% | ||
| In a hurry? China Stocks Lists: Performance Trends Table, Stock Charts
Sort China stocks: Daily, Weekly, Year-to-Date, Market Cap & Trends. Filter China stocks list by sector: Show all, Tech, Finance, Energy, Staples, Retail, Industrial, Materials, Utilities and HealthCare Filter China stocks list by size: All China Large Medium Small and MicroCap |
| April 24, 2024 - 12Stocks.com China Stocks Performances & Trends Daily | |||||||||
|
|  The overall Smart Investing & Trading Score is 100 (0-bearish to 100-bullish) which puts China index in short term bullish trend. The Smart Investing & Trading Score from previous trading session is 74 and an improvement of trend continues.
| ||||||||
| Here are the Smart Investing & Trading Scores of the most requested China stocks at 12Stocks.com (click stock name for detailed review): |


| 12Stocks.com: Top Performing China Index Stocks | ||||||||||||||||||||||||||||||||||||||||||||||||
 The top performing China Index stocks year to date are
Now, more recently, over last week, the top performing China Index stocks on the move are


|
||||||||||||||||||||||||||||||||||||||||||||||||
| 12Stocks.com: Investing in China Index with Stocks | |
|
The following table helps investors and traders sort through current performance and trends (as measured by Smart Investing & Trading Score) of various
stocks in the China Index. Quick View: Move mouse or cursor over stock symbol (ticker) to view short-term technical chart and over stock name to view long term chart. Click on  to add stock symbol to your watchlist and to add stock symbol to your watchlist and  to view watchlist. Click on any ticker or stock name for detailed market intelligence report for that stock. to view watchlist. Click on any ticker or stock name for detailed market intelligence report for that stock. |
12Stocks.com Performance of Stocks in China Index
| Ticker | Stock Name | Watchlist | Category | Recent Price | Smart Investing & Trading Score | Change % | YTD Change% |
| FENG | Phoenix New |   | Technology | 1.82 | 43 | -2.15% | 33.82% |
| BGNE | BeiGene | | Health Care | 138.99 | 42 | 6.15% | -22.94% |
| TUYA | Tuya | | Technology | 1.73 | 42 | 3.59% | -24.62% |
| CCM | Concord Medical | | Health Care | 0.58 | 42 | 15.93% | -47.28% |
| FANH | Fanhua | | Financials | 3.54 | 42 | 1.14% | -46.77% |
| NIO | NIO | | Consumer Staples | 4.01 | 42 | 0.25% | -55.79% |
| GHG | GreenTree Hospitality | | Services & Goods | 2.97 | 42 | 0.17% | -21.01% |
| KNDI | Kandi | | Consumer Staples | 2.46 | 42 | -1.60% | -12.14% |
| YJ | Yunji | | Services & Goods | 0.76 | 41 | 1.63% | 6.22% |
| HOLO | MicroCloud Hologram | | Technology | 2.58 | 41 | -2.27% | 642.45% |
| THCH | TH | | Services & Goods | 1.25 | 40 | 1.21% | -27.87% |
| ICG | Intchains | | Technology | 8.17 | 38 | -1.57% | -33.58% |
| HSAI | Hesai | | Services & Goods | 4.24 | 37 | 4.83% | -53.36% |
| YQ | 17 Education | | Consumer Staples | 2.35 | 36 | 10.07% | 15.20% |
| LKCO | Luokung | | Technology | 0.50 | 36 | -4.06% | 0.59% |
| MSC | Studio City | | Services & Goods | 7.23 | 36 | -3.46% | 11.57% |
| JFIN | Jiayin | | Technology | 6.32 | 36 | -0.63% | 22.01% |
| TWN | Taiwan Fund | | Financials | 37.00 | 36 | -0.46% | 6.97% |
| YI | 111 | | Services & Goods | 1.09 | 35 | 2.83% | -29.68% |
| PT | Pintec | | Technology | 1.10 | 35 | 1.39% | -1.35% |
| HYW | Hywin | | Financials | 0.87 | 35 | 0.00% | -52.92% |
| HUIZ | Huize Holding | | Financials | 0.63 | 35 | -0.35% | -30.28% |
| LX | LexinFintech | | Financials | 1.69 | 32 | 2.42% | -8.15% |
| ATHM | Autohome | | Technology | 24.74 | 32 | 0.20% | -11.83% |
| SECO | Secoo Holding | | Services & Goods | 0.41 | 32 | -3.63% | -26.67% |
| For chart view version of above stock list: Chart View ➞ 0 - 25 , 25 - 50 , 50 - 75 , 75 - 100 , 100 - 125 , 125 - 150 | ||
 | Click To Change The Sort Order: By Market Cap or Company Size Performance: Year-to-date, Week and Day |  |
|
Get the most comprehensive stock market coverage daily at 12Stocks.com ➞ Best Stocks Today ➞ Best Stocks Weekly ➞ Best Stocks Year-to-Date ➞ Best Stocks Trends ➞  Best Stocks Today 12Stocks.com Best Nasdaq Stocks ➞ Best S&P 500 Stocks ➞ Best Tech Stocks ➞ Best Biotech Stocks ➞ |
| Detailed Overview of China Stocks |
| China Technical Overview, Leaders & Laggards, Top China ETF Funds & Detailed China Stocks List, Charts, Trends & More |
| China: Technical Analysis, Trends & YTD Performance | |
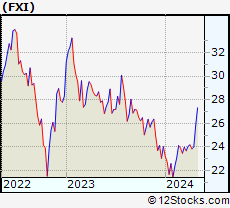
 FXI Weekly Chart |
|
| Long Term Trend: Very Good | |
| Medium Term Trend: Very Good | |
 FXI Daily Chart |
|
| Short Term Trend: Very Good | |
| Overall Trend Score: 100 | |
| YTD Performance: 3.2% | |
| **Trend Scores & Views Are Only For Educational Purposes And Not For Investing | |
| 12Stocks.com: Investing in China Index using Exchange Traded Funds | |
|
The following table shows list of key exchange traded funds (ETF) that
help investors play China stock market. For detailed view, check out our ETF Funds section of our website. Quick View: Move mouse or cursor over ETF symbol (ticker) to view short-term technical chart and over ETF name to view long term chart. Click on ticker or stock name for detailed view. Click on to add stock symbol to your watchlist and to view watchlist. |
12Stocks.com List of ETFs that track China Index
| Ticker | ETF Name | Watchlist | Recent Price | Smart Investing & Trading Score | Change % | Week % | Year-to-date % |
| FXI | China Large-Cap | | 24.80 | 100 | 1.56 | 3.29 | 3.2% |
| EWH | Hong Kong | | 15.25 | 59 | 1.73 | 3.74 | -12.2% |
| YINN | China Bull 3X | | 20.50 | 100 | 4.75 | 9.22 | -2.1% |
| YANG | China Bear 3X | | 10.60 | 0 | -4.76 | -9.17 | -17.19% |
| XPP | China 50 | | 13.80 | 100 | 3.22 | 6.42 | 0.4% |
| MCHI | China | | 40.71 | 100 | 2.16 | 3.3 | -0.07% |
| GXC | China | | 66.95 | 100 | 0.93 | 2.48 | -1.72% |
| CBON | ChinaAMC China Bond | | 21.92 | 55 | -0.14 | -0.03 | -0.81% |
| 12Stocks.com: Charts, Trends, Fundamental Data and Performances of China Stocks | |
|
We now take in-depth look at all China stocks including charts, multi-period performances and overall trends (as measured by Smart Investing & Trading Score). One can sort China stocks (click link to choose) by Daily, Weekly and by Year-to-Date performances. Also, one can sort by size of the company or by market capitalization. |
| Select Your Default Chart Type: | |||||
| |||||
| Click on stock symbol or name for detailed view. Click on to add stock symbol to your watchlist and to view watchlist. Quick View: Move mouse or cursor over "Daily" to quickly view daily technical stock chart and over "Weekly" to view weekly technical stock chart. | |||||

 | FENG Phoenix New Media Limited |
| Sector: Technology | |
| SubSector: Internet Information Providers | |
| MarketCap: 107.08 Millions | |
| Recent Price: 1.82 Smart Investing & Trading Score: 43 | |
| Day Percent Change: -2.15% Day Change: -0.04 | |
| Week Change: 0% Year-to-date Change: 33.8% | |
| FENG Links: Profile News Message Board | |
| Charts:- Daily , Weekly | |
| Add FENG to Watchlist: View: Get Complete FENG Trend Analysis ➞ | |
 | BGNE BeiGene, Ltd. |
| Sector: Health Care | |
| SubSector: Biotechnology | |
| MarketCap: 10838.5 Millions | |
| Recent Price: 138.99 Smart Investing & Trading Score: 42 | |
| Day Percent Change: 6.15% Day Change: 8.05 | |
| Week Change: 7.31% Year-to-date Change: -22.9% | |
| BGNE Links: Profile News Message Board | |
| Charts:- Daily , Weekly | |
| Add BGNE to Watchlist: View: Get Complete BGNE Trend Analysis ➞ | |
 | TUYA Tuya Inc. |
| Sector: Technology | |
| SubSector: Software - Infrastructure | |
| MarketCap: 1050 Millions | |
| Recent Price: 1.73 Smart Investing & Trading Score: 42 | |
| Day Percent Change: 3.59% Day Change: 0.06 | |
| Week Change: 10.19% Year-to-date Change: -24.6% | |
| TUYA Links: Profile News Message Board | |
| Charts:- Daily , Weekly | |
| Add TUYA to Watchlist: View: Get Complete TUYA Trend Analysis ➞ | |
 | CCM Concord Medical Services Holdings Limited |
| Sector: Health Care | |
| SubSector: Hospitals | |
| MarketCap: 138.646 Millions | |
| Recent Price: 0.58 Smart Investing & Trading Score: 42 | |
| Day Percent Change: 15.93% Day Change: 0.08 | |
| Week Change: 5.44% Year-to-date Change: -47.3% | |
| CCM Links: Profile News Message Board | |
| Charts:- Daily , Weekly | |
| Add CCM to Watchlist: View: Get Complete CCM Trend Analysis ➞ | |
 | FANH Fanhua Inc. |
| Sector: Financials | |
| SubSector: Insurance Brokers | |
| MarketCap: 1436.67 Millions | |
| Recent Price: 3.54 Smart Investing & Trading Score: 42 | |
| Day Percent Change: 1.14% Day Change: 0.04 | |
| Week Change: 1.14% Year-to-date Change: -46.8% | |
| FANH Links: Profile News Message Board | |
| Charts:- Daily , Weekly | |
| Add FANH to Watchlist: View: Get Complete FANH Trend Analysis ➞ | |
 | NIO NIO Limited |
| Sector: Consumer Staples | |
| SubSector: Auto Manufacturers - Major | |
| MarketCap: 2679.71 Millions | |
| Recent Price: 4.01 Smart Investing & Trading Score: 42 | |
| Day Percent Change: 0.25% Day Change: 0.01 | |
| Week Change: 5.53% Year-to-date Change: -55.8% | |
| NIO Links: Profile News Message Board | |
| Charts:- Daily , Weekly | |
| Add NIO to Watchlist: View: Get Complete NIO Trend Analysis ➞ | |
 | GHG GreenTree Hospitality Group Ltd. |
| Sector: Services & Goods | |
| SubSector: Lodging | |
| MarketCap: 1195.36 Millions | |
| Recent Price: 2.97 Smart Investing & Trading Score: 42 | |
| Day Percent Change: 0.17% Day Change: 0.01 | |
| Week Change: 4.8% Year-to-date Change: -21.0% | |
| GHG Links: Profile News Message Board | |
| Charts:- Daily , Weekly | |
| Add GHG to Watchlist: View: Get Complete GHG Trend Analysis ➞ | |
 | KNDI Kandi Technologies Group, Inc. |
| Sector: Consumer Staples | |
| SubSector: Auto Manufacturers - Major | |
| MarketCap: 137.471 Millions | |
| Recent Price: 2.46 Smart Investing & Trading Score: 42 | |
| Day Percent Change: -1.60% Day Change: -0.04 | |
| Week Change: -3.53% Year-to-date Change: -12.1% | |
| KNDI Links: Profile News Message Board | |
| Charts:- Daily , Weekly | |
| Add KNDI to Watchlist: View: Get Complete KNDI Trend Analysis ➞ | |
 | YJ Yunji Inc. |
| Sector: Services & Goods | |
| SubSector: Specialty Retail, Other | |
| MarketCap: 770.644 Millions | |
| Recent Price: 0.76 Smart Investing & Trading Score: 41 | |
| Day Percent Change: 1.63% Day Change: 0.01 | |
| Week Change: 1.29% Year-to-date Change: 6.2% | |
| YJ Links: Profile News Message Board | |
| Charts:- Daily , Weekly | |
| Add YJ to Watchlist: View: Get Complete YJ Trend Analysis ➞ | |
 | HOLO MicroCloud Hologram Inc. |
| Sector: Technology | |
| SubSector: Electronic Components | |
| MarketCap: 159 Millions | |
| Recent Price: 2.58 Smart Investing & Trading Score: 41 | |
| Day Percent Change: -2.27% Day Change: -0.06 | |
| Week Change: -7.53% Year-to-date Change: 642.5% | |
| HOLO Links: Profile News Message Board | |
| Charts:- Daily , Weekly | |
| Add HOLO to Watchlist: View: Get Complete HOLO Trend Analysis ➞ | |
 | THCH TH International Limited |
| Sector: Services & Goods | |
| SubSector: Restaurants | |
| MarketCap: 452 Millions | |
| Recent Price: 1.25 Smart Investing & Trading Score: 40 | |
| Day Percent Change: 1.21% Day Change: 0.01 | |
| Week Change: 2.03% Year-to-date Change: -27.9% | |
| THCH Links: Profile News Message Board | |
| Charts:- Daily , Weekly | |
| Add THCH to Watchlist: View: Get Complete THCH Trend Analysis ➞ | |
 | ICG Intchains Group Limited |
| Sector: Technology | |
| SubSector: Semiconductors | |
| MarketCap: 450 Millions | |
| Recent Price: 8.17 Smart Investing & Trading Score: 38 | |
| Day Percent Change: -1.57% Day Change: -0.13 | |
| Week Change: -1.57% Year-to-date Change: -33.6% | |
| ICG Links: Profile News Message Board | |
| Charts:- Daily , Weekly | |
| Add ICG to Watchlist: View: Get Complete ICG Trend Analysis ➞ | |
 | HSAI Hesai Group |
| Sector: Services & Goods | |
| SubSector: Auto Parts | |
| MarketCap: 1330 Millions | |
| Recent Price: 4.24 Smart Investing & Trading Score: 37 | |
| Day Percent Change: 4.83% Day Change: 0.20 | |
| Week Change: 6.68% Year-to-date Change: -53.4% | |
| HSAI Links: Profile News Message Board | |
| Charts:- Daily , Weekly | |
| Add HSAI to Watchlist: View: Get Complete HSAI Trend Analysis ➞ | |
 | YQ 17 Education & Technology Group Inc. |
| Sector: Consumer Staples | |
| SubSector: Education & Training Services | |
| MarketCap: 32347 Millions | |
| Recent Price: 2.35 Smart Investing & Trading Score: 36 | |
| Day Percent Change: 10.07% Day Change: 0.22 | |
| Week Change: -4.67% Year-to-date Change: 15.2% | |
| YQ Links: Profile News Message Board | |
| Charts:- Daily , Weekly | |
| Add YQ to Watchlist: View: Get Complete YQ Trend Analysis ➞ | |
 | LKCO Luokung Technology Corp. |
| Sector: Technology | |
| SubSector: Application Software | |
| MarketCap: 84 Millions | |
| Recent Price: 0.50 Smart Investing & Trading Score: 36 | |
| Day Percent Change: -4.06% Day Change: -0.02 | |
| Week Change: -7.49% Year-to-date Change: 0.6% | |
| LKCO Links: Profile News Message Board | |
| Charts:- Daily , Weekly | |
| Add LKCO to Watchlist: View: Get Complete LKCO Trend Analysis ➞ | |
 | MSC Studio City International Holdings Limited |
| Sector: Services & Goods | |
| SubSector: Resorts & Casinos | |
| MarketCap: 1420.54 Millions | |
| Recent Price: 7.23 Smart Investing & Trading Score: 36 | |
| Day Percent Change: -3.46% Day Change: -0.26 | |
| Week Change: -3.47% Year-to-date Change: 11.6% | |
| MSC Links: Profile News Message Board | |
| Charts:- Daily , Weekly | |
| Add MSC to Watchlist: View: Get Complete MSC Trend Analysis ➞ | |
 | JFIN Jiayin Group Inc. |
| Sector: Technology | |
| SubSector: Internet Information Providers | |
| MarketCap: 131.48 Millions | |
| Recent Price: 6.32 Smart Investing & Trading Score: 36 | |
| Day Percent Change: -0.63% Day Change: -0.04 | |
| Week Change: -2.02% Year-to-date Change: 22.0% | |
| JFIN Links: Profile News Message Board | |
| Charts:- Daily , Weekly | |
| Add JFIN to Watchlist: View: Get Complete JFIN Trend Analysis ➞ | |
 | TWN The Taiwan Fund, Inc. |
| Sector: Financials | |
| SubSector: Closed-End Fund - Foreign | |
| MarketCap: 110.547 Millions | |
| Recent Price: 37.00 Smart Investing & Trading Score: 36 | |
| Day Percent Change: -0.46% Day Change: -0.17 | |
| Week Change: -2.12% Year-to-date Change: 7.0% | |
| TWN Links: Profile News Message Board | |
| Charts:- Daily , Weekly | |
| Add TWN to Watchlist: View: Get Complete TWN Trend Analysis ➞ | |
 | YI 111, Inc. |
| Sector: Services & Goods | |
| SubSector: Drug Stores | |
| MarketCap: 520.351 Millions | |
| Recent Price: 1.09 Smart Investing & Trading Score: 35 | |
| Day Percent Change: 2.83% Day Change: 0.03 | |
| Week Change: 6.86% Year-to-date Change: -29.7% | |
| YI Links: Profile News Message Board | |
| Charts:- Daily , Weekly | |
| Add YI to Watchlist: View: Get Complete YI Trend Analysis ➞ | |
 | PT Pintec Technology Holdings Limited |
| Sector: Technology | |
| SubSector: Wireless Communications | |
| MarketCap: 87.7827 Millions | |
| Recent Price: 1.10 Smart Investing & Trading Score: 35 | |
| Day Percent Change: 1.39% Day Change: 0.01 | |
| Week Change: 2.34% Year-to-date Change: -1.4% | |
| PT Links: Profile News Message Board | |
| Charts:- Daily , Weekly | |
| Add PT to Watchlist: View: Get Complete PT Trend Analysis ➞ | |
 | HYW Hywin Holdings Ltd. |
| Sector: Financials | |
| SubSector: Asset Management | |
| MarketCap: 161 Millions | |
| Recent Price: 0.87 Smart Investing & Trading Score: 35 | |
| Day Percent Change: 0.00% Day Change: 0.00 | |
| Week Change: 8.88% Year-to-date Change: -52.9% | |
| HYW Links: Profile News Message Board | |
| Charts:- Daily , Weekly | |
| Add HYW to Watchlist: View: Get Complete HYW Trend Analysis ➞ | |
 | HUIZ Huize Holding Limited |
| Sector: Financials | |
| SubSector: Insurance Brokers | |
| MarketCap: 37157 Millions | |
| Recent Price: 0.63 Smart Investing & Trading Score: 35 | |
| Day Percent Change: -0.35% Day Change: 0.00 | |
| Week Change: 1.7% Year-to-date Change: -30.3% | |
| HUIZ Links: Profile News Message Board | |
| Charts:- Daily , Weekly | |
| Add HUIZ to Watchlist: View: Get Complete HUIZ Trend Analysis ➞ | |
 | LX LexinFintech Holdings Ltd. |
| Sector: Financials | |
| SubSector: Credit Services | |
| MarketCap: 1674.18 Millions | |
| Recent Price: 1.69 Smart Investing & Trading Score: 32 | |
| Day Percent Change: 2.42% Day Change: 0.04 | |
| Week Change: 3.68% Year-to-date Change: -8.2% | |
| LX Links: Profile News Message Board | |
| Charts:- Daily , Weekly | |
| Add LX to Watchlist: View: Get Complete LX Trend Analysis ➞ | |
 | ATHM Autohome Inc. |
| Sector: Technology | |
| SubSector: Internet Information Providers | |
| MarketCap: 7984.2 Millions | |
| Recent Price: 24.74 Smart Investing & Trading Score: 32 | |
| Day Percent Change: 0.20% Day Change: 0.05 | |
| Week Change: 1.89% Year-to-date Change: -11.8% | |
| ATHM Links: Profile News Message Board | |
| Charts:- Daily , Weekly | |
| Add ATHM to Watchlist: View: Get Complete ATHM Trend Analysis ➞ | |
 | SECO Secoo Holding Limited |
| Sector: Services & Goods | |
| SubSector: Specialty Retail, Other | |
| MarketCap: 209.144 Millions | |
| Recent Price: 0.41 Smart Investing & Trading Score: 32 | |
| Day Percent Change: -3.63% Day Change: -0.02 | |
| Week Change: -1.12% Year-to-date Change: -26.7% | |
| SECO Links: Profile News Message Board | |
| Charts:- Daily , Weekly | |
| Add SECO to Watchlist: View: Get Complete SECO Trend Analysis ➞ | |
| For tabular summary view of above stock list: Summary View ➞ 0 - 25 , 25 - 50 , 50 - 75 , 75 - 100 , 100 - 125 , 125 - 150 | ||
| Click To Change The Sort Order: By Market Cap or Company Size Performance: Year-to-date, Week and Day | |
| Select Chart Type: | ||
|
Best Stocks Today 12Stocks.com |
© 2024 12Stocks.com Terms & Conditions Privacy Contact Us
All Information Provided Only For Education And Not To Be Used For Investing or Trading. See Terms & Conditions


One More Thing ... Get Best Stocks Delivered Daily!
Never Ever Miss A Move With Our Top Ten Stocks Lists
Find Best Stocks In Any Market - Bull or Bear Market
Take A Peek At Our Top Ten Stocks Lists: Daily, Weekly, Year-to-Date & Top Trends
Find Best Stocks In Any Market - Bull or Bear Market
Take A Peek At Our Top Ten Stocks Lists: Daily, Weekly, Year-to-Date & Top Trends
China Stocks With Best Up Trends [0-bearish to 100-bullish]: Hutchison China[100], iQIYI [100], Xunlei [100], Tencent Music[100], MINISO [100], Full Truck[100], JD.com [100], Baozun [95], Yatsen Holding[95], Trip.com [93], MOGU [93]
Best China Stocks Year-to-Date:
U Power[2801.79%], DouYu [783.16%], MicroCloud Hologram[642.45%], China Liberal[498.43%], Yatsen Holding[437.18%], Zhongchao [369.73%], Uxin [136.8%], QuantaSing [105.86%], GigaCloud [102.02%], Cheetah Mobile[78.07%], Bright Scholar[64.8%] Best China Stocks This Week:
Cheetah Mobile[14.69%], Pinduoduo [12.8%], iQIYI [12.12%], China Online[11.9%], Hutchison China[10.67%], Tuya [10.19%], Baozun [9.91%], Hywin [8.88%], Yatsen Holding[8.71%], Tencent Music[8.45%], Qudian [8.33%] Best China Stocks Daily:
Golden Heaven[11.75%], 17 Education[10.07%], China Online[9.37%], Uxin [9.21%], Ebang [9.17%], Cheetah Mobile[8.85%], Aesthetic Medical[8.02%], Zhongchao [7.86%], Hutchison China[7.73%], U Power[7.00%], Xiao-I [6.77%]