
 Login Sign Up


| |||||
 |  | ||||

| 12Stocks.com Market Intelligence |
Best China Stocks
|
On this page, you will find the most comprehensive analysis of Chinese stocks and ETFs - from latest trends to performances to charts ➞. First, here are the year-to-date (YTD) performances of the most requested China stocks at 12Stocks.com (click stock for review):
| New Oriental 16% | ||
| Sohu.com 11% | ||
| NetEase 0% | ||
| Alibaba -11% | ||
| JD.com -12% | ||
| Vipshop -15% | ||
| JOYY -19% | ||
| Baidu -20% | ||
| Weibo -28% | ||
| In a hurry? China Stocks Lists: Performance Trends Table, Stock Charts
Sort China stocks: Daily, Weekly, Year-to-Date, Market Cap & Trends. Filter China stocks list by sector: Show all, Tech, Finance, Energy, Staples, Retail, Industrial, Materials, Utilities and HealthCare Filter China stocks list by size: All China Large Medium Small and MicroCap |
| April 19, 2024 - 12Stocks.com China Stocks Performances & Trends Daily | |||||||||
|
|  The overall Smart Investing & Trading Score is 74 (0-bearish to 100-bullish) which puts China index in short term neutral to bullish trend. The Smart Investing & Trading Score from previous trading session is 73 and hence an improvement of trend.
| ||||||||
| Here are the Smart Investing & Trading Scores of the most requested China stocks at 12Stocks.com (click stock name for detailed review): |


| 12Stocks.com: Top Performing China Index Stocks | ||||||||||||||||||||||||||||||||||||||||||||||||
 The top performing China Index stocks year to date are
Now, more recently, over last week, the top performing China Index stocks on the move are


|
||||||||||||||||||||||||||||||||||||||||||||||||
| 12Stocks.com: Investing in China Index with Stocks | |
|
The following table helps investors and traders sort through current performance and trends (as measured by Smart Investing & Trading Score) of various
stocks in the China Index. Quick View: Move mouse or cursor over stock symbol (ticker) to view short-term technical chart and over stock name to view long term chart. Click on  to add stock symbol to your watchlist and to add stock symbol to your watchlist and  to view watchlist. Click on any ticker or stock name for detailed market intelligence report for that stock. to view watchlist. Click on any ticker or stock name for detailed market intelligence report for that stock. |
12Stocks.com Performance of Stocks in China Index
| Ticker | Stock Name | Watchlist | Category | Recent Price | Smart Investing & Trading Score | Change % | YTD Change% |
| KNDI | Kandi |   | Consumer Staples | 2.52 | 47 | -4.18% | -10.00% |
| BZUN | Baozun | | Services & Goods | 2.31 | 46 | -2.73% | -15.51% |
| DQ | Daqo New | | Technology | 22.11 | 46 | -2.64% | -16.88% |
| BILI | Bilibili | | Technology | 10.91 | 44 | -1.45% | -10.35% |
| TWN | Taiwan Fund | | Financials | 37.80 | 44 | -1.05% | 9.28% |
| APM | Aptorum | | Health Care | 5.90 | 43 | 5.55% | 140.95% |
| QD | Qudian | | Technology | 2.28 | 43 | 1.33% | 11.76% |
| QSG | QuantaSing | | Consumer Staples | 3.52 | 42 | 2.18% | 117.28% |
| NIO | NIO | | Consumer Staples | 3.80 | 42 | -5.00% | -58.10% |
| DUO | Fangdd Network | | Financials | 0.39 | 42 | -2.50% | -42.05% |
| MOMO | Momo | | Technology | 5.60 | 42 | -1.41% | -19.42% |
| ICG | Intchains | | Technology | 8.17 | 42 | 0.86% | -33.58% |
| CANG | Cango | | Technology | 1.40 | 41 | 1.45% | 37.25% |
| HUYA | HUYA | | Services & Goods | 4.41 | 41 | -2.22% | 20.49% |
| DAO | Youdao | | Technology | 3.55 | 41 | -0.56% | -9.90% |
| LKCO | Luokung | | Technology | 0.54 | 41 | -0.19% | 8.74% |
| EDU | New Oriental | | Services & Goods | 84.99 | 41 | -2.19% | 15.98% |
| HSAI | Hesai | | Services & Goods | 4.01 | 40 | -8.13% | -55.84% |
| FINV | FinVolution | | Financials | 4.74 | 38 | 0.21% | -3.27% |
| YJ | Yunji | | Services & Goods | 0.75 | 38 | 0.00% | 4.87% |
| WB | | Technology | 7.90 | 37 | -1.99% | -27.85% | |
| FENG | Phoenix New | | Technology | 1.79 | 36 | -4.53% | 31.62% |
| HTHT | Huazhu | | Services & Goods | 36.87 | 36 | -1.31% | 10.26% |
| SMI | Semiconductor | | Technology | 45.67 | 36 | -0.05% | -1.68% |
| VIOT | Viomi | | Technology | 0.55 | 35 | 0.00% | -45.45% |
| For chart view version of above stock list: Chart View ➞ 0 - 25 , 25 - 50 , 50 - 75 , 75 - 100 , 100 - 125 , 125 - 150 | ||
 | Click To Change The Sort Order: By Market Cap or Company Size Performance: Year-to-date, Week and Day |  |
|
Get the most comprehensive stock market coverage daily at 12Stocks.com ➞ Best Stocks Today ➞ Best Stocks Weekly ➞ Best Stocks Year-to-Date ➞ Best Stocks Trends ➞  Best Stocks Today 12Stocks.com Best Nasdaq Stocks ➞ Best S&P 500 Stocks ➞ Best Tech Stocks ➞ Best Biotech Stocks ➞ |
| Detailed Overview of China Stocks |
| China Technical Overview, Leaders & Laggards, Top China ETF Funds & Detailed China Stocks List, Charts, Trends & More |
| China: Technical Analysis, Trends & YTD Performance | |
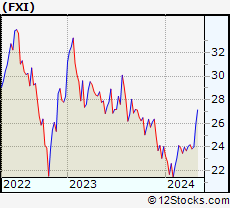
 FXI Weekly Chart |
|
| Long Term Trend: Very Good | |
| Medium Term Trend: Not Good | |
 FXI Daily Chart |
|
| Short Term Trend: Very Good | |
| Overall Trend Score: 74 | |
| YTD Performance: -0.08% | |
| **Trend Scores & Views Are Only For Educational Purposes And Not For Investing | |
| 12Stocks.com: Investing in China Index using Exchange Traded Funds | |
|
The following table shows list of key exchange traded funds (ETF) that
help investors play China stock market. For detailed view, check out our ETF Funds section of our website. Quick View: Move mouse or cursor over ETF symbol (ticker) to view short-term technical chart and over ETF name to view long term chart. Click on ticker or stock name for detailed view. Click on to add stock symbol to your watchlist and to view watchlist. |
12Stocks.com List of ETFs that track China Index
| Ticker | ETF Name | Watchlist | Recent Price | Smart Investing & Trading Score | Change % | Week % | Year-to-date % |
| FXI | China Large-Cap | | 24.01 | 74 | -0.29 | 0.71 | -0.08% |
| EWH | Hong Kong | | 14.70 | 10 | -0.27 | -3.03 | -15.37% |
| YINN | China Bull 3X | | 18.77 | 66 | -0.21 | 2.07 | -10.36% |
| YANG | China Bear 3X | | 11.67 | 39 | 0.78 | -1.85 | -8.83% |
| XPP | China 50 | | 12.90 | 73 | -0.69 | 0.94 | -6.15% |
| MCHI | China | | 39.41 | 59 | -0.33 | 0.33 | -3.26% |
| GXC | China | | 65.19 | 59 | -0.50 | 0.18 | -4.3% |
| CBON | ChinaAMC China Bond | | 21.93 | 60 | 0.05 | 0.3 | -0.79% |
| 12Stocks.com: Charts, Trends, Fundamental Data and Performances of China Stocks | |
|
We now take in-depth look at all China stocks including charts, multi-period performances and overall trends (as measured by Smart Investing & Trading Score). One can sort China stocks (click link to choose) by Daily, Weekly and by Year-to-Date performances. Also, one can sort by size of the company or by market capitalization. |
| Select Your Default Chart Type: | |||||
| |||||
| Click on stock symbol or name for detailed view. Click on to add stock symbol to your watchlist and to view watchlist. Quick View: Move mouse or cursor over "Daily" to quickly view daily technical stock chart and over "Weekly" to view weekly technical stock chart. | |||||

 | KNDI Kandi Technologies Group, Inc. |
| Sector: Consumer Staples | |
| SubSector: Auto Manufacturers - Major | |
| MarketCap: 137.471 Millions | |
| Recent Price: 2.52 Smart Investing & Trading Score: 47 | |
| Day Percent Change: -4.18% Day Change: -0.11 | |
| Week Change: 20.57% Year-to-date Change: -10.0% | |
| KNDI Links: Profile News Message Board | |
| Charts:- Daily , Weekly | |
| Add KNDI to Watchlist: View: Get Complete KNDI Trend Analysis ➞ | |
 | BZUN Baozun Inc. |
| Sector: Services & Goods | |
| SubSector: Catalog & Mail Order Houses | |
| MarketCap: 1668.92 Millions | |
| Recent Price: 2.31 Smart Investing & Trading Score: 46 | |
| Day Percent Change: -2.73% Day Change: -0.06 | |
| Week Change: -2.32% Year-to-date Change: -15.5% | |
| BZUN Links: Profile News Message Board | |
| Charts:- Daily , Weekly | |
| Add BZUN to Watchlist: View: Get Complete BZUN Trend Analysis ➞ | |
 | DQ Daqo New Energy Corp. |
| Sector: Technology | |
| SubSector: Semiconductor Equipment & Materials | |
| MarketCap: 660.918 Millions | |
| Recent Price: 22.11 Smart Investing & Trading Score: 46 | |
| Day Percent Change: -2.64% Day Change: -0.60 | |
| Week Change: -5.27% Year-to-date Change: -16.9% | |
| DQ Links: Profile News Message Board | |
| Charts:- Daily , Weekly | |
| Add DQ to Watchlist: View: Get Complete DQ Trend Analysis ➞ | |
 | BILI Bilibili Inc. |
| Sector: Technology | |
| SubSector: Internet Information Providers | |
| MarketCap: 7043.1 Millions | |
| Recent Price: 10.91 Smart Investing & Trading Score: 44 | |
| Day Percent Change: -1.45% Day Change: -0.16 | |
| Week Change: -4.97% Year-to-date Change: -10.4% | |
| BILI Links: Profile News Message Board | |
| Charts:- Daily , Weekly | |
| Add BILI to Watchlist: View: Get Complete BILI Trend Analysis ➞ | |
 | TWN The Taiwan Fund, Inc. |
| Sector: Financials | |
| SubSector: Closed-End Fund - Foreign | |
| MarketCap: 110.547 Millions | |
| Recent Price: 37.80 Smart Investing & Trading Score: 44 | |
| Day Percent Change: -1.05% Day Change: -0.40 | |
| Week Change: -3.74% Year-to-date Change: 9.3% | |
| TWN Links: Profile News Message Board | |
| Charts:- Daily , Weekly | |
| Add TWN to Watchlist: View: Get Complete TWN Trend Analysis ➞ | |
 | APM Aptorum Group Limited |
| Sector: Health Care | |
| SubSector: Biotechnology | |
| MarketCap: 88.7785 Millions | |
| Recent Price: 5.90 Smart Investing & Trading Score: 43 | |
| Day Percent Change: 5.55% Day Change: 0.31 | |
| Week Change: -28.14% Year-to-date Change: 141.0% | |
| APM Links: Profile News Message Board | |
| Charts:- Daily , Weekly | |
| Add APM to Watchlist: View: Get Complete APM Trend Analysis ➞ | |
 | QD Qudian Inc. |
| Sector: Technology | |
| SubSector: Information Technology Services | |
| MarketCap: 544.968 Millions | |
| Recent Price: 2.28 Smart Investing & Trading Score: 43 | |
| Day Percent Change: 1.33% Day Change: 0.03 | |
| Week Change: -5.79% Year-to-date Change: 11.8% | |
| QD Links: Profile News Message Board | |
| Charts:- Daily , Weekly | |
| Add QD to Watchlist: View: Get Complete QD Trend Analysis ➞ | |
 | QSG QuantaSing Group Limited |
| Sector: Consumer Staples | |
| SubSector: Education & Training Services | |
| MarketCap: 433 Millions | |
| Recent Price: 3.52 Smart Investing & Trading Score: 42 | |
| Day Percent Change: 2.18% Day Change: 0.08 | |
| Week Change: 4.76% Year-to-date Change: 117.3% | |
| QSG Links: Profile News Message Board | |
| Charts:- Daily , Weekly | |
| Add QSG to Watchlist: View: Get Complete QSG Trend Analysis ➞ | |
 | NIO NIO Limited |
| Sector: Consumer Staples | |
| SubSector: Auto Manufacturers - Major | |
| MarketCap: 2679.71 Millions | |
| Recent Price: 3.80 Smart Investing & Trading Score: 42 | |
| Day Percent Change: -5.00% Day Change: -0.20 | |
| Week Change: -7.54% Year-to-date Change: -58.1% | |
| NIO Links: Profile News Message Board | |
| Charts:- Daily , Weekly | |
| Add NIO to Watchlist: View: Get Complete NIO Trend Analysis ➞ | |
 | DUO Fangdd Network Group Ltd. |
| Sector: Financials | |
| SubSector: Property Management | |
| MarketCap: 783.142 Millions | |
| Recent Price: 0.39 Smart Investing & Trading Score: 42 | |
| Day Percent Change: -2.50% Day Change: -0.01 | |
| Week Change: -3.23% Year-to-date Change: -42.1% | |
| DUO Links: Profile News Message Board | |
| Charts:- Daily , Weekly | |
| Add DUO to Watchlist: View: Get Complete DUO Trend Analysis ➞ | |
 | MOMO Momo Inc. |
| Sector: Technology | |
| SubSector: Internet Software & Services | |
| MarketCap: 4796.71 Millions | |
| Recent Price: 5.60 Smart Investing & Trading Score: 42 | |
| Day Percent Change: -1.41% Day Change: -0.08 | |
| Week Change: 5.66% Year-to-date Change: -19.4% | |
| MOMO Links: Profile News Message Board | |
| Charts:- Daily , Weekly | |
| Add MOMO to Watchlist: View: Get Complete MOMO Trend Analysis ➞ | |
 | ICG Intchains Group Limited |
| Sector: Technology | |
| SubSector: Semiconductors | |
| MarketCap: 450 Millions | |
| Recent Price: 8.17 Smart Investing & Trading Score: 42 | |
| Day Percent Change: 0.86% Day Change: 0.07 | |
| Week Change: -0.97% Year-to-date Change: -33.6% | |
| ICG Links: Profile News Message Board | |
| Charts:- Daily , Weekly | |
| Add ICG to Watchlist: View: Get Complete ICG Trend Analysis ➞ | |
 | CANG Cango Inc. |
| Sector: Technology | |
| SubSector: Internet Information Providers | |
| MarketCap: 947.48 Millions | |
| Recent Price: 1.40 Smart Investing & Trading Score: 41 | |
| Day Percent Change: 1.45% Day Change: 0.02 | |
| Week Change: -4.11% Year-to-date Change: 37.3% | |
| CANG Links: Profile News Message Board | |
| Charts:- Daily , Weekly | |
| Add CANG to Watchlist: View: Get Complete CANG Trend Analysis ➞ | |
 | HUYA HUYA Inc. |
| Sector: Services & Goods | |
| SubSector: Entertainment - Diversified | |
| MarketCap: 3358.17 Millions | |
| Recent Price: 4.41 Smart Investing & Trading Score: 41 | |
| Day Percent Change: -2.22% Day Change: -0.10 | |
| Week Change: -3.5% Year-to-date Change: 20.5% | |
| HUYA Links: Profile News Message Board | |
| Charts:- Daily , Weekly | |
| Add HUYA to Watchlist: View: Get Complete HUYA Trend Analysis ➞ | |
 | DAO Youdao, Inc. |
| Sector: Technology | |
| SubSector: Internet Information Providers | |
| MarketCap: 2073.2 Millions | |
| Recent Price: 3.55 Smart Investing & Trading Score: 41 | |
| Day Percent Change: -0.56% Day Change: -0.02 | |
| Week Change: -11.03% Year-to-date Change: -9.9% | |
| DAO Links: Profile News Message Board | |
| Charts:- Daily , Weekly | |
| Add DAO to Watchlist: View: Get Complete DAO Trend Analysis ➞ | |
 | LKCO Luokung Technology Corp. |
| Sector: Technology | |
| SubSector: Application Software | |
| MarketCap: 84 Millions | |
| Recent Price: 0.54 Smart Investing & Trading Score: 41 | |
| Day Percent Change: -0.19% Day Change: 0.00 | |
| Week Change: 1.07% Year-to-date Change: 8.7% | |
| LKCO Links: Profile News Message Board | |
| Charts:- Daily , Weekly | |
| Add LKCO to Watchlist: View: Get Complete LKCO Trend Analysis ➞ | |
 | EDU New Oriental Education & Technology Group Inc. |
| Sector: Services & Goods | |
| SubSector: Education & Training Services | |
| MarketCap: 18673.7 Millions | |
| Recent Price: 84.99 Smart Investing & Trading Score: 41 | |
| Day Percent Change: -2.19% Day Change: -1.90 | |
| Week Change: -1.81% Year-to-date Change: 16.0% | |
| EDU Links: Profile News Message Board | |
| Charts:- Daily , Weekly | |
| Add EDU to Watchlist: View: Get Complete EDU Trend Analysis ➞ | |
 | HSAI Hesai Group |
| Sector: Services & Goods | |
| SubSector: Auto Parts | |
| MarketCap: 1330 Millions | |
| Recent Price: 4.01 Smart Investing & Trading Score: 40 | |
| Day Percent Change: -8.13% Day Change: -0.36 | |
| Week Change: -11.28% Year-to-date Change: -55.8% | |
| HSAI Links: Profile News Message Board | |
| Charts:- Daily , Weekly | |
| Add HSAI to Watchlist: View: Get Complete HSAI Trend Analysis ➞ | |
 | FINV FinVolution Group |
| Sector: Financials | |
| SubSector: Credit Services | |
| MarketCap: 476.208 Millions | |
| Recent Price: 4.74 Smart Investing & Trading Score: 38 | |
| Day Percent Change: 0.21% Day Change: 0.01 | |
| Week Change: -5.2% Year-to-date Change: -3.3% | |
| FINV Links: Profile News Message Board | |
| Charts:- Daily , Weekly | |
| Add FINV to Watchlist: View: Get Complete FINV Trend Analysis ➞ | |
 | YJ Yunji Inc. |
| Sector: Services & Goods | |
| SubSector: Specialty Retail, Other | |
| MarketCap: 770.644 Millions | |
| Recent Price: 0.75 Smart Investing & Trading Score: 38 | |
| Day Percent Change: 0.00% Day Change: 0.00 | |
| Week Change: -15.28% Year-to-date Change: 4.9% | |
| YJ Links: Profile News Message Board | |
| Charts:- Daily , Weekly | |
| Add YJ to Watchlist: View: Get Complete YJ Trend Analysis ➞ | |
 | WB Weibo Corporation |
| Sector: Technology | |
| SubSector: Internet Information Providers | |
| MarketCap: 8164.6 Millions | |
| Recent Price: 7.90 Smart Investing & Trading Score: 37 | |
| Day Percent Change: -1.99% Day Change: -0.16 | |
| Week Change: 3.54% Year-to-date Change: -27.9% | |
| WB Links: Profile News Message Board | |
| Charts:- Daily , Weekly | |
| Add WB to Watchlist: View: Get Complete WB Trend Analysis ➞ | |
 | FENG Phoenix New Media Limited |
| Sector: Technology | |
| SubSector: Internet Information Providers | |
| MarketCap: 107.08 Millions | |
| Recent Price: 1.79 Smart Investing & Trading Score: 36 | |
| Day Percent Change: -4.53% Day Change: -0.08 | |
| Week Change: -11.82% Year-to-date Change: 31.6% | |
| FENG Links: Profile News Message Board | |
| Charts:- Daily , Weekly | |
| Add FENG to Watchlist: View: Get Complete FENG Trend Analysis ➞ | |
 | HTHT Huazhu Group Limited |
| Sector: Services & Goods | |
| SubSector: Lodging | |
| MarketCap: 9164.46 Millions | |
| Recent Price: 36.87 Smart Investing & Trading Score: 36 | |
| Day Percent Change: -1.31% Day Change: -0.49 | |
| Week Change: -1.63% Year-to-date Change: 10.3% | |
| HTHT Links: Profile News Message Board | |
| Charts:- Daily , Weekly | |
| Add HTHT to Watchlist: View: Get Complete HTHT Trend Analysis ➞ | |
 | SMI Semiconductor Manufacturing International Corporation |
| Sector: Technology | |
| SubSector: Semiconductor - Integrated Circuits | |
| MarketCap: 6287.56 Millions | |
| Recent Price: 45.67 Smart Investing & Trading Score: 36 | |
| Day Percent Change: -0.05% Day Change: -0.02 | |
| Week Change: -0.07% Year-to-date Change: -1.7% | |
| SMI Links: Profile News Message Board | |
| Charts:- Daily , Weekly | |
| Add SMI to Watchlist: View: Get Complete SMI Trend Analysis ➞ | |
 | VIOT Viomi Technology Co., Ltd |
| Sector: Technology | |
| SubSector: Electronic Equipment | |
| MarketCap: 357.2 Millions | |
| Recent Price: 0.55 Smart Investing & Trading Score: 35 | |
| Day Percent Change: 0.00% Day Change: 0.00 | |
| Week Change: -0.82% Year-to-date Change: -45.5% | |
| VIOT Links: Profile News Message Board | |
| Charts:- Daily , Weekly | |
| Add VIOT to Watchlist: View: Get Complete VIOT Trend Analysis ➞ | |
| For tabular summary view of above stock list: Summary View ➞ 0 - 25 , 25 - 50 , 50 - 75 , 75 - 100 , 100 - 125 , 125 - 150 | ||
| Click To Change The Sort Order: By Market Cap or Company Size Performance: Year-to-date, Week and Day | |
| Select Chart Type: | ||
|
Best Stocks Today 12Stocks.com |
© 2024 12Stocks.com Terms & Conditions Privacy Contact Us
All Information Provided Only For Education And Not To Be Used For Investing or Trading. See Terms & Conditions


One More Thing ... Get Best Stocks Delivered Daily!
Never Ever Miss A Move With Our Top Ten Stocks Lists
Find Best Stocks In Any Market - Bull or Bear Market
Take A Peek At Our Top Ten Stocks Lists: Daily, Weekly, Year-to-Date & Top Trends
Find Best Stocks In Any Market - Bull or Bear Market
Take A Peek At Our Top Ten Stocks Lists: Daily, Weekly, Year-to-Date & Top Trends
China Stocks With Best Up Trends [0-bearish to 100-bullish]: Full Truck[93], Bright Scholar[90], DouYu [90], GDS [88], GigaCloud [88], Smart Share[86], Lufax Holding[83], So-Young [83], U Power[76], Yatsen Holding[76], MingZhu Logistics[74]
Best China Stocks Year-to-Date:
U Power[2812.95%], DouYu [747.37%], MicroCloud Hologram[664.03%], China Liberal[476.51%], Zhongchao [412.19%], Yatsen Holding[394.12%], Uxin [141.08%], QuantaSing [117.28%], GigaCloud [95.49%], Bright Scholar[60.8%], Cheetah Mobile[55.26%] Best China Stocks This Week:
Regencell Bioscience[37.01%], Yatsen Holding[20.1%], MingZhu Logistics[17.48%], Secoo Holding[17.14%], Zhongchao [14.02%], TH [10%], Smart Share[9.26%], Bright Scholar[9.24%], Quhuo [8.87%], DouYu [6.62%], China Liberal[6.27%] Best China Stocks Daily:
Hywin [17.78%], MingZhu Logistics[10.31%], Lanvin [8.39%], Bright Scholar[6.91%], MOGU [5.85%], Cheetah Mobile[5.04%], Dingdong (Cayman)[4.91%], Secoo Holding[4.75%], Fanhua [4.69%], Shengfeng Development[3.77%], Burning Rock[3.52%]