
 Login Sign Up


| |||||
 |  | ||||

| 12Stocks.com Market Intelligence |
Best China Stocks
|
On this page, you will find the most comprehensive analysis of Chinese stocks and ETFs - from latest trends to performances to charts ➞. First, here are the year-to-date (YTD) performances of the most requested China stocks at 12Stocks.com (click stock for review):
| Alibaba 34% | ||
| Weibo 32% | ||
| NetEase 32% | ||
| Vipshop 31% | ||
| Sohu.com 18% | ||
| Baidu 8% | ||
| JD.com -22% | ||
| New Oriental -26% | ||
| In a hurry? China Stocks Lists: Performance Trends Table, Stock Charts
Sort China stocks: Daily, Weekly, Year-to-Date, Market Cap & Trends. Filter China stocks list by sector: Show all, Tech, Finance, Energy, Staples, Retail, Industrial, Materials, Utilities and HealthCare Filter China stocks list by size: All China Large Medium Small and MicroCap |
| September 5, 2025 - 12Stocks.com China Stocks Performances & Trends Daily | |||||||||
|
|  The overall Smart Investing & Trading Score is 40 (0-bearish to 100-bullish) which puts China index in short term bearish to neutral trend. The Smart Investing & Trading Score from previous trading session is 90 and hence a deterioration of trend.
| ||||||||
Here are the Smart Investing & Trading Scores of the most requested China stocks at 12Stocks.com (click stock name for detailed review):
|


| 12Stocks.com: Top Performing China Index Stocks | |||||||||||||||||||||||||||||||||||||||||||||||
 The top performing China Index stocks year to date are
Now, more recently, over last week, the top performing China Index stocks on the move are


|
|||||||||||||||||||||||||||||||||||||||||||||||
| 12Stocks.com: Investing in China Index with Stocks | |
|
The following table helps investors and traders sort through current performance and trends (as measured by Smart Investing & Trading Score) of various
stocks in the China Index. Quick View: Move mouse or cursor over stock symbol (ticker) to view short-term technical chart and over stock name to view long term chart. Click on  to add stock symbol to your watchlist and to add stock symbol to your watchlist and  to view watchlist. Click on any ticker or stock name for detailed market intelligence report for that stock. to view watchlist. Click on any ticker or stock name for detailed market intelligence report for that stock. |
12Stocks.com Performance of Stocks in China Index
| Ticker | Stock Name | Watchlist | Category | Recent Price | Smart Investing & Trading Score | Change % | YTD Change% |
| TOUR | Tuniu |   | Consumer Staples | 0.87 | 100 | 10.24% | -14.36% |
| YMM | Full Truck | | Technology | 13.05 | 100 | 9.81% | 11.74% |
| BZ | Kanzhun | | Industrials | 23.63 | 100 | 6.61% | 70.58% |
| BZUN | Baozun | | Services & Goods | 3.39 | 100 | 2.51% | 5.15% |
| IQ | iQIYI | | Technology | 2.65 | 100 | 2.17% | 16.92% |
| BIDU | Baidu | | Technology | 98.21 | 100 | 1.88% | 8.40% |
| EM | Smart Share | | Services & Goods | 1.32 | 100 | 1.52% | 86.11% |
| YQ | 17 Education | | Consumer Staples | 1.96 | 100 | 0.76% | 24.84% |
| COE | China Online | | Services & Goods | 35.52 | 100 | 0.65% | 72.50% |
| RLX | RLX | | Consumer Staples | 2.54 | 100 | 0.00% | 3.70% |
| MLCO | Melco Resorts | | Services & Goods | 9.94 | 100 | -0.45% | 54.06% |
| FENG | Phoenix New | | Technology | 2.39 | 100 | -0.88% | -5.49% |
| DQ | Daqo New | | Technology | 25.35 | 100 | -1.58% | 15.59% |
| QH | Quhuo | | Technology | 4.76 | 100 | -40.21% | -95.75% |
| LXEH | Lixiang Education | | Consumer Staples | 2.02 | 90 | 7.32% | -73.99% |
| PDD | Pinduoduo | | Services & Goods | 120.22 | 90 | 4.20% | 26.78% |
| HUYA | HUYA | | Services & Goods | 3.58 | 90 | 4.08% | 85.69% |
| DUO | Fangdd Network | | Financials | 2.39 | 90 | 3.41% | -85.79% |
| BQ | Boqii Holding | | Services & Goods | 2.91 | 90 | 3.14% | -27.78% |
| MOGU | MOGU | | Services & Goods | 2.39 | 90 | 2.36% | 0.00% |
| TCOM | Trip.com | | Services & Goods | 73.75 | 90 | 0.70% | -6.89% |
| SDA | SunCar | | Services & Goods | 2.60 | 90 | -0.87% | -76.27% |
| XNET | Xunlei | | Technology | 7.23 | 90 | -0.96% | 264.32% |
| XIN | Xinyuan Real | | Financials | 2.01 | 90 | -3.35% | -28.98% |
| LANV | Lanvin | | Services & Goods | 2.09 | 90 | -5.02% | 3.48% |
| For chart view version of above stock list: Chart View ➞ 0 - 25 , 25 - 50 , 50 - 75 , 75 - 100 , 100 - 125 | ||
 | Click To Change The Sort Order: By Market Cap or Company Size Performance: Year-to-date, Week and Day |  |
|
Get the most comprehensive stock market coverage daily at 12Stocks.com ➞ Best Stocks Today ➞ Best Stocks Weekly ➞ Best Stocks Year-to-Date ➞ Best Stocks Trends ➞  Best Stocks Today 12Stocks.com Best Nasdaq Stocks ➞ Best S&P 500 Stocks ➞ Best Tech Stocks ➞ Best Biotech Stocks ➞ |
| Detailed Overview of China Stocks |
| China Technical Overview, Leaders & Laggards, Top China ETF Funds & Detailed China Stocks List, Charts, Trends & More |
| China: Technical Analysis, Trends & YTD Performance | |
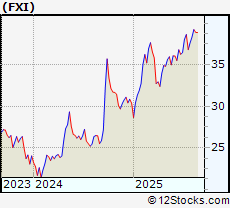
 FXI Weekly Chart |
|
| Long Term Trend: Very Good | |
| Medium Term Trend: Deteriorating | |
 FXI Daily Chart |
|
| Short Term Trend: Not Good | |
| Overall Trend Score: 40 | |
| YTD Performance: 20.19% | |
| **Trend Scores & Views Are Only For Educational Purposes And Not For Investing | |
| 12Stocks.com: Investing in China Index using Exchange Traded Funds | |
|
The following table shows list of key exchange traded funds (ETF) that
help investors play China stock market. For detailed view, check out our ETF Funds section of our website. Quick View: Move mouse or cursor over ETF symbol (ticker) to view short-term technical chart and over ETF name to view long term chart. Click on ticker or stock name for detailed view. Click on to add stock symbol to your watchlist and to view watchlist. |
12Stocks.com List of ETFs that track China Index
| Ticker | ETF Name | Watchlist | Recent Price | Smart Investing & Trading Score | Change % | Week % | Year-to-date % |
| FXI | China Large-Cap | | 38.33 | 40 | -1.49 | -1.49 | 20.19% |
| EWH | Hong Kong | | 21.16 | 30 | 1.46 | 1.37 | 33% |
| HAO | China Small Cap | | 1.17 | 20 | 3.42 | 1.68 | -51.6% |
| YINN | China Bull 3X | | 46.80 | 30 | 6.42 | 6.3 | 55.38% |
| YANG | China Bear 3X | | 25.72 | 60 | 0.49 | -0.15 | -60.96% |
| XPP | China 50 | | 27.62 | 30 | 4.34 | 4.3 | 42.61% |
| MCHI | China | | 61.31 | 60 | 0.13 | 1.18 | 29.31% |
| GXC | China | | 98.55 | 60 | 0.22 | 1.96 | 26.85% |
| CBON | ChinaAMC China Bond | | 22.51 | 70 | 0.02 | -0.22 | 1.79% |
| 12Stocks.com: Charts, Trends, Fundamental Data and Performances of China Stocks | |
|
We now take in-depth look at all China stocks including charts, multi-period performances and overall trends (as measured by Smart Investing & Trading Score). One can sort China stocks (click link to choose) by Daily, Weekly and by Year-to-Date performances. Also, one can sort by size of the company or by market capitalization. |
| Select Your Default Chart Type: | |||||
| |||||
| Click on stock symbol or name for detailed view. Click on to add stock symbol to your watchlist and to view watchlist. Quick View: Move mouse or cursor over "Daily" to quickly view daily technical stock chart and over "Weekly" to view weekly technical stock chart. | |||||

 | TOUR Tuniu Corporation |
| Sector: Consumer Staples | |
| SubSector: Recreational Goods, Other | |
| MarketCap: 124.459 Millions | |
| Recent Price: 0.87 Smart Investing & Trading Score: 100 | |
| Day Percent Change: 10.24% Day Change: 0.08 | |
| Week Change: 4.2% Year-to-date Change: -14.4% | |
| TOUR Links: Profile News Message Board | |
| Charts:- Daily , Weekly | |
| Add TOUR to Watchlist: View: Get Complete TOUR Trend Analysis ➞ | |
 | YMM Full Truck Alliance Co. Ltd. |
| Sector: Technology | |
| SubSector: Software - Application | |
| MarketCap: 6960 Millions | |
| Recent Price: 13.05 Smart Investing & Trading Score: 100 | |
| Day Percent Change: 9.81% Day Change: 1.08 | |
| Week Change: 12.26% Year-to-date Change: 11.7% | |
| YMM Links: Profile News Message Board | |
| Charts:- Daily , Weekly | |
| Add YMM to Watchlist: View: Get Complete YMM Trend Analysis ➞ | |
 | BZ Kanzhun Limited |
| Sector: Industrials | |
| SubSector: Staffing & Employment Services | |
| MarketCap: 6680 Millions | |
| Recent Price: 23.63 Smart Investing & Trading Score: 100 | |
| Day Percent Change: 6.61% Day Change: 1.46 | |
| Week Change: 10.41% Year-to-date Change: 70.6% | |
| BZ Links: Profile News Message Board | |
| Charts:- Daily , Weekly | |
| Add BZ to Watchlist: View: Get Complete BZ Trend Analysis ➞ | |
 | BZUN Baozun Inc. |
| Sector: Services & Goods | |
| SubSector: Catalog & Mail Order Houses | |
| MarketCap: 1668.92 Millions | |
| Recent Price: 3.39 Smart Investing & Trading Score: 100 | |
| Day Percent Change: 2.51% Day Change: 0.07 | |
| Week Change: 4% Year-to-date Change: 5.2% | |
| BZUN Links: Profile News Message Board | |
| Charts:- Daily , Weekly | |
| Add BZUN to Watchlist: View: Get Complete BZUN Trend Analysis ➞ | |
 | IQ iQIYI, Inc. |
| Sector: Technology | |
| SubSector: Internet Information Providers | |
| MarketCap: 13591.5 Millions | |
| Recent Price: 2.65 Smart Investing & Trading Score: 100 | |
| Day Percent Change: 2.17% Day Change: 0.05 | |
| Week Change: 23.04% Year-to-date Change: 16.9% | |
| IQ Links: Profile News Message Board | |
| Charts:- Daily , Weekly | |
| Add IQ to Watchlist: View: Get Complete IQ Trend Analysis ➞ | |
 | BIDU Baidu, Inc. |
| Sector: Technology | |
| SubSector: Internet Information Providers | |
| MarketCap: 33525.9 Millions | |
| Recent Price: 98.21 Smart Investing & Trading Score: 100 | |
| Day Percent Change: 1.88% Day Change: 1.81 | |
| Week Change: 3.05% Year-to-date Change: 8.4% | |
| BIDU Links: Profile News Message Board | |
| Charts:- Daily , Weekly | |
| Add BIDU to Watchlist: View: Get Complete BIDU Trend Analysis ➞ | |
 | EM Smart Share Global Limited |
| Sector: Services & Goods | |
| SubSector: Personal Services | |
| MarketCap: 238 Millions | |
| Recent Price: 1.32 Smart Investing & Trading Score: 100 | |
| Day Percent Change: 1.52% Day Change: 0.02 | |
| Week Change: 14.53% Year-to-date Change: 86.1% | |
| EM Links: Profile News Message Board | |
| Charts:- Daily , Weekly | |
| Add EM to Watchlist: View: Get Complete EM Trend Analysis ➞ | |
 | YQ 17 Education & Technology Group Inc. |
| Sector: Consumer Staples | |
| SubSector: Education & Training Services | |
| MarketCap: 32347 Millions | |
| Recent Price: 1.96 Smart Investing & Trading Score: 100 | |
| Day Percent Change: 0.76% Day Change: 0.01 | |
| Week Change: 1.79% Year-to-date Change: 24.8% | |
| YQ Links: Profile News Message Board | |
| Charts:- Daily , Weekly | |
| Add YQ to Watchlist: View: Get Complete YQ Trend Analysis ➞ | |
 | COE China Online Education Group |
| Sector: Services & Goods | |
| SubSector: Education & Training Services | |
| MarketCap: 643.406 Millions | |
| Recent Price: 35.52 Smart Investing & Trading Score: 100 | |
| Day Percent Change: 0.65% Day Change: 0.23 | |
| Week Change: 9.58% Year-to-date Change: 72.5% | |
| COE Links: Profile News Message Board | |
| Charts:- Daily , Weekly | |
| Add COE to Watchlist: View: Get Complete COE Trend Analysis ➞ | |
 | RLX RLX Technology Inc. |
| Sector: Consumer Staples | |
| SubSector: Tobacco | |
| MarketCap: 2800 Millions | |
| Recent Price: 2.54 Smart Investing & Trading Score: 100 | |
| Day Percent Change: 0% Day Change: 0 | |
| Week Change: 4.67% Year-to-date Change: 3.7% | |
| RLX Links: Profile News Message Board | |
| Charts:- Daily , Weekly | |
| Add RLX to Watchlist: View: Get Complete RLX Trend Analysis ➞ | |
 | MLCO Melco Resorts & Entertainment Limited |
| Sector: Services & Goods | |
| SubSector: Resorts & Casinos | |
| MarketCap: 7031.14 Millions | |
| Recent Price: 9.94 Smart Investing & Trading Score: 100 | |
| Day Percent Change: -0.45% Day Change: -0.04 | |
| Week Change: 4.69% Year-to-date Change: 54.1% | |
| MLCO Links: Profile News Message Board | |
| Charts:- Daily , Weekly | |
| Add MLCO to Watchlist: View: Get Complete MLCO Trend Analysis ➞ | |
 | FENG Phoenix New Media Limited |
| Sector: Technology | |
| SubSector: Internet Information Providers | |
| MarketCap: 107.08 Millions | |
| Recent Price: 2.39 Smart Investing & Trading Score: 100 | |
| Day Percent Change: -0.88% Day Change: -0.02 | |
| Week Change: 1.82% Year-to-date Change: -5.5% | |
| FENG Links: Profile News Message Board | |
| Charts:- Daily , Weekly | |
| Add FENG to Watchlist: View: Get Complete FENG Trend Analysis ➞ | |
 | DQ Daqo New Energy Corp. |
| Sector: Technology | |
| SubSector: Semiconductor Equipment & Materials | |
| MarketCap: 660.918 Millions | |
| Recent Price: 25.35 Smart Investing & Trading Score: 100 | |
| Day Percent Change: -1.58% Day Change: -0.36 | |
| Week Change: 5.69% Year-to-date Change: 15.6% | |
| DQ Links: Profile News Message Board | |
| Charts:- Daily , Weekly | |
| Add DQ to Watchlist: View: Get Complete DQ Trend Analysis ➞ | |
 | QH Quhuo Limited |
| Sector: Technology | |
| SubSector: Software Application | |
| MarketCap: 37787 Millions | |
| Recent Price: 4.76 Smart Investing & Trading Score: 100 | |
| Day Percent Change: -40.21% Day Change: -0.04 | |
| Week Change: -45.57% Year-to-date Change: -95.8% | |
| QH Links: Profile News Message Board | |
| Charts:- Daily , Weekly | |
| Add QH to Watchlist: View: Get Complete QH Trend Analysis ➞ | |
 | LXEH Lixiang Education Holding Co., Ltd. |
| Sector: Consumer Staples | |
| SubSector: Education & Training Services | |
| MarketCap: 12347 Millions | |
| Recent Price: 2.02 Smart Investing & Trading Score: 90 | |
| Day Percent Change: 7.32% Day Change: 0.09 | |
| Week Change: 4.76% Year-to-date Change: -74.0% | |
| LXEH Links: Profile News Message Board | |
| Charts:- Daily , Weekly | |
| Add LXEH to Watchlist: View: Get Complete LXEH Trend Analysis ➞ | |
 | PDD Pinduoduo Inc. |
| Sector: Services & Goods | |
| SubSector: Specialty Retail, Other | |
| MarketCap: 41696.2 Millions | |
| Recent Price: 120.22 Smart Investing & Trading Score: 90 | |
| Day Percent Change: 4.2% Day Change: 4.96 | |
| Week Change: 7.16% Year-to-date Change: 26.8% | |
| PDD Links: Profile News Message Board | |
| Charts:- Daily , Weekly | |
| Add PDD to Watchlist: View: Get Complete PDD Trend Analysis ➞ | |
 | HUYA HUYA Inc. |
| Sector: Services & Goods | |
| SubSector: Entertainment - Diversified | |
| MarketCap: 3358.17 Millions | |
| Recent Price: 3.58 Smart Investing & Trading Score: 90 | |
| Day Percent Change: 4.08% Day Change: 0.13 | |
| Week Change: 0.61% Year-to-date Change: 85.7% | |
| HUYA Links: Profile News Message Board | |
| Charts:- Daily , Weekly | |
| Add HUYA to Watchlist: View: Get Complete HUYA Trend Analysis ➞ | |
 | DUO Fangdd Network Group Ltd. |
| Sector: Financials | |
| SubSector: Property Management | |
| MarketCap: 783.142 Millions | |
| Recent Price: 2.39 Smart Investing & Trading Score: 90 | |
| Day Percent Change: 3.41% Day Change: 0.04 | |
| Week Change: -17.58% Year-to-date Change: -85.8% | |
| DUO Links: Profile News Message Board | |
| Charts:- Daily , Weekly | |
| Add DUO to Watchlist: View: Get Complete DUO Trend Analysis ➞ | |
 | BQ Boqii Holding Limited |
| Sector: Services & Goods | |
| SubSector: Specialty Retail | |
| MarketCap: 33027 Millions | |
| Recent Price: 2.91 Smart Investing & Trading Score: 90 | |
| Day Percent Change: 3.14% Day Change: 0.08 | |
| Week Change: 6.12% Year-to-date Change: -27.8% | |
| BQ Links: Profile News Message Board | |
| Charts:- Daily , Weekly | |
| Add BQ to Watchlist: View: Get Complete BQ Trend Analysis ➞ | |
 | MOGU MOGU Inc. |
| Sector: Services & Goods | |
| SubSector: Specialty Retail, Other | |
| MarketCap: 168.844 Millions | |
| Recent Price: 2.39 Smart Investing & Trading Score: 90 | |
| Day Percent Change: 2.36% Day Change: 0.05 | |
| Week Change: -8.82% Year-to-date Change: 0.0% | |
| MOGU Links: Profile News Message Board | |
| Charts:- Daily , Weekly | |
| Add MOGU to Watchlist: View: Get Complete MOGU Trend Analysis ➞ | |
 | TCOM Trip.com Group Limited |
| Sector: Services & Goods | |
| SubSector: Lodging | |
| MarketCap: 13449.6 Millions | |
| Recent Price: 73.75 Smart Investing & Trading Score: 90 | |
| Day Percent Change: 0.7% Day Change: 0.44 | |
| Week Change: 5.49% Year-to-date Change: -6.9% | |
| TCOM Links: Profile News Message Board | |
| Charts:- Daily , Weekly | |
| Add TCOM to Watchlist: View: Get Complete TCOM Trend Analysis ➞ | |
 | SDA SunCar Technology Group Inc. |
| Sector: Services & Goods | |
| SubSector: Auto & Truck Dealerships | |
| MarketCap: 2680 Millions | |
| Recent Price: 2.60 Smart Investing & Trading Score: 90 | |
| Day Percent Change: -0.87% Day Change: -0.02 | |
| Week Change: -2.97% Year-to-date Change: -76.3% | |
| SDA Links: Profile News Message Board | |
| Charts:- Daily , Weekly | |
| Add SDA to Watchlist: View: Get Complete SDA Trend Analysis ➞ | |
 | XNET Xunlei Limited |
| Sector: Technology | |
| SubSector: Application Software | |
| MarketCap: 203.662 Millions | |
| Recent Price: 7.23 Smart Investing & Trading Score: 90 | |
| Day Percent Change: -0.96% Day Change: -0.07 | |
| Week Change: 43.56% Year-to-date Change: 264.3% | |
| XNET Links: Profile News Message Board | |
| Charts:- Daily , Weekly | |
| Add XNET to Watchlist: View: Get Complete XNET Trend Analysis ➞ | |
 | XIN Xinyuan Real Estate Co., Ltd. |
| Sector: Financials | |
| SubSector: Real Estate Development | |
| MarketCap: 136.119 Millions | |
| Recent Price: 2.01 Smart Investing & Trading Score: 90 | |
| Day Percent Change: -3.35% Day Change: -0.06 | |
| Week Change: -0.79% Year-to-date Change: -29.0% | |
| XIN Links: Profile News Message Board | |
| Charts:- Daily , Weekly | |
| Add XIN to Watchlist: View: Get Complete XIN Trend Analysis ➞ | |
 | LANV Lanvin Group Holdings Limited |
| Sector: Services & Goods | |
| SubSector: Luxury Goods | |
| MarketCap: 712 Millions | |
| Recent Price: 2.09 Smart Investing & Trading Score: 90 | |
| Day Percent Change: -5.02% Day Change: -0.11 | |
| Week Change: -10.73% Year-to-date Change: 3.5% | |
| LANV Links: Profile News Message Board | |
| Charts:- Daily , Weekly | |
| Add LANV to Watchlist: View: Get Complete LANV Trend Analysis ➞ | |
| For tabular summary view of above stock list: Summary View ➞ 0 - 25 , 25 - 50 , 50 - 75 , 75 - 100 , 100 - 125 | ||
| Click To Change The Sort Order: By Market Cap or Company Size Performance: Year-to-date, Week and Day | |
| Select Chart Type: | ||
|
Best Stocks Today 12Stocks.com |
© 2025 12Stocks.com Terms & Conditions Privacy Contact Us
All Information Provided Only For Education And Not To Be Used For Investing or Trading. See Terms & Conditions


One More Thing ... Get Best Stocks Delivered Daily!
Never Ever Miss A Move With Our Top Ten Stocks Lists
Find Best Stocks In Any Market - Bull or Bear Market
Take A Peek At Our Top Ten Stocks Lists: Daily, Weekly, Year-to-Date & Top Trends
Find Best Stocks In Any Market - Bull or Bear Market
Take A Peek At Our Top Ten Stocks Lists: Daily, Weekly, Year-to-Date & Top Trends
China Stocks With Best Up Trends [0-bearish to 100-bullish]: Full Truck[100], Kanzhun [100], Baozun [100], iQIYI [100], Baidu [100], Smart Share[100], 17 Education[100], China Online[100], RLX [100], Melco Resorts[100], Daqo New[100]
Best China Stocks Year-to-Date:
Regencell Bioscience[9561.54%], I Mab[454.12%], So-Young [384.74%], QuantaSing [269.91%], Xunlei [264.32%], OneConnect Financial[205.35%], Niu [159.78%], Viomi [154.48%], Yatsen Holding[141.21%], Tencent Music[120.18%], XPeng [92.47%] Best China Stocks This Week:
Xunlei [43.56%], Burning Rock[41.87%], NIO [24.49%], iQIYI [23.04%], Zhihu [18.1%], XPeng [17.39%], Smart Share[14.53%], Cheetah Mobile[13.59%], MINISO [13.58%], QuantaSing [13.01%], Full Truck[12.26%] Best China Stocks Daily:
X Financial[15.73%], XPeng [11.68%], Full Truck[9.81%], Viomi [9.39%], NIO [9.27%], CNFinance [7.77%], Lixiang Education[7.32%], Kanzhun [6.61%], MINISO [6.38%], Burning Rock[6.02%], FinVolution [5.55%]