
 Login Sign Up


| |||||
 |  | ||||

| 12Stocks.com Market Intelligence |
Best China Stocks
|
On this page, you will find the most comprehensive analysis of Chinese stocks and ETFs - from latest trends to performances to charts ➞. First, here are the year-to-date (YTD) performances of the most requested China stocks at 12Stocks.com (click stock for review):
| Alibaba 34% | ||
| Weibo 32% | ||
| NetEase 32% | ||
| Vipshop 31% | ||
| Sohu.com 18% | ||
| Baidu 8% | ||
| JD.com -22% | ||
| New Oriental -26% | ||
| In a hurry? China Stocks Lists: Performance Trends Table, Stock Charts
Sort China stocks: Daily, Weekly, Year-to-Date, Market Cap & Trends. Filter China stocks list by sector: Show all, Tech, Finance, Energy, Staples, Retail, Industrial, Materials, Utilities and HealthCare Filter China stocks list by size: All China Large Medium Small and MicroCap |
| September 5, 2025 - 12Stocks.com China Stocks Performances & Trends Daily | |||||||||
|
|  The overall Smart Investing & Trading Score is 40 (0-bearish to 100-bullish) which puts China index in short term bearish to neutral trend. The Smart Investing & Trading Score from previous trading session is 90 and hence a deterioration of trend.
| ||||||||
Here are the Smart Investing & Trading Scores of the most requested China stocks at 12Stocks.com (click stock name for detailed review):
|


| 12Stocks.com: Top Performing China Index Stocks | |||||||||||||||||||||||||||||||||||||||||||||||
 The top performing China Index stocks year to date are
Now, more recently, over last week, the top performing China Index stocks on the move are


|
|||||||||||||||||||||||||||||||||||||||||||||||
| 12Stocks.com: Investing in China Index with Stocks | |
|
The following table helps investors and traders sort through current performance and trends (as measured by Smart Investing & Trading Score) of various
stocks in the China Index. Quick View: Move mouse or cursor over stock symbol (ticker) to view short-term technical chart and over stock name to view long term chart. Click on  to add stock symbol to your watchlist and to add stock symbol to your watchlist and  to view watchlist. Click on any ticker or stock name for detailed market intelligence report for that stock. to view watchlist. Click on any ticker or stock name for detailed market intelligence report for that stock. |
12Stocks.com Performance of Stocks in China Index
| Ticker | Stock Name | Watchlist | Category | Recent Price | Smart Investing & Trading Score | Change % | YTD Change% |
| RGC | Regencell Bioscience |   | Health Care | 14.05 | 20 | 1.87% | NA |
| QSG | QuantaSing | | Consumer Staples | 8.11 | 46 | 3.90% | 269.91% |
| XNET | Xunlei | | Technology | 7.23 | 90 | -0.96% | 264.32% |
| NIU | Niu | | Consumer Staples | 4.37 | 30 | 2.42% | 159.78% |
| VIOT | Viomi | | Technology | 3.50 | 20 | 9.39% | 154.48% |
| JFIN | Jiayin | | Technology | 12.58 | 0 | 8.41% | 118.28% |
| EM | Smart Share | | Services & Goods | 1.32 | 100 | 1.52% | 86.11% |
| XYF | X Financial | | Financials | 15.20 | 50 | 15.73% | 80.17% |
| STG | Sunlands | | Services & Goods | 9.51 | 20 | 2.18% | 74.16% |
| COE | China Online | | Services & Goods | 35.52 | 100 | 0.65% | 72.50% |
| QD | Qudian | | Technology | 4.56 | 40 | -3.88% | 67.02% |
| GCT | GigaCloud | | Technology | 26.47 | 50 | -5.22% | 61.72% |
| RERE | ATRenew | | Services & Goods | 4.72 | 50 | 1.97% | 61.46% |
| WDH | Waterdrop | | Financials | 1.72 | 80 | -0.56% | 51.92% |
| ZH | Zhihu | | Services & Goods | 4.80 | 70 | 1.43% | 40.11% |
| FINV | FinVolution | | Financials | 8.25 | 0 | 5.55% | 39.54% |
| KRKR | 36Kr | | Technology | 4.90 | 60 | -5.33% | 35.24% |
| KNDI | Kandi | | Consumer Staples | 1.46 | 60 | -4.24% | 31.67% |
| JG | Aurora Mobile | | Technology | 10.39 | 20 | 2.90% | 30.43% |
| TWN | Taiwan Fund | | Financials | 50.25 | 70 | 0.43% | 25.90% |
| YRD | Yiren Digital | | Financials | 5.82 | 0 | 3.60% | 25.83% |
| CMCM | Cheetah Mobile | | Technology | 6.01 | 80 | 2.75% | 21.74% |
| SOHU | Sohu.com | | Technology | 16.07 | 50 | 1.77% | 17.83% |
| DQ | Daqo New | | Technology | 25.35 | 100 | -1.58% | 15.59% |
| YI | 111 | | Services & Goods | 6.43 | 10 | -2.93% | 14.37% |
| For chart view version of above stock list: Chart View ➞ 0 - 25 , 25 - 50 , 50 - 75 | ||
 | Click To Change The Sort Order: By Market Cap or Company Size Performance: Year-to-date, Week and Day |  |
|
Get the most comprehensive stock market coverage daily at 12Stocks.com ➞ Best Stocks Today ➞ Best Stocks Weekly ➞ Best Stocks Year-to-Date ➞ Best Stocks Trends ➞  Best Stocks Today 12Stocks.com Best Nasdaq Stocks ➞ Best S&P 500 Stocks ➞ Best Tech Stocks ➞ Best Biotech Stocks ➞ |
| Detailed Overview of China Stocks |
| China Technical Overview, Leaders & Laggards, Top China ETF Funds & Detailed China Stocks List, Charts, Trends & More |
| China: Technical Analysis, Trends & YTD Performance | |
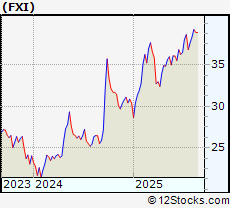
 FXI Weekly Chart |
|
| Long Term Trend: Very Good | |
| Medium Term Trend: Deteriorating | |
 FXI Daily Chart |
|
| Short Term Trend: Not Good | |
| Overall Trend Score: 40 | |
| YTD Performance: 20.19% | |
| **Trend Scores & Views Are Only For Educational Purposes And Not For Investing | |
| 12Stocks.com: Investing in China Index using Exchange Traded Funds | |
|
The following table shows list of key exchange traded funds (ETF) that
help investors play China stock market. For detailed view, check out our ETF Funds section of our website. Quick View: Move mouse or cursor over ETF symbol (ticker) to view short-term technical chart and over ETF name to view long term chart. Click on ticker or stock name for detailed view. Click on to add stock symbol to your watchlist and to view watchlist. |
12Stocks.com List of ETFs that track China Index
| Ticker | ETF Name | Watchlist | Recent Price | Smart Investing & Trading Score | Change % | Week % | Year-to-date % |
| FXI | China Large-Cap | | 38.33 | 40 | -1.49 | -1.49 | 20.19% |
| EWH | Hong Kong | | 21.16 | 30 | 1.46 | 1.37 | 33% |
| HAO | China Small Cap | | 1.17 | 20 | 3.42 | 1.68 | -51.6% |
| YINN | China Bull 3X | | 46.80 | 30 | 6.42 | 6.3 | 55.38% |
| YANG | China Bear 3X | | 25.72 | 60 | 0.49 | -0.15 | -60.96% |
| XPP | China 50 | | 27.62 | 30 | 4.34 | 4.3 | 42.61% |
| MCHI | China | | 61.31 | 60 | 0.13 | 1.18 | 29.31% |
| GXC | China | | 98.55 | 60 | 0.22 | 1.96 | 26.85% |
| CBON | ChinaAMC China Bond | | 22.51 | 70 | 0.02 | -0.22 | 1.79% |
| 12Stocks.com: Charts, Trends, Fundamental Data and Performances of China Stocks | |
|
We now take in-depth look at all China stocks including charts, multi-period performances and overall trends (as measured by Smart Investing & Trading Score). One can sort China stocks (click link to choose) by Daily, Weekly and by Year-to-Date performances. Also, one can sort by size of the company or by market capitalization. |
| Select Your Default Chart Type: | |||||
| |||||
| Click on stock symbol or name for detailed view. Click on to add stock symbol to your watchlist and to view watchlist. Quick View: Move mouse or cursor over "Daily" to quickly view daily technical stock chart and over "Weekly" to view weekly technical stock chart. | |||||

 | RGC Regencell Bioscience Holdings Limited |
| Sector: Health Care | |
| SubSector: Drug Manufacturers - Specialty & Generic | |
| MarketCap: 284 Millions | |
| Recent Price: 14.05 Smart Investing & Trading Score: 20 | |
| Day Percent Change: 1.87% Day Change: 0.23 | |
| Week Change: -1.1% Year-to-date Change: 9,561.5% | |
| RGC Links: Profile News Message Board | |
| Charts:- Daily , Weekly | |
| Add RGC to Watchlist: View: Get Complete RGC Trend Analysis ➞ | |
 | QSG QuantaSing Group Limited |
| Sector: Consumer Staples | |
| SubSector: Education & Training Services | |
| MarketCap: 433 Millions | |
| Recent Price: 8.11 Smart Investing & Trading Score: 46 | |
| Day Percent Change: 3.9% Day Change: 0.3 | |
| Week Change: 13.01% Year-to-date Change: 269.9% | |
| QSG Links: Profile News Message Board | |
| Charts:- Daily , Weekly | |
| Add QSG to Watchlist: View: Get Complete QSG Trend Analysis ➞ | |
 | XNET Xunlei Limited |
| Sector: Technology | |
| SubSector: Application Software | |
| MarketCap: 203.662 Millions | |
| Recent Price: 7.23 Smart Investing & Trading Score: 90 | |
| Day Percent Change: -0.96% Day Change: -0.07 | |
| Week Change: 43.56% Year-to-date Change: 264.3% | |
| XNET Links: Profile News Message Board | |
| Charts:- Daily , Weekly | |
| Add XNET to Watchlist: View: Get Complete XNET Trend Analysis ➞ | |
 | NIU Niu Technologies |
| Sector: Consumer Staples | |
| SubSector: Auto Manufacturers - Major | |
| MarketCap: 543.271 Millions | |
| Recent Price: 4.37 Smart Investing & Trading Score: 30 | |
| Day Percent Change: 2.42% Day Change: 0.11 | |
| Week Change: -7.19% Year-to-date Change: 159.8% | |
| NIU Links: Profile News Message Board | |
| Charts:- Daily , Weekly | |
| Add NIU to Watchlist: View: Get Complete NIU Trend Analysis ➞ | |
 | VIOT Viomi Technology Co., Ltd |
| Sector: Technology | |
| SubSector: Electronic Equipment | |
| MarketCap: 357.2 Millions | |
| Recent Price: 3.50 Smart Investing & Trading Score: 20 | |
| Day Percent Change: 9.39% Day Change: 0.31 | |
| Week Change: -3.22% Year-to-date Change: 154.5% | |
| VIOT Links: Profile News Message Board | |
| Charts:- Daily , Weekly | |
| Add VIOT to Watchlist: View: Get Complete VIOT Trend Analysis ➞ | |
 | JFIN Jiayin Group Inc. |
| Sector: Technology | |
| SubSector: Internet Information Providers | |
| MarketCap: 131.48 Millions | |
| Recent Price: 12.58 Smart Investing & Trading Score: 0 | |
| Day Percent Change: 8.41% Day Change: 1.03 | |
| Week Change: 0.15% Year-to-date Change: 118.3% | |
| JFIN Links: Profile News Message Board | |
| Charts:- Daily , Weekly | |
| Add JFIN to Watchlist: View: Get Complete JFIN Trend Analysis ➞ | |
 | EM Smart Share Global Limited |
| Sector: Services & Goods | |
| SubSector: Personal Services | |
| MarketCap: 238 Millions | |
| Recent Price: 1.32 Smart Investing & Trading Score: 100 | |
| Day Percent Change: 1.52% Day Change: 0.02 | |
| Week Change: 14.53% Year-to-date Change: 86.1% | |
| EM Links: Profile News Message Board | |
| Charts:- Daily , Weekly | |
| Add EM to Watchlist: View: Get Complete EM Trend Analysis ➞ | |
 | XYF X Financial |
| Sector: Financials | |
| SubSector: Credit Services | |
| MarketCap: 168.008 Millions | |
| Recent Price: 15.20 Smart Investing & Trading Score: 50 | |
| Day Percent Change: 15.73% Day Change: 2.01 | |
| Week Change: 5.72% Year-to-date Change: 80.2% | |
| XYF Links: Profile News Message Board | |
| Charts:- Daily , Weekly | |
| Add XYF to Watchlist: View: Get Complete XYF Trend Analysis ➞ | |
 | STG Sunlands Technology Group |
| Sector: Services & Goods | |
| SubSector: Education & Training Services | |
| MarketCap: 295.706 Millions | |
| Recent Price: 9.51 Smart Investing & Trading Score: 20 | |
| Day Percent Change: 2.18% Day Change: 0.21 | |
| Week Change: -2.57% Year-to-date Change: 74.2% | |
| STG Links: Profile News Message Board | |
| Charts:- Daily , Weekly | |
| Add STG to Watchlist: View: Get Complete STG Trend Analysis ➞ | |
 | COE China Online Education Group |
| Sector: Services & Goods | |
| SubSector: Education & Training Services | |
| MarketCap: 643.406 Millions | |
| Recent Price: 35.52 Smart Investing & Trading Score: 100 | |
| Day Percent Change: 0.65% Day Change: 0.23 | |
| Week Change: 9.58% Year-to-date Change: 72.5% | |
| COE Links: Profile News Message Board | |
| Charts:- Daily , Weekly | |
| Add COE to Watchlist: View: Get Complete COE Trend Analysis ➞ | |
 | QD Qudian Inc. |
| Sector: Technology | |
| SubSector: Information Technology Services | |
| MarketCap: 544.968 Millions | |
| Recent Price: 4.56 Smart Investing & Trading Score: 40 | |
| Day Percent Change: -3.88% Day Change: -0.19 | |
| Week Change: 11.08% Year-to-date Change: 67.0% | |
| QD Links: Profile News Message Board | |
| Charts:- Daily , Weekly | |
| Add QD to Watchlist: View: Get Complete QD Trend Analysis ➞ | |
 | GCT GigaCloud Technology Inc. |
| Sector: Technology | |
| SubSector: Software - Infrastructure | |
| MarketCap: 240 Millions | |
| Recent Price: 26.47 Smart Investing & Trading Score: 50 | |
| Day Percent Change: -5.22% Day Change: -1.65 | |
| Week Change: -6.2% Year-to-date Change: 61.7% | |
| GCT Links: Profile News Message Board | |
| Charts:- Daily , Weekly | |
| Add GCT to Watchlist: View: Get Complete GCT Trend Analysis ➞ | |
 | RERE ATRenew Inc. |
| Sector: Services & Goods | |
| SubSector: Internet Retail | |
| MarketCap: 672 Millions | |
| Recent Price: 4.72 Smart Investing & Trading Score: 50 | |
| Day Percent Change: 1.97% Day Change: 0.09 | |
| Week Change: 9.67% Year-to-date Change: 61.5% | |
| RERE Links: Profile News Message Board | |
| Charts:- Daily , Weekly | |
| Add RERE to Watchlist: View: Get Complete RERE Trend Analysis ➞ | |
 | WDH Waterdrop Inc. |
| Sector: Financials | |
| SubSector: Insurance - Diversified | |
| MarketCap: 874 Millions | |
| Recent Price: 1.72 Smart Investing & Trading Score: 80 | |
| Day Percent Change: -0.56% Day Change: -0.01 | |
| Week Change: -1.67% Year-to-date Change: 51.9% | |
| WDH Links: Profile News Message Board | |
| Charts:- Daily , Weekly | |
| Add WDH to Watchlist: View: Get Complete WDH Trend Analysis ➞ | |
 | ZH Zhihu Inc. |
| Sector: Services & Goods | |
| SubSector: Internet Content & Information | |
| MarketCap: 741 Millions | |
| Recent Price: 4.80 Smart Investing & Trading Score: 70 | |
| Day Percent Change: 1.43% Day Change: 0.07 | |
| Week Change: 18.1% Year-to-date Change: 40.1% | |
| ZH Links: Profile News Message Board | |
| Charts:- Daily , Weekly | |
| Add ZH to Watchlist: View: Get Complete ZH Trend Analysis ➞ | |
 | FINV FinVolution Group |
| Sector: Financials | |
| SubSector: Credit Services | |
| MarketCap: 476.208 Millions | |
| Recent Price: 8.25 Smart Investing & Trading Score: 0 | |
| Day Percent Change: 5.55% Day Change: 0.48 | |
| Week Change: 3.51% Year-to-date Change: 39.5% | |
| FINV Links: Profile News Message Board | |
| Charts:- Daily , Weekly | |
| Add FINV to Watchlist: View: Get Complete FINV Trend Analysis ➞ | |
 | KRKR 36Kr Holdings Inc. |
| Sector: Technology | |
| SubSector: Internet Information Providers | |
| MarketCap: 173.18 Millions | |
| Recent Price: 4.90 Smart Investing & Trading Score: 60 | |
| Day Percent Change: -5.33% Day Change: -0.24 | |
| Week Change: -13.59% Year-to-date Change: 35.2% | |
| KRKR Links: Profile News Message Board | |
| Charts:- Daily , Weekly | |
| Add KRKR to Watchlist: View: Get Complete KRKR Trend Analysis ➞ | |
 | KNDI Kandi Technologies Group, Inc. |
| Sector: Consumer Staples | |
| SubSector: Auto Manufacturers - Major | |
| MarketCap: 137.471 Millions | |
| Recent Price: 1.46 Smart Investing & Trading Score: 60 | |
| Day Percent Change: -4.24% Day Change: -0.07 | |
| Week Change: 24.41% Year-to-date Change: 31.7% | |
| KNDI Links: Profile News Message Board | |
| Charts:- Daily , Weekly | |
| Add KNDI to Watchlist: View: Get Complete KNDI Trend Analysis ➞ | |
 | JG Aurora Mobile Limited |
| Sector: Technology | |
| SubSector: Application Software | |
| MarketCap: 268.762 Millions | |
| Recent Price: 10.39 Smart Investing & Trading Score: 20 | |
| Day Percent Change: 2.9% Day Change: 0.26 | |
| Week Change: 2.93% Year-to-date Change: 30.4% | |
| JG Links: Profile News Message Board | |
| Charts:- Daily , Weekly | |
| Add JG to Watchlist: View: Get Complete JG Trend Analysis ➞ | |
 | TWN The Taiwan Fund, Inc. |
| Sector: Financials | |
| SubSector: Closed-End Fund - Foreign | |
| MarketCap: 110.547 Millions | |
| Recent Price: 50.25 Smart Investing & Trading Score: 70 | |
| Day Percent Change: 0.43% Day Change: 0.21 | |
| Week Change: 1.48% Year-to-date Change: 25.9% | |
| TWN Links: Profile News Message Board | |
| Charts:- Daily , Weekly | |
| Add TWN to Watchlist: View: Get Complete TWN Trend Analysis ➞ | |
 | YRD Yiren Digital Ltd. |
| Sector: Financials | |
| SubSector: Credit Services | |
| MarketCap: 330.208 Millions | |
| Recent Price: 5.82 Smart Investing & Trading Score: 0 | |
| Day Percent Change: 3.6% Day Change: 0.21 | |
| Week Change: 2.37% Year-to-date Change: 25.8% | |
| YRD Links: Profile News Message Board | |
| Charts:- Daily , Weekly | |
| Add YRD to Watchlist: View: Get Complete YRD Trend Analysis ➞ | |
 | CMCM Cheetah Mobile Inc. |
| Sector: Technology | |
| SubSector: Application Software | |
| MarketCap: 343.362 Millions | |
| Recent Price: 6.01 Smart Investing & Trading Score: 80 | |
| Day Percent Change: 2.75% Day Change: 0.15 | |
| Week Change: 13.59% Year-to-date Change: 21.7% | |
| CMCM Links: Profile News Message Board | |
| Charts:- Daily , Weekly | |
| Add CMCM to Watchlist: View: Get Complete CMCM Trend Analysis ➞ | |
 | SOHU Sohu.com Limited |
| Sector: Technology | |
| SubSector: Internet Information Providers | |
| MarketCap: 243.48 Millions | |
| Recent Price: 16.07 Smart Investing & Trading Score: 50 | |
| Day Percent Change: 1.77% Day Change: 0.27 | |
| Week Change: -0.19% Year-to-date Change: 17.8% | |
| SOHU Links: Profile News Message Board | |
| Charts:- Daily , Weekly | |
| Add SOHU to Watchlist: View: Get Complete SOHU Trend Analysis ➞ | |
 | DQ Daqo New Energy Corp. |
| Sector: Technology | |
| SubSector: Semiconductor Equipment & Materials | |
| MarketCap: 660.918 Millions | |
| Recent Price: 25.35 Smart Investing & Trading Score: 100 | |
| Day Percent Change: -1.58% Day Change: -0.36 | |
| Week Change: 5.69% Year-to-date Change: 15.6% | |
| DQ Links: Profile News Message Board | |
| Charts:- Daily , Weekly | |
| Add DQ to Watchlist: View: Get Complete DQ Trend Analysis ➞ | |
 | YI 111, Inc. |
| Sector: Services & Goods | |
| SubSector: Drug Stores | |
| MarketCap: 520.351 Millions | |
| Recent Price: 6.43 Smart Investing & Trading Score: 10 | |
| Day Percent Change: -2.93% Day Change: -0.22 | |
| Week Change: 8.45% Year-to-date Change: 14.4% | |
| YI Links: Profile News Message Board | |
| Charts:- Daily , Weekly | |
| Add YI to Watchlist: View: Get Complete YI Trend Analysis ➞ | |
| For tabular summary view of above stock list: Summary View ➞ 0 - 25 , 25 - 50 , 50 - 75 | ||
| Click To Change The Sort Order: By Market Cap or Company Size Performance: Year-to-date, Week and Day | |
| Select Chart Type: | ||
|
Best Stocks Today 12Stocks.com |
© 2025 12Stocks.com Terms & Conditions Privacy Contact Us
All Information Provided Only For Education And Not To Be Used For Investing or Trading. See Terms & Conditions


One More Thing ... Get Best Stocks Delivered Daily!
Never Ever Miss A Move With Our Top Ten Stocks Lists
Find Best Stocks In Any Market - Bull or Bear Market
Take A Peek At Our Top Ten Stocks Lists: Daily, Weekly, Year-to-Date & Top Trends
Find Best Stocks In Any Market - Bull or Bear Market
Take A Peek At Our Top Ten Stocks Lists: Daily, Weekly, Year-to-Date & Top Trends
China Stocks With Best Up Trends [0-bearish to 100-bullish]: Full Truck[100], Kanzhun [100], Baozun [100], iQIYI [100], Baidu [100], Smart Share[100], 17 Education[100], China Online[100], RLX [100], Melco Resorts[100], Daqo New[100]
Best China Stocks Year-to-Date:
Regencell Bioscience[9561.54%], I Mab[454.12%], So-Young [384.74%], QuantaSing [269.91%], Xunlei [264.32%], OneConnect Financial[205.35%], Niu [159.78%], Viomi [154.48%], Yatsen Holding[141.21%], Tencent Music[120.18%], XPeng [92.47%] Best China Stocks This Week:
Xunlei [43.56%], Burning Rock[41.87%], NIO [24.49%], iQIYI [23.04%], Zhihu [18.1%], XPeng [17.39%], Smart Share[14.53%], Cheetah Mobile[13.59%], MINISO [13.58%], QuantaSing [13.01%], Full Truck[12.26%] Best China Stocks Daily:
X Financial[15.73%], XPeng [11.68%], Full Truck[9.81%], Viomi [9.39%], NIO [9.27%], CNFinance [7.77%], Lixiang Education[7.32%], Kanzhun [6.61%], MINISO [6.38%], Burning Rock[6.02%], FinVolution [5.55%]