
 Login Sign Up


| |||||
 |  | ||||

| 12Stocks.com Market Intelligence |
Best China Stocks
|
On this page, you will find the most comprehensive analysis of Chinese stocks and ETFs - from latest trends to performances to charts ➞. First, here are the year-to-date (YTD) performances of the most requested China stocks at 12Stocks.com (click stock for review):
| Sohu.com 13% | ||
| New Oriental 5% | ||
| NetEase 1% | ||
| JD.com -2% | ||
| Alibaba -4% | ||
| Vipshop -11% | ||
| JOYY -16% | ||
| Baidu -17% | ||
| Weibo -22% | ||
| In a hurry? China Stocks Lists: Performance Trends Table, Stock Charts
Sort China stocks: Daily, Weekly, Year-to-Date, Market Cap & Trends. Filter China stocks list by sector: Show all, Tech, Finance, Energy, Staples, Retail, Industrial, Materials, Utilities and HealthCare Filter China stocks list by size: All China Large Medium Small and MicroCap |
| April 25, 2024 - 12Stocks.com China Stocks Performances & Trends Daily | |||||||||
|
|  The overall Smart Investing & Trading Score is 100 (0-bearish to 100-bullish) which puts China index in short term bullish trend. The Smart Investing & Trading Score from previous trading session is 74 and an improvement of trend continues.
| ||||||||
| Here are the Smart Investing & Trading Scores of the most requested China stocks at 12Stocks.com (click stock name for detailed review): |


| 12Stocks.com: Top Performing China Index Stocks | ||||||||||||||||||||||||||||||||||||||||||||||||
 The top performing China Index stocks year to date are
Now, more recently, over last week, the top performing China Index stocks on the move are


|
||||||||||||||||||||||||||||||||||||||||||||||||
| 12Stocks.com: Investing in China Index with Stocks | |
|
The following table helps investors and traders sort through current performance and trends (as measured by Smart Investing & Trading Score) of various
stocks in the China Index. Quick View: Move mouse or cursor over stock symbol (ticker) to view short-term technical chart and over stock name to view long term chart. Click on  to add stock symbol to your watchlist and to add stock symbol to your watchlist and  to view watchlist. Click on any ticker or stock name for detailed market intelligence report for that stock. to view watchlist. Click on any ticker or stock name for detailed market intelligence report for that stock. |
12Stocks.com Performance of Stocks in China Index
| Ticker | Stock Name | Watchlist | Category | Recent Price | Smart Investing & Trading Score | Change % | YTD Change% |
| AIH | Aesthetic Medical |   | Health Care | 0.58 | 54 | 44.75 | -16.04% |
| ICG | Intchains | | Technology | 9.99 | 52 | 22.28 | -18.78% |
| UXIN | Uxin | | Technology | 1.89 | 39 | 13.86 | 169.61% |
| GDHG | Golden Heaven | | Services & Goods | 0.28 | 42 | 11.81 | -61.10% |
| UCAR | U Power | | Services & Goods | 5.58 | 78 | 7.31 | NA |
| KNDI | Kandi | | Consumer Staples | 2.61 | 74 | 6.10 | -6.79% |
| TOP | TOP Financial | | Financials | 2.60 | 52 | 4.84 | -30.11% |
| CANG | Cango | | Technology | 1.38 | 49 | 3.76 | 35.29% |
| ZH | Zhihu | | Services & Goods | 0.66 | 47 | 3.58 | -30.27% |
| DQ | Daqo New | | Technology | 23.75 | 68 | 3.22 | -10.71% |
| LANV | Lanvin | | Services & Goods | 1.65 | 74 | 3.13 | -46.08% |
| YJ | Yunji | | Services & Goods | 0.77 | 48 | 2.45 | 8.82% |
| JFIN | Jiayin | | Technology | 6.46 | 58 | 2.22 | 24.71% |
| STG | Sunlands | | Services & Goods | 8.10 | 17 | 2.02 | -20.35% |
| VIOT | Viomi | | Technology | 0.56 | 50 | 2.00 | -43.90% |
| RERE | ATRenew | | Services & Goods | 1.61 | 46 | 1.58 | -15.08% |
| EM | Smart Share | | Services & Goods | 0.63 | 56 | 1.45 | 22.33% |
| FINV | FinVolution | | Financials | 4.90 | 65 | 1.45 | 0.00% |
| JKS | JinkoSolar Holding | | Technology | 23.17 | 60 | 1.27 | -37.28% |
| YRD | Yiren Digital | | Financials | 5.08 | 73 | 1.20 | 62.82% |
| QFIN | 360 Finance | | Financials | 18.73 | 53 | 1.19 | 18.39% |
| NIU | Niu | | Consumer Staples | 2.08 | 86 | 0.97 | -5.02% |
| TWN | Taiwan Fund | | Financials | 37.34 | 43 | 0.93 | 7.96% |
| EH | EHang | | Industrials | 17.48 | 68 | 0.75 | 4.05% |
| XIN | Xinyuan Real | | Financials | 2.73 | 49 | 0.74 | 0.37% |
| For chart view version of above stock list: Chart View ➞ 0 - 25 , 25 - 50 , 50 - 75 | ||
 | Click To Change The Sort Order: By Market Cap or Company Size Performance: Year-to-date, Week and Day |  |
|
Get the most comprehensive stock market coverage daily at 12Stocks.com ➞ Best Stocks Today ➞ Best Stocks Weekly ➞ Best Stocks Year-to-Date ➞ Best Stocks Trends ➞  Best Stocks Today 12Stocks.com Best Nasdaq Stocks ➞ Best S&P 500 Stocks ➞ Best Tech Stocks ➞ Best Biotech Stocks ➞ |
| Detailed Overview of China Stocks |
| China Technical Overview, Leaders & Laggards, Top China ETF Funds & Detailed China Stocks List, Charts, Trends & More |
| China: Technical Analysis, Trends & YTD Performance | |
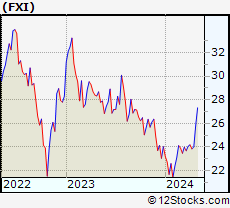
 FXI Weekly Chart |
|
| Long Term Trend: Very Good | |
| Medium Term Trend: Very Good | |
 FXI Daily Chart |
|
| Short Term Trend: Very Good | |
| Overall Trend Score: 100 | |
| YTD Performance: 5.16% | |
| **Trend Scores & Views Are Only For Educational Purposes And Not For Investing | |
| 12Stocks.com: Investing in China Index using Exchange Traded Funds | |
|
The following table shows list of key exchange traded funds (ETF) that
help investors play China stock market. For detailed view, check out our ETF Funds section of our website. Quick View: Move mouse or cursor over ETF symbol (ticker) to view short-term technical chart and over ETF name to view long term chart. Click on ticker or stock name for detailed view. Click on to add stock symbol to your watchlist and to view watchlist. |
12Stocks.com List of ETFs that track China Index
| Ticker | ETF Name | Watchlist | Recent Price | Smart Investing & Trading Score | Change % | Week % | Year-to-date % |
| FXI | China Large-Cap | | 25.27 | 100 | 1.90 | 5.25 | 5.16% |
| EWH | Hong Kong | | 15.50 | 59 | 1.64 | 5.44 | -10.77% |
| YINN | China Bull 3X | | 21.60 | 100 | 5.37 | 15.08 | 3.15% |
| YANG | China Bear 3X | | 10.04 | 0 | -5.28 | -13.97 | -21.56% |
| XPP | China 50 | | 14.36 | 100 | 4.06 | 10.74 | 4.47% |
| MCHI | China | | 41.34 | 100 | 1.55 | 4.9 | 1.47% |
| GXC | China | | 67.76 | 100 | 1.21 | 3.72 | -0.53% |
| CBON | ChinaAMC China Bond | | 21.81 | 41 | -0.50 | -0.53 | -1.31% |
| 12Stocks.com: Charts, Trends, Fundamental Data and Performances of China Stocks | |
|
We now take in-depth look at all China stocks including charts, multi-period performances and overall trends (as measured by Smart Investing & Trading Score). One can sort China stocks (click link to choose) by Daily, Weekly and by Year-to-Date performances. Also, one can sort by size of the company or by market capitalization. |
| Select Your Default Chart Type: | |||||
| |||||
| Click on stock symbol or name for detailed view. Click on to add stock symbol to your watchlist and to view watchlist. Quick View: Move mouse or cursor over "Daily" to quickly view daily technical stock chart and over "Weekly" to view weekly technical stock chart. | |||||

 | AIH Aesthetic Medical International Holdings Group Limited |
| Sector: Health Care | |
| SubSector: Specialized Health Services | |
| MarketCap: 205.356 Millions | |
| Recent Price: 0.58 Smart Investing & Trading Score: 54 | |
| Day Percent Change: 44.75% Day Change: 0.18 | |
| Week Change: 53.58% Year-to-date Change: -16.0% | |
| AIH Links: Profile News Message Board | |
| Charts:- Daily , Weekly | |
| Add AIH to Watchlist: View: Get Complete AIH Trend Analysis ➞ | |
 | ICG Intchains Group Limited |
| Sector: Technology | |
| SubSector: Semiconductors | |
| MarketCap: 450 Millions | |
| Recent Price: 9.99 Smart Investing & Trading Score: 52 | |
| Day Percent Change: 22.28% Day Change: 1.82 | |
| Week Change: 20.36% Year-to-date Change: -18.8% | |
| ICG Links: Profile News Message Board | |
| Charts:- Daily , Weekly | |
| Add ICG to Watchlist: View: Get Complete ICG Trend Analysis ➞ | |
 | UXIN Uxin Limited |
| Sector: Technology | |
| SubSector: Internet Information Providers | |
| MarketCap: 414.58 Millions | |
| Recent Price: 1.89 Smart Investing & Trading Score: 39 | |
| Day Percent Change: 13.86% Day Change: 0.23 | |
| Week Change: 11.83% Year-to-date Change: 169.6% | |
| UXIN Links: Profile News Message Board | |
| Charts:- Daily , Weekly | |
| Add UXIN to Watchlist: View: Get Complete UXIN Trend Analysis ➞ | |
 | GDHG Golden Heaven Group Holdings Ltd. |
| Sector: Services & Goods | |
| SubSector: Leisure | |
| MarketCap: 230 Millions | |
| Recent Price: 0.28 Smart Investing & Trading Score: 42 | |
| Day Percent Change: 11.81% Day Change: 0.03 | |
| Week Change: 20.85% Year-to-date Change: -61.1% | |
| GDHG Links: Profile News Message Board | |
| Charts:- Daily , Weekly | |
| Add GDHG to Watchlist: View: Get Complete GDHG Trend Analysis ➞ | |
 | UCAR U Power Limited |
| Sector: Services & Goods | |
| SubSector: Auto & Truck Dealerships | |
| MarketCap: 372 Millions | |
| Recent Price: 5.58 Smart Investing & Trading Score: 78 | |
| Day Percent Change: 7.31% Day Change: 0.38 | |
| Week Change: 8.56% Year-to-date Change: 3,013.8% | |
| UCAR Links: Profile News Message Board | |
| Charts:- Daily , Weekly | |
| Add UCAR to Watchlist: View: Get Complete UCAR Trend Analysis ➞ | |
 | KNDI Kandi Technologies Group, Inc. |
| Sector: Consumer Staples | |
| SubSector: Auto Manufacturers - Major | |
| MarketCap: 137.471 Millions | |
| Recent Price: 2.61 Smart Investing & Trading Score: 74 | |
| Day Percent Change: 6.10% Day Change: 0.15 | |
| Week Change: 2.35% Year-to-date Change: -6.8% | |
| KNDI Links: Profile News Message Board | |
| Charts:- Daily , Weekly | |
| Add KNDI to Watchlist: View: Get Complete KNDI Trend Analysis ➞ | |
 | TOP TOP Financial Group Limited |
| Sector: Financials | |
| SubSector: Capital Markets | |
| MarketCap: 329 Millions | |
| Recent Price: 2.60 Smart Investing & Trading Score: 52 | |
| Day Percent Change: 4.84% Day Change: 0.12 | |
| Week Change: 10.64% Year-to-date Change: -30.1% | |
| TOP Links: Profile News Message Board | |
| Charts:- Daily , Weekly | |
| Add TOP to Watchlist: View: Get Complete TOP Trend Analysis ➞ | |
 | CANG Cango Inc. |
| Sector: Technology | |
| SubSector: Internet Information Providers | |
| MarketCap: 947.48 Millions | |
| Recent Price: 1.38 Smart Investing & Trading Score: 49 | |
| Day Percent Change: 3.76% Day Change: 0.05 | |
| Week Change: -1.43% Year-to-date Change: 35.3% | |
| CANG Links: Profile News Message Board | |
| Charts:- Daily , Weekly | |
| Add CANG to Watchlist: View: Get Complete CANG Trend Analysis ➞ | |
 | ZH Zhihu Inc. |
| Sector: Services & Goods | |
| SubSector: Internet Content & Information | |
| MarketCap: 741 Millions | |
| Recent Price: 0.66 Smart Investing & Trading Score: 47 | |
| Day Percent Change: 3.58% Day Change: 0.02 | |
| Week Change: 6.72% Year-to-date Change: -30.3% | |
| ZH Links: Profile News Message Board | |
| Charts:- Daily , Weekly | |
| Add ZH to Watchlist: View: Get Complete ZH Trend Analysis ➞ | |
 | DQ Daqo New Energy Corp. |
| Sector: Technology | |
| SubSector: Semiconductor Equipment & Materials | |
| MarketCap: 660.918 Millions | |
| Recent Price: 23.75 Smart Investing & Trading Score: 68 | |
| Day Percent Change: 3.22% Day Change: 0.74 | |
| Week Change: 7.42% Year-to-date Change: -10.7% | |
| DQ Links: Profile News Message Board | |
| Charts:- Daily , Weekly | |
| Add DQ to Watchlist: View: Get Complete DQ Trend Analysis ➞ | |
 | LANV Lanvin Group Holdings Limited |
| Sector: Services & Goods | |
| SubSector: Luxury Goods | |
| MarketCap: 712 Millions | |
| Recent Price: 1.65 Smart Investing & Trading Score: 74 | |
| Day Percent Change: 3.13% Day Change: 0.05 | |
| Week Change: 3.77% Year-to-date Change: -46.1% | |
| LANV Links: Profile News Message Board | |
| Charts:- Daily , Weekly | |
| Add LANV to Watchlist: View: Get Complete LANV Trend Analysis ➞ | |
 | YJ Yunji Inc. |
| Sector: Services & Goods | |
| SubSector: Specialty Retail, Other | |
| MarketCap: 770.644 Millions | |
| Recent Price: 0.77 Smart Investing & Trading Score: 48 | |
| Day Percent Change: 2.45% Day Change: 0.02 | |
| Week Change: 3.77% Year-to-date Change: 8.8% | |
| YJ Links: Profile News Message Board | |
| Charts:- Daily , Weekly | |
| Add YJ to Watchlist: View: Get Complete YJ Trend Analysis ➞ | |
 | JFIN Jiayin Group Inc. |
| Sector: Technology | |
| SubSector: Internet Information Providers | |
| MarketCap: 131.48 Millions | |
| Recent Price: 6.46 Smart Investing & Trading Score: 58 | |
| Day Percent Change: 2.22% Day Change: 0.14 | |
| Week Change: 0.16% Year-to-date Change: 24.7% | |
| JFIN Links: Profile News Message Board | |
| Charts:- Daily , Weekly | |
| Add JFIN to Watchlist: View: Get Complete JFIN Trend Analysis ➞ | |
 | STG Sunlands Technology Group |
| Sector: Services & Goods | |
| SubSector: Education & Training Services | |
| MarketCap: 295.706 Millions | |
| Recent Price: 8.10 Smart Investing & Trading Score: 17 | |
| Day Percent Change: 2.02% Day Change: 0.16 | |
| Week Change: -0.8% Year-to-date Change: -20.4% | |
| STG Links: Profile News Message Board | |
| Charts:- Daily , Weekly | |
| Add STG to Watchlist: View: Get Complete STG Trend Analysis ➞ | |
 | VIOT Viomi Technology Co., Ltd |
| Sector: Technology | |
| SubSector: Electronic Equipment | |
| MarketCap: 357.2 Millions | |
| Recent Price: 0.56 Smart Investing & Trading Score: 50 | |
| Day Percent Change: 2.00% Day Change: 0.01 | |
| Week Change: 2.84% Year-to-date Change: -43.9% | |
| VIOT Links: Profile News Message Board | |
| Charts:- Daily , Weekly | |
| Add VIOT to Watchlist: View: Get Complete VIOT Trend Analysis ➞ | |
 | RERE ATRenew Inc. |
| Sector: Services & Goods | |
| SubSector: Internet Retail | |
| MarketCap: 672 Millions | |
| Recent Price: 1.61 Smart Investing & Trading Score: 46 | |
| Day Percent Change: 1.58% Day Change: 0.02 | |
| Week Change: 1.58% Year-to-date Change: -15.1% | |
| RERE Links: Profile News Message Board | |
| Charts:- Daily , Weekly | |
| Add RERE to Watchlist: View: Get Complete RERE Trend Analysis ➞ | |
 | EM Smart Share Global Limited |
| Sector: Services & Goods | |
| SubSector: Personal Services | |
| MarketCap: 238 Millions | |
| Recent Price: 0.63 Smart Investing & Trading Score: 56 | |
| Day Percent Change: 1.45% Day Change: 0.01 | |
| Week Change: -1.56% Year-to-date Change: 22.3% | |
| EM Links: Profile News Message Board | |
| Charts:- Daily , Weekly | |
| Add EM to Watchlist: View: Get Complete EM Trend Analysis ➞ | |
 | FINV FinVolution Group |
| Sector: Financials | |
| SubSector: Credit Services | |
| MarketCap: 476.208 Millions | |
| Recent Price: 4.90 Smart Investing & Trading Score: 65 | |
| Day Percent Change: 1.45% Day Change: 0.07 | |
| Week Change: 3.38% Year-to-date Change: 0.0% | |
| FINV Links: Profile News Message Board | |
| Charts:- Daily , Weekly | |
| Add FINV to Watchlist: View: Get Complete FINV Trend Analysis ➞ | |
 | JKS JinkoSolar Holding Co., Ltd. |
| Sector: Technology | |
| SubSector: Semiconductor - Specialized | |
| MarketCap: 629.36 Millions | |
| Recent Price: 23.17 Smart Investing & Trading Score: 60 | |
| Day Percent Change: 1.27% Day Change: 0.29 | |
| Week Change: 7.47% Year-to-date Change: -37.3% | |
| JKS Links: Profile News Message Board | |
| Charts:- Daily , Weekly | |
| Add JKS to Watchlist: View: Get Complete JKS Trend Analysis ➞ | |
 | YRD Yiren Digital Ltd. |
| Sector: Financials | |
| SubSector: Credit Services | |
| MarketCap: 330.208 Millions | |
| Recent Price: 5.08 Smart Investing & Trading Score: 73 | |
| Day Percent Change: 1.20% Day Change: 0.06 | |
| Week Change: 5.18% Year-to-date Change: 62.8% | |
| YRD Links: Profile News Message Board | |
| Charts:- Daily , Weekly | |
| Add YRD to Watchlist: View: Get Complete YRD Trend Analysis ➞ | |
 | QFIN 360 Finance, Inc. |
| Sector: Financials | |
| SubSector: Credit Services | |
| MarketCap: 956.208 Millions | |
| Recent Price: 18.73 Smart Investing & Trading Score: 53 | |
| Day Percent Change: 1.19% Day Change: 0.22 | |
| Week Change: 4.06% Year-to-date Change: 18.4% | |
| QFIN Links: Profile News Message Board | |
| Charts:- Daily , Weekly | |
| Add QFIN to Watchlist: View: Get Complete QFIN Trend Analysis ➞ | |
 | NIU Niu Technologies |
| Sector: Consumer Staples | |
| SubSector: Auto Manufacturers - Major | |
| MarketCap: 543.271 Millions | |
| Recent Price: 2.08 Smart Investing & Trading Score: 86 | |
| Day Percent Change: 0.97% Day Change: 0.02 | |
| Week Change: 7.49% Year-to-date Change: -5.0% | |
| NIU Links: Profile News Message Board | |
| Charts:- Daily , Weekly | |
| Add NIU to Watchlist: View: Get Complete NIU Trend Analysis ➞ | |
 | TWN The Taiwan Fund, Inc. |
| Sector: Financials | |
| SubSector: Closed-End Fund - Foreign | |
| MarketCap: 110.547 Millions | |
| Recent Price: 37.34 Smart Investing & Trading Score: 43 | |
| Day Percent Change: 0.93% Day Change: 0.34 | |
| Week Change: -1.21% Year-to-date Change: 8.0% | |
| TWN Links: Profile News Message Board | |
| Charts:- Daily , Weekly | |
| Add TWN to Watchlist: View: Get Complete TWN Trend Analysis ➞ | |
 | EH EHang Holdings Limited |
| Sector: Industrials | |
| SubSector: Aerospace/Defense Products & Services | |
| MarketCap: 513.401 Millions | |
| Recent Price: 17.48 Smart Investing & Trading Score: 68 | |
| Day Percent Change: 0.75% Day Change: 0.13 | |
| Week Change: -0.17% Year-to-date Change: 4.1% | |
| EH Links: Profile News Message Board | |
| Charts:- Daily , Weekly | |
| Add EH to Watchlist: View: Get Complete EH Trend Analysis ➞ | |
 | XIN Xinyuan Real Estate Co., Ltd. |
| Sector: Financials | |
| SubSector: Real Estate Development | |
| MarketCap: 136.119 Millions | |
| Recent Price: 2.73 Smart Investing & Trading Score: 49 | |
| Day Percent Change: 0.74% Day Change: 0.02 | |
| Week Change: 5% Year-to-date Change: 0.4% | |
| XIN Links: Profile News Message Board | |
| Charts:- Daily , Weekly | |
| Add XIN to Watchlist: View: Get Complete XIN Trend Analysis ➞ | |
| For tabular summary view of above stock list: Summary View ➞ 0 - 25 , 25 - 50 , 50 - 75 | ||
| Click To Change The Sort Order: By Market Cap or Company Size Performance: Year-to-date, Week and Day | |
| Select Chart Type: | ||
|
Best Stocks Today 12Stocks.com |
© 2024 12Stocks.com Terms & Conditions Privacy Contact Us
All Information Provided Only For Education And Not To Be Used For Investing or Trading. See Terms & Conditions


One More Thing ... Get Best Stocks Delivered Daily!
Never Ever Miss A Move With Our Top Ten Stocks Lists
Find Best Stocks In Any Market - Bull or Bear Market
Take A Peek At Our Top Ten Stocks Lists: Daily, Weekly, Year-to-Date & Top Trends
Find Best Stocks In Any Market - Bull or Bear Market
Take A Peek At Our Top Ten Stocks Lists: Daily, Weekly, Year-to-Date & Top Trends
China Stocks With Best Up Trends [0-bearish to 100-bullish]: Yatsen Holding[100], ZTO Express[100], Alibaba [100], JD.com [100], MINISO [100], Full Truck[100], WiMi Hologram[95], Lufax Holding[95], Baozun [95], Qudian [95], Dada Nexus[93]
Best China Stocks Year-to-Date:
U Power[3013.84%], DouYu [802.11%], MicroCloud Hologram[574.82%], China Liberal[531.99%], Yatsen Holding[479.55%], Zhongchao [325.91%], Uxin [169.61%], QuantaSing [106.48%], GigaCloud [96.01%], Cheetah Mobile[73.68%], Yiren Digital[62.82%] Best China Stocks This Week:
WiMi Hologram[64.85%], Aesthetic Medical[53.58%], Golden Heaven[20.85%], Intchains [20.36%], iQIYI [17.99%], Yatsen Holding[17.29%], Bilibili [16.87%], GDS [14.87%], Baozun [14.66%], Pinduoduo [12.39%], Cheetah Mobile[11.86%] Best China Stocks Daily:
WiMi Hologram[58.53%], Aesthetic Medical[44.75%], Intchains [22.28%], Uxin [13.86%], Golden Heaven[11.81%], 17 Education[11.70%], Bilibili [10.97%], AMTD Digital[8.33%], Yatsen Holding[7.89%], Dada Nexus[7.53%], U Power[7.31%]