
 Login Sign Up


| |||||
 |  | ||||

| 12Stocks.com Market Intelligence |
Best China Stocks
|
On this page, you will find the most comprehensive analysis of Chinese stocks and ETFs - from latest trends to performances to charts ➞. First, here are the year-to-date (YTD) performances of the most requested China stocks at 12Stocks.com (click stock for review):
| Sohu.com 13% | ||
| New Oriental 5% | ||
| NetEase 1% | ||
| JD.com -2% | ||
| Alibaba -4% | ||
| Vipshop -11% | ||
| JOYY -16% | ||
| Baidu -17% | ||
| Weibo -22% | ||
| In a hurry? China Stocks Lists: Performance Trends Table, Stock Charts
Sort China stocks: Daily, Weekly, Year-to-Date, Market Cap & Trends. Filter China stocks list by sector: Show all, Tech, Finance, Energy, Staples, Retail, Industrial, Materials, Utilities and HealthCare Filter China stocks list by size: All China Large Medium Small and MicroCap |
| April 24, 2024 - 12Stocks.com China Stocks Performances & Trends Daily | |||||||||
|
|  The overall Smart Investing & Trading Score is 100 (0-bearish to 100-bullish) which puts China index in short term bullish trend. The Smart Investing & Trading Score from previous trading session is 74 and an improvement of trend continues.
| ||||||||
| Here are the Smart Investing & Trading Scores of the most requested China stocks at 12Stocks.com (click stock name for detailed review): |


| 12Stocks.com: Top Performing China Index Stocks | ||||||||||||||||||||||||||||||||||||||||||||||||
 The top performing China Index stocks year to date are
Now, more recently, over last week, the top performing China Index stocks on the move are


|
||||||||||||||||||||||||||||||||||||||||||||||||
| 12Stocks.com: Investing in China Index with Stocks | |
|
The following table helps investors and traders sort through current performance and trends (as measured by Smart Investing & Trading Score) of various
stocks in the China Index. Quick View: Move mouse or cursor over stock symbol (ticker) to view short-term technical chart and over stock name to view long term chart. Click on  to add stock symbol to your watchlist and to add stock symbol to your watchlist and  to view watchlist. Click on any ticker or stock name for detailed market intelligence report for that stock. to view watchlist. Click on any ticker or stock name for detailed market intelligence report for that stock. |
12Stocks.com Performance of Stocks in China Index
| Ticker | Stock Name | Watchlist | Category | Recent Price | Smart Investing & Trading Score | Change % | YTD Change% |
| QFIN | 360 Finance |   | Financials | 18.71 | 46 | 1.08% | 18.27% |
| CANG | Cango | | Technology | 1.40 | 49 | 5.26% | 37.25% |
| WDH | Waterdrop | | Financials | 1.19 | 53 | 0.00% | 13.66% |
| BEDU | Bright Scholar | | Services & Goods | 1.90 | 46 | -7.77% | 52.00% |
| DUO | Fangdd Network | | Financials | 0.41 | 17 | 0.00% | -38.71% |
| YJ | Yunji | | Services & Goods | 0.81 | 48 | 7.26% | 13.93% |
| SFWL | Shengfeng Development | | Industrials | 1.43 | 51 | -12.80% | -48.00% |
| ZH | Zhihu | | Services & Goods | 0.66 | 47 | 3.58% | -30.27% |
| LANV | Lanvin | | Services & Goods | 1.65 | 74 | 3.13% | -46.08% |
| DDL | Dingdong (Cayman) | | Consumer Staples | 1.21 | 54 | -1.23% | -20.72% |
| RERE | ATRenew | | Services & Goods | 1.61 | 46 | 1.58% | -15.08% |
| HOLI | Hollysys Automation | | Industrials | 24.52 | 18 | 0.47% | -6.96% |
| DQ | Daqo New | | Technology | 23.75 | 68 | 3.22% | -10.71% |
| COE | China Online | | Services & Goods | 7.00 | 32 | -3.31% | -12.84% |
| JKS | JinkoSolar Holding | | Technology | 23.17 | 52 | 1.27% | -37.28% |
| QD | Qudian | | Technology | 2.46 | 95 | -0.40% | 20.59% |
| NIU | Niu | | Consumer Staples | 2.09 | 86 | 1.46% | -4.57% |
| YI | 111 | | Services & Goods | 1.07 | 35 | -1.83% | -30.97% |
| EH | EHang | | Industrials | 17.50 | 68 | 0.86% | 4.17% |
| FINV | FinVolution | | Financials | 4.90 | 65 | 1.45% | 0.00% |
| THCH | TH | | Services & Goods | 1.21 | 40 | -3.98% | -30.75% |
| ICG | Intchains | | Technology | 9.99 | 52 | 22.28% | -18.78% |
| QSG | QuantaSing | | Consumer Staples | 3.35 | 27 | 0.30% | 106.48% |
| AIXI | Xiao-I | | Technology | 1.26 | 20 | -11.27% | -44.00% |
| UXIN | Uxin | | Technology | 1.89 | 39 | 13.86% | 169.61% |
| For chart view version of above stock list: Chart View ➞ 0 - 25 , 25 - 50 , 50 - 75 | ||
 | Click To Change The Sort Order: By Market Cap or Company Size Performance: Year-to-date, Week and Day |  |
|
Get the most comprehensive stock market coverage daily at 12Stocks.com ➞ Best Stocks Today ➞ Best Stocks Weekly ➞ Best Stocks Year-to-Date ➞ Best Stocks Trends ➞  Best Stocks Today 12Stocks.com Best Nasdaq Stocks ➞ Best S&P 500 Stocks ➞ Best Tech Stocks ➞ Best Biotech Stocks ➞ |
| Detailed Overview of China Stocks |
| China Technical Overview, Leaders & Laggards, Top China ETF Funds & Detailed China Stocks List, Charts, Trends & More |
| China: Technical Analysis, Trends & YTD Performance | |
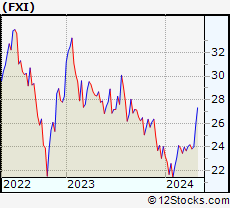
 FXI Weekly Chart |
|
| Long Term Trend: Very Good | |
| Medium Term Trend: Very Good | |
 FXI Daily Chart |
|
| Short Term Trend: Very Good | |
| Overall Trend Score: 100 | |
| YTD Performance: 5.16% | |
| **Trend Scores & Views Are Only For Educational Purposes And Not For Investing | |
| 12Stocks.com: Investing in China Index using Exchange Traded Funds | |
|
The following table shows list of key exchange traded funds (ETF) that
help investors play China stock market. For detailed view, check out our ETF Funds section of our website. Quick View: Move mouse or cursor over ETF symbol (ticker) to view short-term technical chart and over ETF name to view long term chart. Click on ticker or stock name for detailed view. Click on to add stock symbol to your watchlist and to view watchlist. |
12Stocks.com List of ETFs that track China Index
| Ticker | ETF Name | Watchlist | Recent Price | Smart Investing & Trading Score | Change % | Week % | Year-to-date % |
| FXI | China Large-Cap | | 25.27 | 100 | 1.90 | 5.25 | 5.16% |
| EWH | Hong Kong | | 15.50 | 59 | 1.64 | 5.44 | -10.77% |
| YINN | China Bull 3X | | 21.60 | 100 | 5.37 | 15.08 | 3.15% |
| YANG | China Bear 3X | | 10.04 | 0 | -5.28 | -13.97 | -21.56% |
| XPP | China 50 | | 14.18 | 100 | 2.75 | 9.35 | 3.16% |
| MCHI | China | | 41.35 | 100 | 1.57 | 4.92 | 1.5% |
| GXC | China | | 67.76 | 85 | 1.21 | 3.72 | -0.53% |
| CBON | ChinaAMC China Bond | | 21.81 | 41 | -0.50 | -0.53 | -1.31% |
| 12Stocks.com: Charts, Trends, Fundamental Data and Performances of China Stocks | |
|
We now take in-depth look at all China stocks including charts, multi-period performances and overall trends (as measured by Smart Investing & Trading Score). One can sort China stocks (click link to choose) by Daily, Weekly and by Year-to-Date performances. Also, one can sort by size of the company or by market capitalization. |
| Select Your Default Chart Type: | |||||
| |||||
| Click on stock symbol or name for detailed view. Click on to add stock symbol to your watchlist and to view watchlist. Quick View: Move mouse or cursor over "Daily" to quickly view daily technical stock chart and over "Weekly" to view weekly technical stock chart. | |||||

 | QFIN 360 Finance, Inc. |
| Sector: Financials | |
| SubSector: Credit Services | |
| MarketCap: 956.208 Millions | |
| Recent Price: 18.71 Smart Investing & Trading Score: 46 | |
| Day Percent Change: 1.08% Day Change: 0.20 | |
| Week Change: 3.94% Year-to-date Change: 18.3% | |
| QFIN Links: Profile News Message Board | |
| Charts:- Daily , Weekly | |
| Add QFIN to Watchlist: View: Get Complete QFIN Trend Analysis ➞ | |
 | CANG Cango Inc. |
| Sector: Technology | |
| SubSector: Internet Information Providers | |
| MarketCap: 947.48 Millions | |
| Recent Price: 1.40 Smart Investing & Trading Score: 49 | |
| Day Percent Change: 5.26% Day Change: 0.07 | |
| Week Change: 0% Year-to-date Change: 37.3% | |
| CANG Links: Profile News Message Board | |
| Charts:- Daily , Weekly | |
| Add CANG to Watchlist: View: Get Complete CANG Trend Analysis ➞ | |
 | WDH Waterdrop Inc. |
| Sector: Financials | |
| SubSector: Insurance - Diversified | |
| MarketCap: 874 Millions | |
| Recent Price: 1.19 Smart Investing & Trading Score: 53 | |
| Day Percent Change: 0.00% Day Change: 0.00 | |
| Week Change: -2.46% Year-to-date Change: 13.7% | |
| WDH Links: Profile News Message Board | |
| Charts:- Daily , Weekly | |
| Add WDH to Watchlist: View: Get Complete WDH Trend Analysis ➞ | |
 | BEDU Bright Scholar Education Holdings Limited |
| Sector: Services & Goods | |
| SubSector: Education & Training Services | |
| MarketCap: 792.406 Millions | |
| Recent Price: 1.90 Smart Investing & Trading Score: 46 | |
| Day Percent Change: -7.77% Day Change: -0.16 | |
| Week Change: -5.47% Year-to-date Change: 52.0% | |
| BEDU Links: Profile News Message Board | |
| Charts:- Daily , Weekly | |
| Add BEDU to Watchlist: View: Get Complete BEDU Trend Analysis ➞ | |
 | DUO Fangdd Network Group Ltd. |
| Sector: Financials | |
| SubSector: Property Management | |
| MarketCap: 783.142 Millions | |
| Recent Price: 0.41 Smart Investing & Trading Score: 17 | |
| Day Percent Change: 0.00% Day Change: 0.00 | |
| Week Change: 5.77% Year-to-date Change: -38.7% | |
| DUO Links: Profile News Message Board | |
| Charts:- Daily , Weekly | |
| Add DUO to Watchlist: View: Get Complete DUO Trend Analysis ➞ | |
 | YJ Yunji Inc. |
| Sector: Services & Goods | |
| SubSector: Specialty Retail, Other | |
| MarketCap: 770.644 Millions | |
| Recent Price: 0.81 Smart Investing & Trading Score: 48 | |
| Day Percent Change: 7.26% Day Change: 0.05 | |
| Week Change: 8.64% Year-to-date Change: 13.9% | |
| YJ Links: Profile News Message Board | |
| Charts:- Daily , Weekly | |
| Add YJ to Watchlist: View: Get Complete YJ Trend Analysis ➞ | |
 | SFWL Shengfeng Development Limited |
| Sector: Industrials | |
| SubSector: Integrated Freight & Logistics | |
| MarketCap: 747 Millions | |
| Recent Price: 1.43 Smart Investing & Trading Score: 51 | |
| Day Percent Change: -12.80% Day Change: -0.21 | |
| Week Change: -12.27% Year-to-date Change: -48.0% | |
| SFWL Links: Profile News Message Board | |
| Charts:- Daily , Weekly | |
| Add SFWL to Watchlist: View: Get Complete SFWL Trend Analysis ➞ | |
 | ZH Zhihu Inc. |
| Sector: Services & Goods | |
| SubSector: Internet Content & Information | |
| MarketCap: 741 Millions | |
| Recent Price: 0.66 Smart Investing & Trading Score: 47 | |
| Day Percent Change: 3.58% Day Change: 0.02 | |
| Week Change: 6.72% Year-to-date Change: -30.3% | |
| ZH Links: Profile News Message Board | |
| Charts:- Daily , Weekly | |
| Add ZH to Watchlist: View: Get Complete ZH Trend Analysis ➞ | |
 | LANV Lanvin Group Holdings Limited |
| Sector: Services & Goods | |
| SubSector: Luxury Goods | |
| MarketCap: 712 Millions | |
| Recent Price: 1.65 Smart Investing & Trading Score: 74 | |
| Day Percent Change: 3.13% Day Change: 0.05 | |
| Week Change: 3.77% Year-to-date Change: -46.1% | |
| LANV Links: Profile News Message Board | |
| Charts:- Daily , Weekly | |
| Add LANV to Watchlist: View: Get Complete LANV Trend Analysis ➞ | |
 | DDL Dingdong (Cayman) Limited |
| Sector: Consumer Staples | |
| SubSector: Grocery Stores | |
| MarketCap: 708 Millions | |
| Recent Price: 1.21 Smart Investing & Trading Score: 54 | |
| Day Percent Change: -1.23% Day Change: -0.01 | |
| Week Change: 4.78% Year-to-date Change: -20.7% | |
| DDL Links: Profile News Message Board | |
| Charts:- Daily , Weekly | |
| Add DDL to Watchlist: View: Get Complete DDL Trend Analysis ➞ | |
 | RERE ATRenew Inc. |
| Sector: Services & Goods | |
| SubSector: Internet Retail | |
| MarketCap: 672 Millions | |
| Recent Price: 1.61 Smart Investing & Trading Score: 46 | |
| Day Percent Change: 1.58% Day Change: 0.02 | |
| Week Change: 1.58% Year-to-date Change: -15.1% | |
| RERE Links: Profile News Message Board | |
| Charts:- Daily , Weekly | |
| Add RERE to Watchlist: View: Get Complete RERE Trend Analysis ➞ | |
 | HOLI Hollysys Automation Technologies Ltd. |
| Sector: Industrials | |
| SubSector: Industrial Electrical Equipment | |
| MarketCap: 668.379 Millions | |
| Recent Price: 24.52 Smart Investing & Trading Score: 18 | |
| Day Percent Change: 0.47% Day Change: 0.12 | |
| Week Change: -0.14% Year-to-date Change: -7.0% | |
| HOLI Links: Profile News Message Board | |
| Charts:- Daily , Weekly | |
| Add HOLI to Watchlist: View: Get Complete HOLI Trend Analysis ➞ | |
 | DQ Daqo New Energy Corp. |
| Sector: Technology | |
| SubSector: Semiconductor Equipment & Materials | |
| MarketCap: 660.918 Millions | |
| Recent Price: 23.75 Smart Investing & Trading Score: 68 | |
| Day Percent Change: 3.22% Day Change: 0.74 | |
| Week Change: 7.42% Year-to-date Change: -10.7% | |
| DQ Links: Profile News Message Board | |
| Charts:- Daily , Weekly | |
| Add DQ to Watchlist: View: Get Complete DQ Trend Analysis ➞ | |
 | COE China Online Education Group |
| Sector: Services & Goods | |
| SubSector: Education & Training Services | |
| MarketCap: 643.406 Millions | |
| Recent Price: 7.00 Smart Investing & Trading Score: 32 | |
| Day Percent Change: -3.31% Day Change: -0.24 | |
| Week Change: 8.19% Year-to-date Change: -12.8% | |
| COE Links: Profile News Message Board | |
| Charts:- Daily , Weekly | |
| Add COE to Watchlist: View: Get Complete COE Trend Analysis ➞ | |
 | JKS JinkoSolar Holding Co., Ltd. |
| Sector: Technology | |
| SubSector: Semiconductor - Specialized | |
| MarketCap: 629.36 Millions | |
| Recent Price: 23.17 Smart Investing & Trading Score: 52 | |
| Day Percent Change: 1.27% Day Change: 0.29 | |
| Week Change: 7.47% Year-to-date Change: -37.3% | |
| JKS Links: Profile News Message Board | |
| Charts:- Daily , Weekly | |
| Add JKS to Watchlist: View: Get Complete JKS Trend Analysis ➞ | |
 | QD Qudian Inc. |
| Sector: Technology | |
| SubSector: Information Technology Services | |
| MarketCap: 544.968 Millions | |
| Recent Price: 2.46 Smart Investing & Trading Score: 95 | |
| Day Percent Change: -0.40% Day Change: -0.01 | |
| Week Change: 7.89% Year-to-date Change: 20.6% | |
| QD Links: Profile News Message Board | |
| Charts:- Daily , Weekly | |
| Add QD to Watchlist: View: Get Complete QD Trend Analysis ➞ | |
 | NIU Niu Technologies |
| Sector: Consumer Staples | |
| SubSector: Auto Manufacturers - Major | |
| MarketCap: 543.271 Millions | |
| Recent Price: 2.09 Smart Investing & Trading Score: 86 | |
| Day Percent Change: 1.46% Day Change: 0.03 | |
| Week Change: 8.01% Year-to-date Change: -4.6% | |
| NIU Links: Profile News Message Board | |
| Charts:- Daily , Weekly | |
| Add NIU to Watchlist: View: Get Complete NIU Trend Analysis ➞ | |
 | YI 111, Inc. |
| Sector: Services & Goods | |
| SubSector: Drug Stores | |
| MarketCap: 520.351 Millions | |
| Recent Price: 1.07 Smart Investing & Trading Score: 35 | |
| Day Percent Change: -1.83% Day Change: -0.02 | |
| Week Change: 4.9% Year-to-date Change: -31.0% | |
| YI Links: Profile News Message Board | |
| Charts:- Daily , Weekly | |
| Add YI to Watchlist: View: Get Complete YI Trend Analysis ➞ | |
 | EH EHang Holdings Limited |
| Sector: Industrials | |
| SubSector: Aerospace/Defense Products & Services | |
| MarketCap: 513.401 Millions | |
| Recent Price: 17.50 Smart Investing & Trading Score: 68 | |
| Day Percent Change: 0.86% Day Change: 0.15 | |
| Week Change: -0.06% Year-to-date Change: 4.2% | |
| EH Links: Profile News Message Board | |
| Charts:- Daily , Weekly | |
| Add EH to Watchlist: View: Get Complete EH Trend Analysis ➞ | |
 | FINV FinVolution Group |
| Sector: Financials | |
| SubSector: Credit Services | |
| MarketCap: 476.208 Millions | |
| Recent Price: 4.90 Smart Investing & Trading Score: 65 | |
| Day Percent Change: 1.45% Day Change: 0.07 | |
| Week Change: 3.38% Year-to-date Change: 0.0% | |
| FINV Links: Profile News Message Board | |
| Charts:- Daily , Weekly | |
| Add FINV to Watchlist: View: Get Complete FINV Trend Analysis ➞ | |
 | THCH TH International Limited |
| Sector: Services & Goods | |
| SubSector: Restaurants | |
| MarketCap: 452 Millions | |
| Recent Price: 1.21 Smart Investing & Trading Score: 40 | |
| Day Percent Change: -3.98% Day Change: -0.05 | |
| Week Change: -2.03% Year-to-date Change: -30.8% | |
| THCH Links: Profile News Message Board | |
| Charts:- Daily , Weekly | |
| Add THCH to Watchlist: View: Get Complete THCH Trend Analysis ➞ | |
 | ICG Intchains Group Limited |
| Sector: Technology | |
| SubSector: Semiconductors | |
| MarketCap: 450 Millions | |
| Recent Price: 9.99 Smart Investing & Trading Score: 52 | |
| Day Percent Change: 22.28% Day Change: 1.82 | |
| Week Change: 20.36% Year-to-date Change: -18.8% | |
| ICG Links: Profile News Message Board | |
| Charts:- Daily , Weekly | |
| Add ICG to Watchlist: View: Get Complete ICG Trend Analysis ➞ | |
 | QSG QuantaSing Group Limited |
| Sector: Consumer Staples | |
| SubSector: Education & Training Services | |
| MarketCap: 433 Millions | |
| Recent Price: 3.35 Smart Investing & Trading Score: 27 | |
| Day Percent Change: 0.30% Day Change: 0.01 | |
| Week Change: -0.15% Year-to-date Change: 106.5% | |
| QSG Links: Profile News Message Board | |
| Charts:- Daily , Weekly | |
| Add QSG to Watchlist: View: Get Complete QSG Trend Analysis ➞ | |
 | AIXI Xiao-I Corporation |
| Sector: Technology | |
| SubSector: Software - Application | |
| MarketCap: 431 Millions | |
| Recent Price: 1.26 Smart Investing & Trading Score: 20 | |
| Day Percent Change: -11.27% Day Change: -0.16 | |
| Week Change: -11.27% Year-to-date Change: -44.0% | |
| AIXI Links: Profile News Message Board | |
| Charts:- Daily , Weekly | |
| Add AIXI to Watchlist: View: Get Complete AIXI Trend Analysis ➞ | |
 | UXIN Uxin Limited |
| Sector: Technology | |
| SubSector: Internet Information Providers | |
| MarketCap: 414.58 Millions | |
| Recent Price: 1.89 Smart Investing & Trading Score: 39 | |
| Day Percent Change: 13.86% Day Change: 0.23 | |
| Week Change: 11.83% Year-to-date Change: 169.6% | |
| UXIN Links: Profile News Message Board | |
| Charts:- Daily , Weekly | |
| Add UXIN to Watchlist: View: Get Complete UXIN Trend Analysis ➞ | |
| For tabular summary view of above stock list: Summary View ➞ 0 - 25 , 25 - 50 , 50 - 75 | ||
| Click To Change The Sort Order: By Market Cap or Company Size Performance: Year-to-date, Week and Day | |
| Select Chart Type: | ||
|
Best Stocks Today 12Stocks.com |
© 2024 12Stocks.com Terms & Conditions Privacy Contact Us
All Information Provided Only For Education And Not To Be Used For Investing or Trading. See Terms & Conditions


One More Thing ... Get Best Stocks Delivered Daily!
Never Ever Miss A Move With Our Top Ten Stocks Lists
Find Best Stocks In Any Market - Bull or Bear Market
Take A Peek At Our Top Ten Stocks Lists: Daily, Weekly, Year-to-Date & Top Trends
Find Best Stocks In Any Market - Bull or Bear Market
Take A Peek At Our Top Ten Stocks Lists: Daily, Weekly, Year-to-Date & Top Trends
China Stocks With Best Up Trends [0-bearish to 100-bullish]: Yatsen Holding[100], ZTO Express[100], Alibaba [100], JD.com [100], MINISO [100], Full Truck[100], WiMi Hologram[95], Baozun [95], Qudian [95], MOGU [93], Lufax Holding[90]
Best China Stocks Year-to-Date:
U Power[3013.84%], DouYu [801.05%], MicroCloud Hologram[574.82%], China Liberal[531.99%], Yatsen Holding[479.55%], Zhongchao [325.91%], Uxin [169.61%], QuantaSing [106.48%], GigaCloud [96.01%], Cheetah Mobile[73.68%], Yiren Digital[62.82%] Best China Stocks This Week:
WiMi Hologram[64.85%], Golden Heaven[20.85%], Intchains [20.36%], Aesthetic Medical[19.36%], iQIYI [17.87%], Yatsen Holding[17.29%], Bilibili [16.91%], GDS [14.56%], Baozun [14.44%], Pinduoduo [12.42%], Cheetah Mobile[11.86%] Best China Stocks Daily:
WiMi Hologram[58.53%], Intchains [22.28%], Uxin [13.86%], Aesthetic Medical[12.50%], Golden Heaven[11.81%], 17 Education[11.70%], Bilibili [11.01%], AMTD Digital[8.33%], Yatsen Holding[7.89%], Dada Nexus[7.53%], 21Vianet [7.43%]