
 Login Sign Up


| |||||
 |  | ||||

| 12Stocks.com Market Intelligence |
Best Canada Stocks
|
|
| Quick Read: Top Canada Stocks By Performances & Trends: Daily, Weekly, Year-to-Date, Market Cap (Size) & Technical Trends | |||
| Best Canada Views: Quick Browse View, Summary & Slide Show | |||
| 12Stocks.com Canada Stocks Performances & Trends Daily | |||||||||
|
|  The overall market intelligence score is 78 (0-bearish to 100-bullish) which puts Canada index in short term neutral to bullish trend. The market intelligence score from previous trading session is 56 and hence an improvement of trend.
| ||||||||
Here are the market intelligence trend scores of the most requested Canada stocks at 12Stocks.com (click stock name for detailed review):
| |||||||||||||||||
| Scroll down this page for most comprehensive review of Canada stocks by performance, trends, technical analysis, charts, fund plays & more | |||||||||||||||||


| 12Stocks.com: Top Performing Canada Index Stocks | ||||||||||||||||||||||||||||||||||||||||||||||||
 The top performing Canada Index stocks year to date are
Now, more recently, over last week, the top performing Canada Index stocks on the move are


|
||||||||||||||||||||||||||||||||||||||||||||||||
| 12Stocks.com: Investing in Canada Index with Stocks | |
|
The following table helps investors and traders sort through current performance and trends (as measured by market intelligence score) of various
stocks in the Canada Index. Quick View: Move mouse or cursor over stock symbol (ticker) to view short-term technical chart and over stock name to view long term chart. Click on  to add stock symbol to your watchlist and to add stock symbol to your watchlist and  to view watchlist. Click on any ticker or stock name for detailed market intelligence report for that stock. to view watchlist. Click on any ticker or stock name for detailed market intelligence report for that stock. |
12Stocks.com Performance of Stocks in Canada Index
| Ticker | Stock Name | Watchlist | Category | Recent Price | Market Intelligence Score | Change % | Weekly Change% |
| LAC | Lithium Americas |   | Materials | 4.49 | 42 | 0.00% | -2.81% |
| SU | Suncor Energy | | Energy | 38.24 | 76 | 0.50% | -2.97% |
| HBM | Hudbay Minerals | | Materials | 8.37 | 78 | 0.60% | -3.01% |
| PSLV | Sprott Physical | | Financials | 8.95 | 46 | -0.44% | -3.14% |
| IE | Ivanhoe Electric | | Materials | 10.33 | 75 | 2.68% | -3.28% |
| TRX | Tanzanian Gold | | Materials | 0.44 | 73 | -1.20% | -3.28% |
| EMX | EMX Royalty | | Materials | 1.86 | 61 | 1.92% | -3.39% |
| FSI | Flexible | | Materials | 2.12 | 51 | 0.71% | -3.42% |
| SAND | Sandstorm Gold | | Materials | 5.43 | 51 | -1.99% | -3.55% |
| IMO | Imperial Oil | | Energy | 68.05 | 41 | -0.03% | -3.75% |
| FSM | Fortuna Silver | | Materials | 4.59 | 58 | -1.92% | -3.77% |
| OR | Osisko Gold | | Materials | 15.44 | 51 | -1.03% | -3.80% |
| PAAS | Pan American | | Materials | 18.25 | 43 | -0.71% | -4.05% |
| MUX | McEwen Mining | | Materials | 11.76 | 83 | 1.29% | -4.08% |
| SSRM | SSR Mining | | Materials | 5.34 | 75 | -1.11% | -4.13% |
| CNQ | Canadian Natural | | Energy | 74.65 | 36 | -0.28% | -4.26% |
| CVE | Cenovus Energy | | Energy | 20.49 | 54 | -0.39% | -4.52% |
| BTG | B2Gold | | Materials | 2.50 | 36 | -0.79% | -4.58% |
| ERF | Enerplus | | Energy | 19.56 | 53 | 0.41% | -4.63% |
| CPG | Crescent Point | | Energy | 8.65 | 36 | -0.69% | -4.63% |
| EXK | Endeavour Silver | | Materials | 2.65 | 58 | -0.38% | -4.68% |
| AG | Majestic Silver | | Materials | 6.70 | 68 | -0.30% | -4.83% |
| MGA | Magna | | Services & Goods | 46.70 | 0 | -3.55% | -4.93% |
| IAG | IAMGOLD | | Materials | 3.59 | 58 | -1.91% | -5.03% |
| PLG | Platinum | | Materials | 1.30 | 73 | -3.33% | -5.43% |
| To view more stocks, click on Next / Previous arrows or select different range: 0 - 25 , 25 - 50 , 50 - 75 , 75 - 100 , 100 - 125 , 125 - 150 | ||
 | Click To Change The Sort Order: By Market Cap or Company Size Performance: Year-to-date, Week and Day |  |
| Detailed Overview Of Canada Stocks |
| Canada Technical Overview, Leaders & Laggards, Top Canada ETF Funds & Detailed Canada Stocks List, Charts, Trends & More |
| Canada: Technical Analysis, Trends & YTD Performance | |
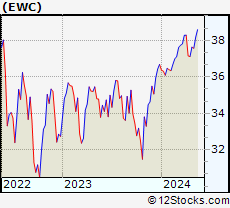
 EWC Weekly Chart |
|
| Long Term Trend: Very Good | |
| Medium Term Trend: Good | |
 EWC Daily Chart |
|
| Short Term Trend: Very Good | |
| Overall Trend Score: 78 | |
| YTD Performance: 2.43% | |
| **Trend Scores & Views Are Only For Educational Purposes And Not For Investing | |
| 12Stocks.com: Investing in Canada Index using Exchange Traded Funds | |
|
The following table shows list of key exchange traded funds (ETF) that
help investors play Canada stock market. For detailed view, check out our ETF Funds section of our website. Quick View: Move mouse or cursor over ETF symbol (ticker) to view short-term technical chart and over ETF name to view long term chart. Click on ticker or stock name for detailed view. Click on to add stock symbol to your watchlist and to view watchlist. |
12Stocks.com List of ETFs that track Canada Index
| Ticker | ETF Name | Watchlist | Recent Price | Market Intelligence Score | Change % | Week % | Year-to-date % |
| EWC | Canada | | 37.57 | 78 | 0.62 | -0.16 | 2.43% |
| 12Stocks.com: Charts, Trends, Fundamental Data and Performances of Canada Stocks | |
|
We now take in-depth look at all Canada stocks including charts, multi-period performances and overall trends (as measured by market intelligence score). One can sort Canada stocks (click link to choose) by Daily, Weekly and by Year-to-Date performances. Also, one can sort by size of the company or by market capitalization. |
| Select Your Default Chart Type: | |||||
| |||||
| Click on stock symbol or name for detailed view. Click on to add stock symbol to your watchlist and to view watchlist. Quick View: Move mouse or cursor over "Daily" to quickly view daily technical stock chart and over "Weekly" to view weekly technical stock chart. | |||||

 | LAC Lithium Americas Corp. |
| Sector: Materials | |
| SubSector: Industrial Metals & Minerals | |
| MarketCap: 192.01 Millions | |
| Recent Price: 4.49 Market Intelligence Score: 42 | |
| Day Percent Change: 0.00% Day Change: 0.00 | |
| Week Change: -2.81% Year-to-date Change: -29.8% | |
| LAC Links: Profile News Message Board | |
| Charts:- Daily , Weekly | |
| Add LAC to Watchlist: View: Get Complete LAC Trend Analysis ➞ | |
 | SU Suncor Energy Inc. |
| Sector: Energy | |
| SubSector: Independent Oil & Gas | |
| MarketCap: 21550.6 Millions | |
| Recent Price: 38.24 Market Intelligence Score: 76 | |
| Day Percent Change: 0.50% Day Change: 0.19 | |
| Week Change: -2.97% Year-to-date Change: 19.4% | |
| SU Links: Profile News Message Board | |
| Charts:- Daily , Weekly | |
| Add SU to Watchlist: View: Get Complete SU Trend Analysis ➞ | |
 | HBM Hudbay Minerals Inc. |
| Sector: Materials | |
| SubSector: Copper | |
| MarketCap: 363.157 Millions | |
| Recent Price: 8.37 Market Intelligence Score: 78 | |
| Day Percent Change: 0.60% Day Change: 0.05 | |
| Week Change: -3.01% Year-to-date Change: 51.6% | |
| HBM Links: Profile News Message Board | |
| Charts:- Daily , Weekly | |
| Add HBM to Watchlist: View: Get Complete HBM Trend Analysis ➞ | |
 | PSLV Sprott Physical Silver Trust |
| Sector: Financials | |
| SubSector: Exchange Traded Fund | |
| MarketCap: 765.851 Millions | |
| Recent Price: 8.95 Market Intelligence Score: 46 | |
| Day Percent Change: -0.44% Day Change: -0.04 | |
| Week Change: -3.14% Year-to-date Change: 10.8% | |
| PSLV Links: Profile News Message Board | |
| Charts:- Daily , Weekly | |
| Add PSLV to Watchlist: View: Get Complete PSLV Trend Analysis ➞ | |
 | IE Ivanhoe Electric Inc. |
| Sector: Materials | |
| SubSector: Copper | |
| MarketCap: 1200 Millions | |
| Recent Price: 10.33 Market Intelligence Score: 75 | |
| Day Percent Change: 2.68% Day Change: 0.27 | |
| Week Change: -3.28% Year-to-date Change: 1.9% | |
| IE Links: Profile News Message Board | |
| Charts:- Daily , Weekly | |
| Add IE to Watchlist: View: Get Complete IE Trend Analysis ➞ | |
 | TRX Tanzanian Gold Corporation |
| Sector: Materials | |
| SubSector: Gold | |
| MarketCap: 95.9619 Millions | |
| Recent Price: 0.44 Market Intelligence Score: 73 | |
| Day Percent Change: -1.20% Day Change: -0.01 | |
| Week Change: -3.28% Year-to-date Change: 17.0% | |
| TRX Links: Profile News Message Board | |
| Charts:- Daily , Weekly | |
| Add TRX to Watchlist: View: Get Complete TRX Trend Analysis ➞ | |
 | EMX EMX Royalty Corporation |
| Sector: Materials | |
| SubSector: Industrial Metals & Minerals | |
| MarketCap: 103.91 Millions | |
| Recent Price: 1.86 Market Intelligence Score: 61 | |
| Day Percent Change: 1.92% Day Change: 0.03 | |
| Week Change: -3.39% Year-to-date Change: 14.5% | |
| EMX Links: Profile News Message Board | |
| Charts:- Daily , Weekly | |
| Add EMX to Watchlist: View: Get Complete EMX Trend Analysis ➞ | |
 | FSI Flexible Solutions International Inc. |
| Sector: Materials | |
| SubSector: Specialty Chemicals | |
| MarketCap: 14.3357 Millions | |
| Recent Price: 2.12 Market Intelligence Score: 51 | |
| Day Percent Change: 0.71% Day Change: 0.02 | |
| Week Change: -3.42% Year-to-date Change: 10.7% | |
| FSI Links: Profile News Message Board | |
| Charts:- Daily , Weekly | |
| Add FSI to Watchlist: View: Get Complete FSI Trend Analysis ➞ | |
 | SAND Sandstorm Gold Ltd. |
| Sector: Materials | |
| SubSector: Gold | |
| MarketCap: 808.119 Millions | |
| Recent Price: 5.43 Market Intelligence Score: 51 | |
| Day Percent Change: -1.99% Day Change: -0.11 | |
| Week Change: -3.55% Year-to-date Change: 8.0% | |
| SAND Links: Profile News Message Board | |
| Charts:- Daily , Weekly | |
| Add SAND to Watchlist: View: Get Complete SAND Trend Analysis ➞ | |
 | IMO Imperial Oil Limited |
| Sector: Energy | |
| SubSector: Major Integrated Oil & Gas | |
| MarketCap: 8171.25 Millions | |
| Recent Price: 68.05 Market Intelligence Score: 41 | |
| Day Percent Change: -0.03% Day Change: -0.02 | |
| Week Change: -3.75% Year-to-date Change: 19.0% | |
| IMO Links: Profile News Message Board | |
| Charts:- Daily , Weekly | |
| Add IMO to Watchlist: View: Get Complete IMO Trend Analysis ➞ | |
 | FSM Fortuna Silver Mines Inc. |
| Sector: Materials | |
| SubSector: Silver | |
| MarketCap: 362.256 Millions | |
| Recent Price: 4.59 Market Intelligence Score: 58 | |
| Day Percent Change: -1.92% Day Change: -0.09 | |
| Week Change: -3.77% Year-to-date Change: 18.9% | |
| FSM Links: Profile News Message Board | |
| Charts:- Daily , Weekly | |
| Add FSM to Watchlist: View: Get Complete FSM Trend Analysis ➞ | |
 | OR Osisko Gold Royalties Ltd |
| Sector: Materials | |
| SubSector: Gold | |
| MarketCap: 1025.99 Millions | |
| Recent Price: 15.44 Market Intelligence Score: 51 | |
| Day Percent Change: -1.03% Day Change: -0.16 | |
| Week Change: -3.8% Year-to-date Change: 8.1% | |
| OR Links: Profile News Message Board | |
| Charts:- Daily , Weekly | |
| Add OR to Watchlist: View: Get Complete OR Trend Analysis ➞ | |
 | PAAS Pan American Silver Corp. |
| Sector: Materials | |
| SubSector: Silver | |
| MarketCap: 2832.56 Millions | |
| Recent Price: 18.25 Market Intelligence Score: 43 | |
| Day Percent Change: -0.71% Day Change: -0.13 | |
| Week Change: -4.05% Year-to-date Change: 11.8% | |
| PAAS Links: Profile News Message Board | |
| Charts:- Daily , Weekly | |
| Add PAAS to Watchlist: View: Get Complete PAAS Trend Analysis ➞ | |
 | MUX McEwen Mining Inc. |
| Sector: Materials | |
| SubSector: Gold | |
| MarketCap: 264.819 Millions | |
| Recent Price: 11.76 Market Intelligence Score: 83 | |
| Day Percent Change: 1.29% Day Change: 0.15 | |
| Week Change: -4.08% Year-to-date Change: 63.1% | |
| MUX Links: Profile News Message Board | |
| Charts:- Daily , Weekly | |
| Add MUX to Watchlist: View: Get Complete MUX Trend Analysis ➞ | |
 | SSRM SSR Mining Inc. |
| Sector: Materials | |
| SubSector: Gold | |
| MarketCap: 1546.09 Millions | |
| Recent Price: 5.34 Market Intelligence Score: 75 | |
| Day Percent Change: -1.11% Day Change: -0.06 | |
| Week Change: -4.13% Year-to-date Change: -50.4% | |
| SSRM Links: Profile News Message Board | |
| Charts:- Daily , Weekly | |
| Add SSRM to Watchlist: View: Get Complete SSRM Trend Analysis ➞ | |
 | CNQ Canadian Natural Resources Limited |
| Sector: Energy | |
| SubSector: Independent Oil & Gas | |
| MarketCap: 11925.2 Millions | |
| Recent Price: 74.65 Market Intelligence Score: 36 | |
| Day Percent Change: -0.28% Day Change: -0.21 | |
| Week Change: -4.26% Year-to-date Change: 13.9% | |
| CNQ Links: Profile News Message Board | |
| Charts:- Daily , Weekly | |
| Add CNQ to Watchlist: View: Get Complete CNQ Trend Analysis ➞ | |
 | CVE Cenovus Energy Inc. |
| Sector: Energy | |
| SubSector: Oil & Gas Drilling & Exploration | |
| MarketCap: 2369.29 Millions | |
| Recent Price: 20.49 Market Intelligence Score: 54 | |
| Day Percent Change: -0.39% Day Change: -0.08 | |
| Week Change: -4.52% Year-to-date Change: 23.1% | |
| CVE Links: Profile News Message Board | |
| Charts:- Daily , Weekly | |
| Add CVE to Watchlist: View: Get Complete CVE Trend Analysis ➞ | |
 | BTG B2Gold Corp. |
| Sector: Materials | |
| SubSector: Gold | |
| MarketCap: 2792.39 Millions | |
| Recent Price: 2.50 Market Intelligence Score: 36 | |
| Day Percent Change: -0.79% Day Change: -0.02 | |
| Week Change: -4.58% Year-to-date Change: -20.9% | |
| BTG Links: Profile News Message Board | |
| Charts:- Daily , Weekly | |
| Add BTG to Watchlist: View: Get Complete BTG Trend Analysis ➞ | |
 | ERF Enerplus Corporation |
| Sector: Energy | |
| SubSector: Oil & Gas Drilling & Exploration | |
| MarketCap: 372.639 Millions | |
| Recent Price: 19.56 Market Intelligence Score: 53 | |
| Day Percent Change: 0.41% Day Change: 0.08 | |
| Week Change: -4.63% Year-to-date Change: 27.5% | |
| ERF Links: Profile News Message Board | |
| Charts:- Daily , Weekly | |
| Add ERF to Watchlist: View: Get Complete ERF Trend Analysis ➞ | |
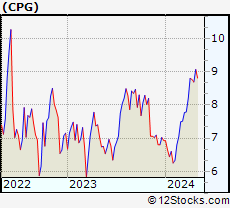 | CPG Crescent Point Energy Corp. |
| Sector: Energy | |
| SubSector: Independent Oil & Gas | |
| MarketCap: 381.593 Millions | |
| Recent Price: 8.65 Market Intelligence Score: 36 | |
| Day Percent Change: -0.69% Day Change: -0.06 | |
| Week Change: -4.63% Year-to-date Change: 24.8% | |
| CPG Links: Profile News Message Board | |
| Charts:- Daily , Weekly | |
| Add CPG to Watchlist: View: Get Complete CPG Trend Analysis ➞ | |
 | EXK Endeavour Silver Corp. |
| Sector: Materials | |
| SubSector: Silver | |
| MarketCap: 204.456 Millions | |
| Recent Price: 2.65 Market Intelligence Score: 58 | |
| Day Percent Change: -0.38% Day Change: -0.01 | |
| Week Change: -4.68% Year-to-date Change: 34.5% | |
| EXK Links: Profile News Message Board | |
| Charts:- Daily , Weekly | |
| Add EXK to Watchlist: View: Get Complete EXK Trend Analysis ➞ | |
 | AG First Majestic Silver Corp. |
| Sector: Materials | |
| SubSector: Silver | |
| MarketCap: 1128.56 Millions | |
| Recent Price: 6.70 Market Intelligence Score: 68 | |
| Day Percent Change: -0.30% Day Change: -0.02 | |
| Week Change: -4.83% Year-to-date Change: 8.9% | |
| AG Links: Profile News Message Board | |
| Charts:- Daily , Weekly | |
| Add AG to Watchlist: View: Get Complete AG Trend Analysis ➞ | |
 | MGA Magna International Inc. |
| Sector: Services & Goods | |
| SubSector: Auto Parts Wholesale | |
| MarketCap: 8967.3 Millions | |
| Recent Price: 46.70 Market Intelligence Score: 0 | |
| Day Percent Change: -3.55% Day Change: -1.72 | |
| Week Change: -4.93% Year-to-date Change: -21.0% | |
| MGA Links: Profile News Message Board | |
| Charts:- Daily , Weekly | |
| Add MGA to Watchlist: View: Get Complete MGA Trend Analysis ➞ | |
 | IAG IAMGOLD Corporation |
| Sector: Materials | |
| SubSector: Gold | |
| MarketCap: 1158.09 Millions | |
| Recent Price: 3.59 Market Intelligence Score: 58 | |
| Day Percent Change: -1.91% Day Change: -0.07 | |
| Week Change: -5.03% Year-to-date Change: 41.9% | |
| IAG Links: Profile News Message Board | |
| Charts:- Daily , Weekly | |
| Add IAG to Watchlist: View: Get Complete IAG Trend Analysis ➞ | |
 | PLG Platinum Group Metals Ltd. |
| Sector: Materials | |
| SubSector: Industrial Metals & Minerals | |
| MarketCap: 77.591 Millions | |
| Recent Price: 1.30 Market Intelligence Score: 73 | |
| Day Percent Change: -3.33% Day Change: -0.05 | |
| Week Change: -5.43% Year-to-date Change: 14.5% | |
| PLG Links: Profile News Message Board | |
| Charts:- Daily , Weekly | |
| Add PLG to Watchlist: View: Get Complete PLG Trend Analysis ➞ | |
| To view more stocks, click on Next / Previous arrows or select different range: 0 - 25 , 25 - 50 , 50 - 75 , 75 - 100 , 100 - 125 , 125 - 150 | ||
| Click To Change The Sort Order: By Market Cap or Company Size Performance: Year-to-date, Week and Day | |
| Select Chart Type: | ||
 Best Stocks Today 12Stocks.com |
© 2024 12Stocks.com Terms & Conditions Privacy Contact Us
All Information Provided Only For Education And Not To Be Used For Investing or Trading. See Terms & Conditions


One More Thing ... Get Best Stocks Delivered Daily!
Never Ever Miss A Move With Our Top Ten Stocks Lists
Find Best Stocks In Any Market - Bull or Bear Market
Take A Peek At Our Top Ten Stocks Lists: Daily, Weekly, Year-to-Date & Top Trends
Find Best Stocks In Any Market - Bull or Bear Market
Take A Peek At Our Top Ten Stocks Lists: Daily, Weekly, Year-to-Date & Top Trends
Canada Stocks With Best Up Trends [0-bearish to 100-bullish]: TransAlta [100], Brookfield Renewable[100], Algonquin Power[100], Royal Bank[100], City Office[100], CAE [100], Denison Mines[100], Mercer [100], Algonquin Power[100], Franco-Nevada [95], Manulife Financial[95]
Best Canada Stocks Year-to-Date:
Aurora Cannabis[1315.37%], Fusion [123.39%], Canopy Growth[100.39%], McEwen Mining[63.11%], D-Wave Quantum[60.13%], Hudbay Minerals[51.63%], IAMGOLD [41.9%], OrganiGram [41.6%], Endeavour Silver[34.52%], Gold Royalty[34.26%], Cronos [28.23%] Best Canada Stocks This Week:
Brookfield Renewable[20.81%], Tilray [17.42%], Canopy Growth[14.93%], Zymeworks [11.38%], Canadian Solar[10.83%], AbCellera Biologics[9.71%], Milestone [9.09%], Repare [8.13%], Ballard Power[8.08%], Xenon [8.02%], Algonquin Power[7.79%] Best Canada Stocks Daily:
AbCellera Biologics[11.49%], Lion Electric[8.71%], TransAlta [4.74%], Brookfield Renewable[4.54%], Algonquin Power[4.39%], Tilray [3.47%], Shopify [3.42%], TC Energy[3.32%], Repare [3.28%], Colliers [3.22%], Li-Cycle [2.98%]