
 Login Sign Up


| |||||
 |  | ||||

| 12Stocks.com Market Intelligence |
Best Canada Stocks
|
|
| Quick Read: Top Canada Stocks By Performances & Trends: Daily, Weekly, Year-to-Date, Market Cap (Size) & Technical Trends | |||
| Best Canada Views: Quick Browse View, Summary & Slide Show | |||
| 12Stocks.com Canada Stocks Performances & Trends Daily | |||||||||
|
|  The overall market intelligence score is 78 (0-bearish to 100-bullish) which puts Canada index in short term neutral to bullish trend. The market intelligence score from previous trading session is 56 and hence an improvement of trend.
| ||||||||
Here are the market intelligence trend scores of the most requested Canada stocks at 12Stocks.com (click stock name for detailed review):
| |||||||||||||||||
| Scroll down this page for most comprehensive review of Canada stocks by performance, trends, technical analysis, charts, fund plays & more | |||||||||||||||||


| 12Stocks.com: Top Performing Canada Index Stocks | ||||||||||||||||||||||||||||||||||||||||||||||||
 The top performing Canada Index stocks year to date are
Now, more recently, over last week, the top performing Canada Index stocks on the move are


|
||||||||||||||||||||||||||||||||||||||||||||||||
| 12Stocks.com: Investing in Canada Index with Stocks | |
|
The following table helps investors and traders sort through current performance and trends (as measured by market intelligence score) of various
stocks in the Canada Index. Quick View: Move mouse or cursor over stock symbol (ticker) to view short-term technical chart and over stock name to view long term chart. Click on  to add stock symbol to your watchlist and to add stock symbol to your watchlist and  to view watchlist. Click on any ticker or stock name for detailed market intelligence report for that stock. to view watchlist. Click on any ticker or stock name for detailed market intelligence report for that stock. |
12Stocks.com Performance of Stocks in Canada Index
| Ticker | Stock Name | Watchlist | Category | Recent Price | Market Intelligence Score | Change % | Weekly Change% |
| SLF | Sun Life |   | Financials | 52.45 | 64 | 0.76% | 1.52% |
| OGI | OrganiGram | | Health Care | 1.89 | 7 | 0.27% | 1.34% |
| RCI | | Technology | 38.46 | 42 | 1.45% | 1.32% | |
| ACHV | Achieve Life | | Health Care | 4.66 | 100 | -0.64% | 1.08% |
| SPPP | Sprott Physical | | Materials | 9.54 | 53 | 0.21% | 1.06% |
| DSGX | Descartes Systems | | Technology | 95.13 | 90 | -0.18% | 0.94% |
| GIB | CGI | | Technology | 104.01 | 50 | 1.86% | 0.84% |
| NTR | Nutrien | | Materials | 52.98 | 75 | 0.68% | 0.82% |
| MEOH | Methanex | | Materials | 48.60 | 88 | 1.00% | 0.68% |
| GOOS | Canada Goose | | Consumer Staples | 11.35 | 62 | -0.57% | 0.67% |
| BNS | Bank of Nova | | Financials | 46.77 | 32 | 1.02% | 0.45% |
| DOOO | BRP | | Consumer Staples | 68.95 | 68 | 1.38% | 0.31% |
| NGD | New Gold | | Materials | 1.81 | 66 | -0.27% | 0.28% |
| FSV | Service | | Financials | 150.17 | 42 | -0.40% | 0.25% |
| ACB | Aurora Cannabis | | Health Care | 6.71 | 58 | -3.66% | 0.22% |
| NVEI | Nuvei | | Technology | 32.36 | 75 | 0.17% | 0.20% |
| FUSN | Fusion | | Health Care | 21.44 | 63 | -0.23% | 0.09% |
| CM | Canadian Imperial | | Financials | 47.85 | 71 | 1.14% | 0.06% |
| BMO | Bank of Montreal | | Financials | 90.81 | 45 | 1.02% | -0.12% |
| CIGI | Colliers | | Financials | 107.88 | 32 | 3.12% | -0.14% |
| TFPM | Triple Flag | | Materials | 16.28 | 85 | -0.28% | -0.49% |
| APT | Alpha Tech | | Industrials | 6.12 | 78 | 0.91% | -0.57% |
| FNV | Franco-Nevada | | Materials | 122.11 | 88 | 1.00% | -0.66% |
| RBA | Ritchie Bros. | | Services & Goods | 72.54 | 32 | 1.90% | -0.87% |
| SVM | Silvercorp Metals | | Materials | 3.28 | 68 | -0.61% | -0.91% |
| To view more stocks, click on Next / Previous arrows or select different range: 0 - 25 , 25 - 50 , 50 - 75 , 75 - 100 , 100 - 125 , 125 - 150 | ||
 | Click To Change The Sort Order: By Market Cap or Company Size Performance: Year-to-date, Week and Day |  |
| Detailed Overview Of Canada Stocks |
| Canada Technical Overview, Leaders & Laggards, Top Canada ETF Funds & Detailed Canada Stocks List, Charts, Trends & More |
| Canada: Technical Analysis, Trends & YTD Performance | |
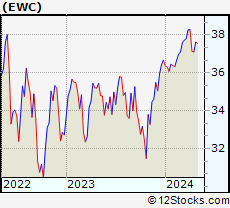
 EWC Weekly Chart |
|
| Long Term Trend: Very Good | |
| Medium Term Trend: Good | |
 EWC Daily Chart |
|
| Short Term Trend: Very Good | |
| Overall Trend Score: 78 | |
| YTD Performance: 2.28% | |
| **Trend Scores & Views Are Only For Educational Purposes And Not For Investing | |
| 12Stocks.com: Investing in Canada Index using Exchange Traded Funds | |
|
The following table shows list of key exchange traded funds (ETF) that
help investors play Canada stock market. For detailed view, check out our ETF Funds section of our website. Quick View: Move mouse or cursor over ETF symbol (ticker) to view short-term technical chart and over ETF name to view long term chart. Click on ticker or stock name for detailed view. Click on to add stock symbol to your watchlist and to view watchlist. |
12Stocks.com List of ETFs that track Canada Index
| Ticker | ETF Name | Watchlist | Recent Price | Market Intelligence Score | Change % | Week % | Year-to-date % |
| EWC | Canada | | 37.52 | 78 | 0.47 | -0.31 | 2.28% |
| 12Stocks.com: Charts, Trends, Fundamental Data and Performances of Canada Stocks | |
|
We now take in-depth look at all Canada stocks including charts, multi-period performances and overall trends (as measured by market intelligence score). One can sort Canada stocks (click link to choose) by Daily, Weekly and by Year-to-Date performances. Also, one can sort by size of the company or by market capitalization. |
| Select Your Default Chart Type: | |||||
| |||||
| Click on stock symbol or name for detailed view. Click on to add stock symbol to your watchlist and to view watchlist. Quick View: Move mouse or cursor over "Daily" to quickly view daily technical stock chart and over "Weekly" to view weekly technical stock chart. | |||||

 | SLF Sun Life Financial Inc. |
| Sector: Financials | |
| SubSector: Property & Casualty Insurance | |
| MarketCap: 17722 Millions | |
| Recent Price: 52.45 Market Intelligence Score: 64 | |
| Day Percent Change: 0.76% Day Change: 0.39 | |
| Week Change: 1.52% Year-to-date Change: 1.2% | |
| SLF Links: Profile News Message Board | |
| Charts:- Daily , Weekly | |
| Add SLF to Watchlist: View: Get Complete SLF Trend Analysis ➞ | |
 | OGI OrganiGram Holdings Inc. |
| Sector: Health Care | |
| SubSector: Drugs - Generic | |
| MarketCap: 256.885 Millions | |
| Recent Price: 1.89 Market Intelligence Score: 7 | |
| Day Percent Change: 0.27% Day Change: 0.01 | |
| Week Change: 1.34% Year-to-date Change: 43.9% | |
| OGI Links: Profile News Message Board | |
| Charts:- Daily , Weekly | |
| Add OGI to Watchlist: View: Get Complete OGI Trend Analysis ➞ | |
 | RCI Rogers Communications Inc. |
| Sector: Technology | |
| SubSector: Wireless Communications | |
| MarketCap: 22111.6 Millions | |
| Recent Price: 38.46 Market Intelligence Score: 42 | |
| Day Percent Change: 1.45% Day Change: 0.55 | |
| Week Change: 1.32% Year-to-date Change: -17.8% | |
| RCI Links: Profile News Message Board | |
| Charts:- Daily , Weekly | |
| Add RCI to Watchlist: View: Get Complete RCI Trend Analysis ➞ | |
 | ACHV Achieve Life Sciences, Inc. |
| Sector: Health Care | |
| SubSector: Biotechnology | |
| MarketCap: 7.32785 Millions | |
| Recent Price: 4.66 Market Intelligence Score: 100 | |
| Day Percent Change: -0.64% Day Change: -0.03 | |
| Week Change: 1.08% Year-to-date Change: 10.7% | |
| ACHV Links: Profile News Message Board | |
| Charts:- Daily , Weekly | |
| Add ACHV to Watchlist: View: Get Complete ACHV Trend Analysis ➞ | |
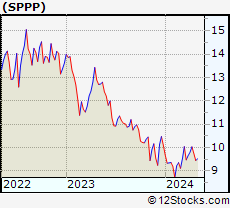 | SPPP Sprott Physical Platinum and Palladium Trust |
| Sector: Materials | |
| SubSector: Industrial Metals & Minerals | |
| MarketCap: 82.791 Millions | |
| Recent Price: 9.54 Market Intelligence Score: 53 | |
| Day Percent Change: 0.21% Day Change: 0.02 | |
| Week Change: 1.06% Year-to-date Change: -5.5% | |
| SPPP Links: Profile News Message Board | |
| Charts:- Daily , Weekly | |
| Add SPPP to Watchlist: View: Get Complete SPPP Trend Analysis ➞ | |
 | DSGX The Descartes Systems Group Inc |
| Sector: Technology | |
| SubSector: Business Software & Services | |
| MarketCap: 2830.58 Millions | |
| Recent Price: 95.13 Market Intelligence Score: 90 | |
| Day Percent Change: -0.18% Day Change: -0.17 | |
| Week Change: 0.94% Year-to-date Change: 13.2% | |
| DSGX Links: Profile News Message Board | |
| Charts:- Daily , Weekly | |
| Add DSGX to Watchlist: View: Get Complete DSGX Trend Analysis ➞ | |
 | GIB CGI Inc. |
| Sector: Technology | |
| SubSector: Information Technology Services | |
| MarketCap: 13185.3 Millions | |
| Recent Price: 104.01 Market Intelligence Score: 50 | |
| Day Percent Change: 1.86% Day Change: 1.90 | |
| Week Change: 0.84% Year-to-date Change: -3.0% | |
| GIB Links: Profile News Message Board | |
| Charts:- Daily , Weekly | |
| Add GIB to Watchlist: View: Get Complete GIB Trend Analysis ➞ | |
 | NTR Nutrien Ltd. |
| Sector: Materials | |
| SubSector: Agricultural Chemicals | |
| MarketCap: 15897.9 Millions | |
| Recent Price: 52.98 Market Intelligence Score: 75 | |
| Day Percent Change: 0.68% Day Change: 0.36 | |
| Week Change: 0.82% Year-to-date Change: -6.0% | |
| NTR Links: Profile News Message Board | |
| Charts:- Daily , Weekly | |
| Add NTR to Watchlist: View: Get Complete NTR Trend Analysis ➞ | |
 | MEOH Methanex Corporation |
| Sector: Materials | |
| SubSector: Specialty Chemicals | |
| MarketCap: 894.357 Millions | |
| Recent Price: 48.60 Market Intelligence Score: 88 | |
| Day Percent Change: 1.00% Day Change: 0.48 | |
| Week Change: 0.68% Year-to-date Change: 2.6% | |
| MEOH Links: Profile News Message Board | |
| Charts:- Daily , Weekly | |
| Add MEOH to Watchlist: View: Get Complete MEOH Trend Analysis ➞ | |
 | GOOS Canada Goose Holdings Inc. |
| Sector: Consumer Staples | |
| SubSector: Textile - Apparel Clothing | |
| MarketCap: 881.465 Millions | |
| Recent Price: 11.35 Market Intelligence Score: 62 | |
| Day Percent Change: -0.57% Day Change: -0.06 | |
| Week Change: 0.67% Year-to-date Change: -4.3% | |
| GOOS Links: Profile News Message Board | |
| Charts:- Daily , Weekly | |
| Add GOOS to Watchlist: View: Get Complete GOOS Trend Analysis ➞ | |
 | BNS The Bank of Nova Scotia |
| Sector: Financials | |
| SubSector: Money Center Banks | |
| MarketCap: 48742.1 Millions | |
| Recent Price: 46.77 Market Intelligence Score: 32 | |
| Day Percent Change: 1.02% Day Change: 0.47 | |
| Week Change: 0.45% Year-to-date Change: -3.9% | |
| BNS Links: Profile News Message Board | |
| Charts:- Daily , Weekly | |
| Add BNS to Watchlist: View: Get Complete BNS Trend Analysis ➞ | |
 | DOOO BRP Inc. |
| Sector: Consumer Staples | |
| SubSector: Recreational Vehicles | |
| MarketCap: 638.559 Millions | |
| Recent Price: 68.95 Market Intelligence Score: 68 | |
| Day Percent Change: 1.38% Day Change: 0.94 | |
| Week Change: 0.31% Year-to-date Change: -3.8% | |
| DOOO Links: Profile News Message Board | |
| Charts:- Daily , Weekly | |
| Add DOOO to Watchlist: View: Get Complete DOOO Trend Analysis ➞ | |
 | NGD New Gold Inc. |
| Sector: Materials | |
| SubSector: Gold | |
| MarketCap: 398.119 Millions | |
| Recent Price: 1.81 Market Intelligence Score: 66 | |
| Day Percent Change: -0.27% Day Change: -0.01 | |
| Week Change: 0.28% Year-to-date Change: 24.3% | |
| NGD Links: Profile News Message Board | |
| Charts:- Daily , Weekly | |
| Add NGD to Watchlist: View: Get Complete NGD Trend Analysis ➞ | |
 | FSV FirstService Corporation |
| Sector: Financials | |
| SubSector: Property Management | |
| MarketCap: 2793.92 Millions | |
| Recent Price: 150.17 Market Intelligence Score: 42 | |
| Day Percent Change: -0.40% Day Change: -0.60 | |
| Week Change: 0.25% Year-to-date Change: -7.4% | |
| FSV Links: Profile News Message Board | |
| Charts:- Daily , Weekly | |
| Add FSV to Watchlist: View: Get Complete FSV Trend Analysis ➞ | |
 | ACB Aurora Cannabis Inc. |
| Sector: Health Care | |
| SubSector: Drug Manufacturers - Other | |
| MarketCap: 853.333 Millions | |
| Recent Price: 6.71 Market Intelligence Score: 58 | |
| Day Percent Change: -3.66% Day Change: -0.25 | |
| Week Change: 0.22% Year-to-date Change: 1,310.1% | |
| ACB Links: Profile News Message Board | |
| Charts:- Daily , Weekly | |
| Add ACB to Watchlist: View: Get Complete ACB Trend Analysis ➞ | |
 | NVEI Nuvei Corporation |
| Sector: Technology | |
| SubSector: Software - Infrastructure | |
| MarketCap: 5490 Millions | |
| Recent Price: 32.36 Market Intelligence Score: 75 | |
| Day Percent Change: 0.17% Day Change: 0.05 | |
| Week Change: 0.2% Year-to-date Change: 23.2% | |
| NVEI Links: Profile News Message Board | |
| Charts:- Daily , Weekly | |
| Add NVEI to Watchlist: View: Get Complete NVEI Trend Analysis ➞ | |
 | FUSN Fusion Pharmaceuticals Inc. |
| Sector: Health Care | |
| SubSector: Biotechnology | |
| MarketCap: 52487 Millions | |
| Recent Price: 21.44 Market Intelligence Score: 63 | |
| Day Percent Change: -0.23% Day Change: -0.05 | |
| Week Change: 0.09% Year-to-date Change: 123.3% | |
| FUSN Links: Profile News Message Board | |
| Charts:- Daily , Weekly | |
| Add FUSN to Watchlist: View: Get Complete FUSN Trend Analysis ➞ | |
 | CM Canadian Imperial Bank of Commerce |
| Sector: Financials | |
| SubSector: Money Center Banks | |
| MarketCap: 27150.5 Millions | |
| Recent Price: 47.85 Market Intelligence Score: 71 | |
| Day Percent Change: 1.14% Day Change: 0.54 | |
| Week Change: 0.06% Year-to-date Change: -0.6% | |
| CM Links: Profile News Message Board | |
| Charts:- Daily , Weekly | |
| Add CM to Watchlist: View: Get Complete CM Trend Analysis ➞ | |
 | BMO Bank of Montreal |
| Sector: Financials | |
| SubSector: Money Center Banks | |
| MarketCap: 32830.2 Millions | |
| Recent Price: 90.81 Market Intelligence Score: 45 | |
| Day Percent Change: 1.02% Day Change: 0.92 | |
| Week Change: -0.12% Year-to-date Change: -8.2% | |
| BMO Links: Profile News Message Board | |
| Charts:- Daily , Weekly | |
| Add BMO to Watchlist: View: Get Complete BMO Trend Analysis ➞ | |
 | CIGI Colliers International Group Inc. |
| Sector: Financials | |
| SubSector: Property Management | |
| MarketCap: 1928.42 Millions | |
| Recent Price: 107.88 Market Intelligence Score: 32 | |
| Day Percent Change: 3.12% Day Change: 3.27 | |
| Week Change: -0.14% Year-to-date Change: -14.7% | |
| CIGI Links: Profile News Message Board | |
| Charts:- Daily , Weekly | |
| Add CIGI to Watchlist: View: Get Complete CIGI Trend Analysis ➞ | |
 | TFPM Triple Flag Precious Metals Corp. |
| Sector: Materials | |
| SubSector: Other Precious Metals & Mining | |
| MarketCap: 3640 Millions | |
| Recent Price: 16.28 Market Intelligence Score: 85 | |
| Day Percent Change: -0.28% Day Change: -0.04 | |
| Week Change: -0.49% Year-to-date Change: 23.0% | |
| TFPM Links: Profile News Message Board | |
| Charts:- Daily , Weekly | |
| Add TFPM to Watchlist: View: Get Complete TFPM Trend Analysis ➞ | |
 | APT Alpha Pro Tech, Ltd. |
| Sector: Industrials | |
| SubSector: General Building Materials | |
| MarketCap: 125.953 Millions | |
| Recent Price: 6.12 Market Intelligence Score: 78 | |
| Day Percent Change: 0.91% Day Change: 0.06 | |
| Week Change: -0.57% Year-to-date Change: 15.6% | |
| APT Links: Profile News Message Board | |
| Charts:- Daily , Weekly | |
| Add APT to Watchlist: View: Get Complete APT Trend Analysis ➞ | |
 | FNV Franco-Nevada Corporation |
| Sector: Materials | |
| SubSector: Gold | |
| MarketCap: 17703.9 Millions | |
| Recent Price: 122.11 Market Intelligence Score: 88 | |
| Day Percent Change: 1.00% Day Change: 1.20 | |
| Week Change: -0.66% Year-to-date Change: 10.2% | |
| FNV Links: Profile News Message Board | |
| Charts:- Daily , Weekly | |
| Add FNV to Watchlist: View: Get Complete FNV Trend Analysis ➞ | |
 | RBA Ritchie Bros. Auctioneers Incorporated |
| Sector: Services & Goods | |
| SubSector: Business Services | |
| MarketCap: 3491.02 Millions | |
| Recent Price: 72.54 Market Intelligence Score: 32 | |
| Day Percent Change: 1.90% Day Change: 1.35 | |
| Week Change: -0.87% Year-to-date Change: 8.5% | |
| RBA Links: Profile News Message Board | |
| Charts:- Daily , Weekly | |
| Add RBA to Watchlist: View: Get Complete RBA Trend Analysis ➞ | |
 | SVM Silvercorp Metals Inc. |
| Sector: Materials | |
| SubSector: Silver | |
| MarketCap: 504.056 Millions | |
| Recent Price: 3.28 Market Intelligence Score: 68 | |
| Day Percent Change: -0.61% Day Change: -0.02 | |
| Week Change: -0.91% Year-to-date Change: 24.7% | |
| SVM Links: Profile News Message Board | |
| Charts:- Daily , Weekly | |
| Add SVM to Watchlist: View: Get Complete SVM Trend Analysis ➞ | |
| To view more stocks, click on Next / Previous arrows or select different range: 0 - 25 , 25 - 50 , 50 - 75 , 75 - 100 , 100 - 125 , 125 - 150 | ||
| Click To Change The Sort Order: By Market Cap or Company Size Performance: Year-to-date, Week and Day | |
| Select Chart Type: | ||
 Best Stocks Today 12Stocks.com |
© 2024 12Stocks.com Terms & Conditions Privacy Contact Us
All Information Provided Only For Education And Not To Be Used For Investing or Trading. See Terms & Conditions


One More Thing ... Get Best Stocks Delivered Daily!
Never Ever Miss A Move With Our Top Ten Stocks Lists
Find Best Stocks In Any Market - Bull or Bear Market
Take A Peek At Our Top Ten Stocks Lists: Daily, Weekly, Year-to-Date & Top Trends
Find Best Stocks In Any Market - Bull or Bear Market
Take A Peek At Our Top Ten Stocks Lists: Daily, Weekly, Year-to-Date & Top Trends
Canada Stocks With Best Up Trends [0-bearish to 100-bullish]: TransAlta [100], Algonquin Power[100], Brookfield Renewable[100], Royal Bank[100], CAE [100], Mercer [100], City Office[100], Algonquin Power[100], Manulife Financial[95], Fortis [95], Enbridge [95]
Best Canada Stocks Year-to-Date:
Aurora Cannabis[1310.12%], Fusion [123.33%], Canopy Growth[97.85%], McEwen Mining[61.17%], D-Wave Quantum[60.13%], Hudbay Minerals[51%], OrganiGram [43.89%], IAMGOLD [41.9%], Endeavour Silver[34.77%], Gold Royalty[34.26%], Enerplus [27.09%] Best Canada Stocks This Week:
Brookfield Renewable[20.43%], Tilray [16.29%], Canopy Growth[13.47%], Repare [11.88%], Zymeworks [11.26%], Canadian Solar[10.33%], AbCellera Biologics[9.71%], Ballard Power[8.27%], Algonquin Power[7.79%], CAE [7.56%], Algonquin Power[7.27%] Best Canada Stocks Daily:
AbCellera Biologics[11.49%], Lion Electric[8.71%], Repare [6.87%], TransAlta [4.67%], Algonquin Power[4.39%], Brookfield Renewable[4.22%], Shopify [3.22%], Colliers [3.12%], Ballard Power[3.11%], Li-Cycle [2.98%], SunOpta [2.83%]