
 Login Sign Up


| |||||
 |  | ||||

| 12Stocks.com Market Intelligence |
Best Canada Stocks
|
|
| Quick Read: Top Canada Stocks By Performances & Trends: Daily, Weekly, Year-to-Date, Market Cap (Size) & Technical Trends | |||
| Best Canada Views: Quick Browse View, Summary & Slide Show | |||
| 12Stocks.com Canada Stocks Performances & Trends Daily | |||||||||
|
|  The overall market intelligence score is 90 (0-bearish to 100-bullish) which puts Canada index in short term bullish trend. The market intelligence score from previous trading session is 90 and an improvement of trend continues.
| ||||||||
Here are the market intelligence trend scores of the most requested Canada stocks at 12Stocks.com (click stock name for detailed review):
| ||||||||||||||||||||||||
| Scroll down this page for most comprehensive review of Canada stocks by performance, trends, technical analysis, charts, fund plays & more | ||||||||||||||||||||||||

| 12Stocks.com: Top Performing Canada Index Stocks | ||||||||||||||||||||||||||||||||||||||||||||||||
 The top performing Canada Index stocks year to date are
Now, more recently, over last week, the top performing Canada Index stocks on the move are


|
||||||||||||||||||||||||||||||||||||||||||||||||
| 12Stocks.com: Investing in Canada Index with Stocks | |
|
The following table helps investors and traders sort through current performance and trends (as measured by market intelligence score) of various
stocks in the Canada Index. Quick View: Move mouse or cursor over stock symbol (ticker) to view short-term technical chart and over stock name to view long term chart. Click on  to add stock symbol to your watchlist and to add stock symbol to your watchlist and  to view watchlist. Click on any ticker or stock name for detailed market intelligence report for that stock. to view watchlist. Click on any ticker or stock name for detailed market intelligence report for that stock. |
12Stocks.com Performance of Stocks in Canada Index
| Ticker | Stock Name | Watchlist | Category | Recent Price | Market Intelligence Score | Change % | YTD Change% |
| PAAS | Pan American |   | Materials | 34.60 | 100 | 3.04% | 63.30% |
| BTG | B2gold Corp | | Materials | 4.17 | 80 | 3.22% | 63.09% |
| FNV | Franco-Nevada | | Materials | 193.79 | 100 | 1.98% | 60.77% |
| LOOP | Loop Industries | | Materials | 1.86 | 100 | 10.71% | 57.63% |
| SVM | Silvercorp Metals | | Materials | 4.92 | 60 | -0.40% | 56.64% |
| TMQ | Trilogy Metals | | Materials | 1.84 | 100 | 4.55% | 54.62% |
| AG | Majestic Silver | | Materials | 9.15 | 50 | 0.88% | 54.08% |
| EXK | Endeavour Silver | | Materials | 5.99 | 50 | -2.44% | 49.75% |
| HBM | Hudbay Minerals | | Materials | 12.72 | 100 | 2.58% | 49.62% |
| SA | Seabridge Gold | | Materials | 17.73 | 100 | 2.25% | 47.26% |
| VOXR | Vox Royalty | | Materials | 3.54 | 50 | 3.21% | 46.94% |
| TD | Toronto Dominion | | Financials | 74.46 | 40 | -0.33% | 45.49% |
| CCJ | Cameco Corp | | Energy | 75.85 | 70 | -0.60% | 45.42% |
| IMO | Imperial Oil | | Energy | 87.28 | 50 | -0.22% | 41.69% |
| AUPH | Aurinia | | Health Care | 12.40 | 90 | -1.04% | 41.39% |
| PSLV | Sprott Physical | | Financials | 13.86 | 100 | 0.87% | 40.57% |
| ABCL | AbCellera Biologics | | Health Care | 4.22 | 60 | 1.44% | 39.27% |
| STN | Stantec | | Industrials | 108.05 | 10 | -1.13% | 38.04% |
| CEF | Sprott Physical | | Financials | 33.40 | 100 | 0.97% | 37.79% |
| MOGO | Mogo | | Technology | 1.83 | 50 | 3.98% | 37.59% |
| WRN | Western Copper | | Materials | 1.51 | 90 | 1.34% | 37.27% |
| SHOP | Shopify | | Technology | 146.82 | 90 | 1.15% | 36.54% |
| CIO | City Office | | Financials | 6.94 | 70 | -0.14% | 35.50% |
| PHYS | Sprott Physical | | Financials | 27.60 | 100 | 1.21% | 35.03% |
| GOOS | Canada Goose | | Services & Goods | 13.39 | 80 | 2.06% | 34.84% |
| To view more stocks, click on Next / Previous arrows or select different range: 0 - 25 , 25 - 50 , 50 - 75 , 75 - 100 , 100 - 125 , 125 - 150 , 150 - 175 , 175 - 200 , 200 - 225 , 225 - 250 | ||
 | Click To Change The Sort Order: By Market Cap or Company Size Performance: Year-to-date, Week and Day |  |
| Detailed Overview Of Canada Stocks |
| Canada Technical Overview, Leaders & Laggards, Top Canada ETF Funds & Detailed Canada Stocks List, Charts, Trends & More |
| Canada: Technical Analysis, Trends & YTD Performance | |
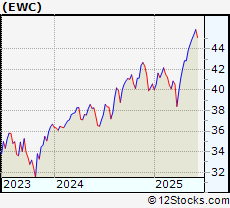
 EWC Weekly Chart |
|
| Long Term Trend: Very Good | |
| Medium Term Trend: Good | |
 EWC Daily Chart |
|
| Short Term Trend: Good | |
| Overall Trend Score: 90 | |
| YTD Performance: 22.6769% | |
| **Trend Scores & Views Are Only For Educational Purposes And Not For Investing | |
| 12Stocks.com: Investing in Canada Index using Exchange Traded Funds | |
|
The following table shows list of key exchange traded funds (ETF) that
help investors play Canada stock market. For detailed view, check out our ETF Funds section of our website. Quick View: Move mouse or cursor over ETF symbol (ticker) to view short-term technical chart and over ETF name to view long term chart. Click on ticker or stock name for detailed view. Click on to add stock symbol to your watchlist and to view watchlist. |
12Stocks.com List of ETFs that track Canada Index
| Ticker | ETF Name | Watchlist | Recent Price | Market Intelligence Score | Change % | Week % | Year-to-date % |
| FCAN | Canada AlphaDEX | | 93.12 | 70 | -0.608389 | 10.3841 | 0% |
| QCAN | Canada StrategicFactors | | 59.03 | 10 | 0 | 0 | 0% |
| 12Stocks.com: Charts, Trends, Fundamental Data and Performances of Canada Stocks | |
|
We now take in-depth look at all Canada stocks including charts, multi-period performances and overall trends (as measured by market intelligence score). One can sort Canada stocks (click link to choose) by Daily, Weekly and by Year-to-Date performances. Also, one can sort by size of the company or by market capitalization. |
| Select Your Default Chart Type: | |||||
| |||||
| Click on stock symbol or name for detailed view. Click on to add stock symbol to your watchlist and to view watchlist. Quick View: Move mouse or cursor over "Daily" to quickly view daily technical stock chart and over "Weekly" to view weekly technical stock chart. | |||||

 | PAAS Pan American Silver Corp |
| Sector: Materials | |
| SubSector: Gold | |
| MarketCap: 12518.3 Millions | |
| Recent Price: 34.60 Market Intelligence Score: 100 | |
| Day Percent Change: 3.03752% Day Change: 0.77 | |
| Week Change: 4.84848% Year-to-date Change: 63.3% | |
| PAAS Links: Profile News Message Board | |
| Charts:- Daily , Weekly | |
| Add PAAS to Watchlist: View: Get Complete PAAS Trend Analysis ➞ | |
 | BTG B2gold Corp |
| Sector: Materials | |
| SubSector: Gold | |
| MarketCap: 5516.87 Millions | |
| Recent Price: 4.17 Market Intelligence Score: 80 | |
| Day Percent Change: 3.21782% Day Change: 0.09 | |
| Week Change: 2.70936% Year-to-date Change: 63.1% | |
| BTG Links: Profile News Message Board | |
| Charts:- Daily , Weekly | |
| Add BTG to Watchlist: View: Get Complete BTG Trend Analysis ➞ | |
 | FNV Franco-Nevada Corporation |
| Sector: Materials | |
| SubSector: Gold | |
| MarketCap: 37343.3 Millions | |
| Recent Price: 193.79 Market Intelligence Score: 100 | |
| Day Percent Change: 1.97863% Day Change: 3.52 | |
| Week Change: 4.30594% Year-to-date Change: 60.8% | |
| FNV Links: Profile News Message Board | |
| Charts:- Daily , Weekly | |
| Add FNV to Watchlist: View: Get Complete FNV Trend Analysis ➞ | |
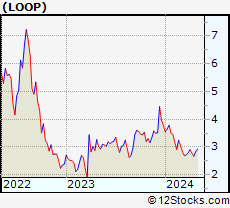 | LOOP Loop Industries Inc |
| Sector: Materials | |
| SubSector: Specialty Chemicals | |
| MarketCap: 88.76 Millions | |
| Recent Price: 1.86 Market Intelligence Score: 100 | |
| Day Percent Change: 10.7143% Day Change: -0.03 | |
| Week Change: 24% Year-to-date Change: 57.6% | |
| LOOP Links: Profile News Message Board | |
| Charts:- Daily , Weekly | |
| Add LOOP to Watchlist: View: Get Complete LOOP Trend Analysis ➞ | |
 | SVM Silvercorp Metals Inc |
| Sector: Materials | |
| SubSector: Silver | |
| MarketCap: 1075.66 Millions | |
| Recent Price: 4.92 Market Intelligence Score: 60 | |
| Day Percent Change: -0.404858% Day Change: 0.07 | |
| Week Change: 5.12821% Year-to-date Change: 56.6% | |
| SVM Links: Profile News Message Board | |
| Charts:- Daily , Weekly | |
| Add SVM to Watchlist: View: Get Complete SVM Trend Analysis ➞ | |
 | TMQ Trilogy Metals Inc |
| Sector: Materials | |
| SubSector: Other Industrial Metals & Mining | |
| MarketCap: 302.2 Millions | |
| Recent Price: 1.84 Market Intelligence Score: 100 | |
| Day Percent Change: 4.54545% Day Change: 0 | |
| Week Change: 10.1796% Year-to-date Change: 54.6% | |
| TMQ Links: Profile News Message Board | |
| Charts:- Daily , Weekly | |
| Add TMQ to Watchlist: View: Get Complete TMQ Trend Analysis ➞ | |
 | AG First Majestic Silver Corporation |
| Sector: Materials | |
| SubSector: Silver | |
| MarketCap: 4434 Millions | |
| Recent Price: 9.15 Market Intelligence Score: 50 | |
| Day Percent Change: 0.882029% Day Change: 0.18 | |
| Week Change: 0.770925% Year-to-date Change: 54.1% | |
| AG Links: Profile News Message Board | |
| Charts:- Daily , Weekly | |
| Add AG to Watchlist: View: Get Complete AG Trend Analysis ➞ | |
 | EXK Endeavour Silver Corp |
| Sector: Materials | |
| SubSector: Silver | |
| MarketCap: 1734.34 Millions | |
| Recent Price: 5.99 Market Intelligence Score: 50 | |
| Day Percent Change: -2.443% Day Change: 0.22 | |
| Week Change: 0.841751% Year-to-date Change: 49.8% | |
| EXK Links: Profile News Message Board | |
| Charts:- Daily , Weekly | |
| Add EXK to Watchlist: View: Get Complete EXK Trend Analysis ➞ | |
 | HBM Hudbay Minerals Inc |
| Sector: Materials | |
| SubSector: Copper | |
| MarketCap: 5024.4 Millions | |
| Recent Price: 12.72 Market Intelligence Score: 100 | |
| Day Percent Change: 2.58065% Day Change: 0.29 | |
| Week Change: 9.74978% Year-to-date Change: 49.6% | |
| HBM Links: Profile News Message Board | |
| Charts:- Daily , Weekly | |
| Add HBM to Watchlist: View: Get Complete HBM Trend Analysis ➞ | |
 | SA Seabridge Gold, Inc |
| Sector: Materials | |
| SubSector: Gold | |
| MarketCap: 1782.57 Millions | |
| Recent Price: 17.73 Market Intelligence Score: 100 | |
| Day Percent Change: 2.24914% Day Change: 0.2 | |
| Week Change: 6.74293% Year-to-date Change: 47.3% | |
| SA Links: Profile News Message Board | |
| Charts:- Daily , Weekly | |
| Add SA to Watchlist: View: Get Complete SA Trend Analysis ➞ | |
 | VOXR Vox Royalty Corp |
| Sector: Materials | |
| SubSector: Other Precious Metals & Mining | |
| MarketCap: 179.69 Millions | |
| Recent Price: 3.54 Market Intelligence Score: 50 | |
| Day Percent Change: 3.207% Day Change: 0.15 | |
| Week Change: -2.20994% Year-to-date Change: 46.9% | |
| VOXR Links: Profile News Message Board | |
| Charts:- Daily , Weekly | |
| Add VOXR to Watchlist: View: Get Complete VOXR Trend Analysis ➞ | |
 | TD Toronto Dominion Bank |
| Sector: Financials | |
| SubSector: Banks - Diversified | |
| MarketCap: 130432 Millions | |
| Recent Price: 74.46 Market Intelligence Score: 40 | |
| Day Percent Change: -0.334627% Day Change: -0.07 | |
| Week Change: -2.20646% Year-to-date Change: 45.5% | |
| TD Links: Profile News Message Board | |
| Charts:- Daily , Weekly | |
| Add TD to Watchlist: View: Get Complete TD Trend Analysis ➞ | |
 | CCJ Cameco Corp |
| Sector: Energy | |
| SubSector: Uranium | |
| MarketCap: 33024.3 Millions | |
| Recent Price: 75.85 Market Intelligence Score: 70 | |
| Day Percent Change: -0.602804% Day Change: 0.96 | |
| Week Change: 0.757173% Year-to-date Change: 45.4% | |
| CCJ Links: Profile News Message Board | |
| Charts:- Daily , Weekly | |
| Add CCJ to Watchlist: View: Get Complete CCJ Trend Analysis ➞ | |
 | IMO Imperial Oil Ltd |
| Sector: Energy | |
| SubSector: Oil & Gas Integrated | |
| MarketCap: 44429.9 Millions | |
| Recent Price: 87.28 Market Intelligence Score: 50 | |
| Day Percent Change: -0.217217% Day Change: 1.07 | |
| Week Change: -2.82788% Year-to-date Change: 41.7% | |
| IMO Links: Profile News Message Board | |
| Charts:- Daily , Weekly | |
| Add IMO to Watchlist: View: Get Complete IMO Trend Analysis ➞ | |
 | AUPH Aurinia Pharmaceuticals Inc |
| Sector: Health Care | |
| SubSector: Biotechnology | |
| MarketCap: 1632.21 Millions | |
| Recent Price: 12.40 Market Intelligence Score: 90 | |
| Day Percent Change: -1.03751% Day Change: 0.07 | |
| Week Change: 2.39472% Year-to-date Change: 41.4% | |
| AUPH Links: Profile News Message Board | |
| Charts:- Daily , Weekly | |
| Add AUPH to Watchlist: View: Get Complete AUPH Trend Analysis ➞ | |
 | PSLV Sprott Physical Silver Trust |
| Sector: Financials | |
| SubSector: Asset Management | |
| MarketCap: 7808.02 Millions | |
| Recent Price: 13.86 Market Intelligence Score: 100 | |
| Day Percent Change: 0.873362% Day Change: 0.09 | |
| Week Change: 6.2069% Year-to-date Change: 40.6% | |
| PSLV Links: Profile News Message Board | |
| Charts:- Daily , Weekly | |
| Add PSLV to Watchlist: View: Get Complete PSLV Trend Analysis ➞ | |
 | ABCL AbCellera Biologics Inc |
| Sector: Health Care | |
| SubSector: Biotechnology | |
| MarketCap: 1261.07 Millions | |
| Recent Price: 4.22 Market Intelligence Score: 60 | |
| Day Percent Change: 1.44231% Day Change: 0.13 | |
| Week Change: -2.98851% Year-to-date Change: 39.3% | |
| ABCL Links: Profile News Message Board | |
| Charts:- Daily , Weekly | |
| Add ABCL to Watchlist: View: Get Complete ABCL Trend Analysis ➞ | |
 | STN Stantec Inc |
| Sector: Industrials | |
| SubSector: Engineering & Construction | |
| MarketCap: 12325.3 Millions | |
| Recent Price: 108.05 Market Intelligence Score: 10 | |
| Day Percent Change: -1.1346% Day Change: 2.12 | |
| Week Change: -1.26108% Year-to-date Change: 38.0% | |
| STN Links: Profile News Message Board | |
| Charts:- Daily , Weekly | |
| Add STN to Watchlist: View: Get Complete STN Trend Analysis ➞ | |
 | CEF Sprott Physical Gold and Silver Trust |
| Sector: Financials | |
| SubSector: Asset Management | |
| MarketCap: 6468.88 Millions | |
| Recent Price: 33.40 Market Intelligence Score: 100 | |
| Day Percent Change: 0.967352% Day Change: -0.02 | |
| Week Change: 5.9981% Year-to-date Change: 37.8% | |
| CEF Links: Profile News Message Board | |
| Charts:- Daily , Weekly | |
| Add CEF to Watchlist: View: Get Complete CEF Trend Analysis ➞ | |
 | MOGO Mogo Inc |
| Sector: Technology | |
| SubSector: Software - Infrastructure | |
| MarketCap: 43.83 Millions | |
| Recent Price: 1.83 Market Intelligence Score: 50 | |
| Day Percent Change: 3.97727% Day Change: -0.03 | |
| Week Change: -4.6875% Year-to-date Change: 37.6% | |
| MOGO Links: Profile News Message Board | |
| Charts:- Daily , Weekly | |
| Add MOGO to Watchlist: View: Get Complete MOGO Trend Analysis ➞ | |
 | WRN Western Copper & Gold Corp |
| Sector: Materials | |
| SubSector: Other Industrial Metals & Mining | |
| MarketCap: 306.71 Millions | |
| Recent Price: 1.51 Market Intelligence Score: 90 | |
| Day Percent Change: 1.34228% Day Change: 0.03 | |
| Week Change: 6.33803% Year-to-date Change: 37.3% | |
| WRN Links: Profile News Message Board | |
| Charts:- Daily , Weekly | |
| Add WRN to Watchlist: View: Get Complete WRN Trend Analysis ➞ | |
 | SHOP Shopify Inc |
| Sector: Technology | |
| SubSector: Software - Application | |
| MarketCap: 190816 Millions | |
| Recent Price: 146.82 Market Intelligence Score: 90 | |
| Day Percent Change: 1.15053% Day Change: -0.61 | |
| Week Change: 4.23855% Year-to-date Change: 36.5% | |
| SHOP Links: Profile News Message Board | |
| Charts:- Daily , Weekly | |
| Add SHOP to Watchlist: View: Get Complete SHOP Trend Analysis ➞ | |
 | CIO City Office REIT Inc |
| Sector: Financials | |
| SubSector: REIT - Office | |
| MarketCap: 280.12 Millions | |
| Recent Price: 6.94 Market Intelligence Score: 70 | |
| Day Percent Change: -0.143885% Day Change: 0 | |
| Week Change: -0.143885% Year-to-date Change: 35.5% | |
| CIO Links: Profile News Message Board | |
| Charts:- Daily , Weekly | |
| Add CIO to Watchlist: View: Get Complete CIO Trend Analysis ➞ | |
 | PHYS Sprott Physical Gold Trust |
| Sector: Financials | |
| SubSector: Asset Management | |
| MarketCap: 12808.3 Millions | |
| Recent Price: 27.60 Market Intelligence Score: 100 | |
| Day Percent Change: 1.21012% Day Change: -0.08 | |
| Week Change: 5.90944% Year-to-date Change: 35.0% | |
| PHYS Links: Profile News Message Board | |
| Charts:- Daily , Weekly | |
| Add PHYS to Watchlist: View: Get Complete PHYS Trend Analysis ➞ | |
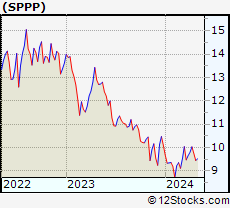 | SPPP Sprott Physical Platinum and Palladium Trust |
| Sector: Financials | |
| SubSector: Asset Management | |
| MarketCap: Millions | |
| Recent Price: 12.15 Market Intelligence Score: 50 | |
| Day Percent Change: -0.4914% Day Change: 0.08 | |
| Week Change: 2.35889% Year-to-date Change: 35.0% | |
| SPPP Links: Profile News Message Board | |
| Charts:- Daily , Weekly | |
| Add SPPP to Watchlist: View: Get Complete SPPP Trend Analysis ➞ | |
| To view more stocks, click on Next / Previous arrows or select different range: 0 - 25 , 25 - 50 , 50 - 75 , 75 - 100 , 100 - 125 , 125 - 150 , 150 - 175 , 175 - 200 , 200 - 225 , 225 - 250 | ||
| Click To Change The Sort Order: By Market Cap or Company Size Performance: Year-to-date, Week and Day | |
| Select Chart Type: | ||
 Best Stocks Today 12Stocks.com |
© 2025 12Stocks.com Terms & Conditions Privacy Contact Us
All Information Provided Only For Education And Not To Be Used For Investing or Trading. See Terms & Conditions


One More Thing ... Get Best Stocks Delivered Daily!
Never Ever Miss A Move With Our Top Ten Stocks Lists
Find Best Stocks In Any Market - Bull or Bear Market
Take A Peek At Our Top Ten Stocks Lists: Daily, Weekly, Year-to-Date & Top Trends
Find Best Stocks In Any Market - Bull or Bear Market
Take A Peek At Our Top Ten Stocks Lists: Daily, Weekly, Year-to-Date & Top Trends
Canada Stocks With Best Up Trends [0-bearish to 100-bullish]: Celestica [100], Equinox Gold[100], Gold Royalty[100], EMX Royalty[100], Iamgold Corp[100], Trilogy Metals[100], Barrick Mining[100], Methanex Corp[100], Eldorado Gold[100], Turquo Hill[100], Denison Mines[100]
Best Canada Stocks Year-to-Date:
Americas Gold[605.128%], Avino Silver[339.322%], Gold Royalty[209.677%], Tower Hill[199.363%], Celestica [160.75%], New Gold[140.458%], EMX Royalty[133.908%], Kinross Gold[124.846%], Sandstorm Gold[102.209%], Agnico Eagle[86.6197%], OR Royalties[85.4636%] Best Canada Stocks This Week:
Crescent Point[4066.17%], Golden Star[1837.95%], Alexco Resource[690.301%], Yamana Gold[625.812%], Novelion [579.167%], Turquo Hill[433.11%], Enerplus [415.601%], Nevsun Resources[402.516%], Bellatrix Exploration[291.621%], Domtar [250.297%], Trillium [203.688%] Best Canada Stocks Daily:
Canadian Solar[15.036%], Celestica [9.64128%], Equinox Gold[9.0301%], Ballard Power[7.56757%], Novelion [7.37813%], Gold Royalty[6.66667%], EMX Royalty[6.5445%], Canopy Growth[5.7971%], Iamgold Corp[4.75687%], Teck Resources[4.69942%], Trilogy Metals[4.54545%]