
 Login Sign Up


| |||||
 |  | ||||

| 12Stocks.com Market Intelligence |
Best Canada Stocks
|
|
| Quick Read: Top Canada Stocks By Performances & Trends: Daily, Weekly, Year-to-Date, Market Cap (Size) & Technical Trends | |||
| Best Canada Views: Quick Browse View, Summary & Slide Show | |||
| 12Stocks.com Canada Stocks Performances & Trends Daily | |||||||||
|
|  The overall market intelligence score is 90 (0-bearish to 100-bullish) which puts Canada index in short term bullish trend. The market intelligence score from previous trading session is 90 and an improvement of trend continues.
| ||||||||
Here are the market intelligence trend scores of the most requested Canada stocks at 12Stocks.com (click stock name for detailed review):
| ||||||||||||||||||||||||
| Scroll down this page for most comprehensive review of Canada stocks by performance, trends, technical analysis, charts, fund plays & more | ||||||||||||||||||||||||

| 12Stocks.com: Top Performing Canada Index Stocks | ||||||||||||||||||||||||||||||||||||||||||||||||
 The top performing Canada Index stocks year to date are
Now, more recently, over last week, the top performing Canada Index stocks on the move are


|
||||||||||||||||||||||||||||||||||||||||||||||||
| 12Stocks.com: Investing in Canada Index with Stocks | |
|
The following table helps investors and traders sort through current performance and trends (as measured by market intelligence score) of various
stocks in the Canada Index. Quick View: Move mouse or cursor over stock symbol (ticker) to view short-term technical chart and over stock name to view long term chart. Click on  to add stock symbol to your watchlist and to add stock symbol to your watchlist and  to view watchlist. Click on any ticker or stock name for detailed market intelligence report for that stock. to view watchlist. Click on any ticker or stock name for detailed market intelligence report for that stock. |
12Stocks.com Performance of Stocks in Canada Index
| Ticker | Stock Name | Watchlist | Category | Recent Price | Market Intelligence Score | Change % | YTD Change% |
| APT | Alpha Tech |   | Industrials | 4.89 | 70 | 0.73% | -9.19% |
| PDS | Precision Drilling | | Energy | 56.77 | 70 | -2.59% | -10.02% |
| GIB | CGI | | Technology | 96.73 | 50 | 1.51% | -11.24% |
| TAC | Transalta Corp | | Utilities | 12.28 | 60 | 1.32% | -12.00% |
| TECK | Teck Resources | | Materials | 34.31 | 80 | 4.70% | -15.77% |
| BTE | Baytex Energy | | Energy | 2.18 | 50 | -3.54% | -16.41% |
| MIST | Milestone | | Health Care | 1.80 | 40 | 1.12% | -17.05% |
| TLRY | Tilray Brands | | Health Care | 1.19 | 40 | 3.48% | -18.49% |
| BLCO | Bausch + | | Health Care | 15.01 | 53 | -0.28% | -19.71% |
| MEOH | Methanex Corp | | Materials | 38.61 | 100 | 4.10% | -21.29% |
| ACHV | Achieve Life | | Health Care | 2.83 | 50 | 1.43% | -23.31% |
| VET | Vermilion Energy | | Energy | 7.29 | 30 | -2.67% | -23.96% |
| TFII | TFI | | Industrials | 96.46 | 90 | -0.27% | -25.99% |
| DCBO | Docebo | | Technology | 31.18 | 60 | 0.13% | -31.15% |
| GV | Visionary | | Consumer Staples | 1.51 | 20 | 2.03% | -34.35% |
| WPRT | Westport Fuel | | Services & Goods | 2.52 | 0 | -4.55% | -34.38% |
| NOA | Construction | | Energy | 13.37 | 50 | -0.74% | -37.82% |
| BGI | Birks | | Services & Goods | 0.86 | 80 | 3.51% | -46.14% |
| ASTL | Algoma Steel | | Materials | 5.13 | 70 | 3.01% | -46.26% |
| VERO | Venus Concept | | Health Care | 2.28 | 40 | 0.00% | -47.39% |
| GTE | Gran Tierra | | Energy | 3.94 | 30 | -2.72% | -47.68% |
| MERC | Mercer | | Materials | 3.23 | 70 | 1.25% | -47.75% |
| PROF | Profound Medical | | Health Care | 4.12 | 0 | -6.79% | -47.85% |
| CGC | Canopy Growth | | Health Care | 1.46 | 60 | 5.80% | -49.31% |
| LULU | Lululemon Athletica | | Services & Goods | 166.84 | 0 | -0.57% | -55.19% |
| To view more stocks, click on Next / Previous arrows or select different range: 0 - 25 , 25 - 50 , 50 - 75 , 75 - 100 , 100 - 125 , 125 - 150 , 150 - 175 , 175 - 200 , 200 - 225 , 225 - 250 | ||
 | Click To Change The Sort Order: By Market Cap or Company Size Performance: Year-to-date, Week and Day |  |
| Detailed Overview Of Canada Stocks |
| Canada Technical Overview, Leaders & Laggards, Top Canada ETF Funds & Detailed Canada Stocks List, Charts, Trends & More |
| Canada: Technical Analysis, Trends & YTD Performance | |
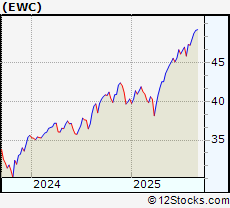
 EWC Weekly Chart |
|
| Long Term Trend: Very Good | |
| Medium Term Trend: Good | |
 EWC Daily Chart |
|
| Short Term Trend: Good | |
| Overall Trend Score: 90 | |
| YTD Performance: 22.6769% | |
| **Trend Scores & Views Are Only For Educational Purposes And Not For Investing | |
| 12Stocks.com: Investing in Canada Index using Exchange Traded Funds | |
|
The following table shows list of key exchange traded funds (ETF) that
help investors play Canada stock market. For detailed view, check out our ETF Funds section of our website. Quick View: Move mouse or cursor over ETF symbol (ticker) to view short-term technical chart and over ETF name to view long term chart. Click on ticker or stock name for detailed view. Click on to add stock symbol to your watchlist and to view watchlist. |
12Stocks.com List of ETFs that track Canada Index
| Ticker | ETF Name | Watchlist | Recent Price | Market Intelligence Score | Change % | Week % | Year-to-date % |
| FCAN | Canada AlphaDEX | | 93.12 | 70 | -0.608389 | 10.3841 | 0% |
| QCAN | Canada StrategicFactors | | 59.03 | 10 | 0 | 0 | 0% |
| 12Stocks.com: Charts, Trends, Fundamental Data and Performances of Canada Stocks | |
|
We now take in-depth look at all Canada stocks including charts, multi-period performances and overall trends (as measured by market intelligence score). One can sort Canada stocks (click link to choose) by Daily, Weekly and by Year-to-Date performances. Also, one can sort by size of the company or by market capitalization. |
| Select Your Default Chart Type: | |||||
| |||||
| Click on stock symbol or name for detailed view. Click on to add stock symbol to your watchlist and to view watchlist. Quick View: Move mouse or cursor over "Daily" to quickly view daily technical stock chart and over "Weekly" to view weekly technical stock chart. | |||||

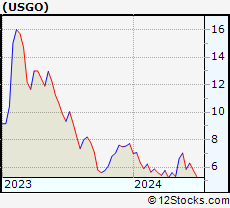 | USGO U.S. GoldMining Inc |
| Sector: Materials | |
| SubSector: Other Industrial Metals & Mining | |
| MarketCap: 114.71 Millions | |
| Recent Price: 9.04 Market Intelligence Score: 43 | |
| Day Percent Change: 2.05% Day Change: 0.16 | |
| Week Change: 0.89% Year-to-date Change: -7.4% | |
| USGO Links: Profile News Message Board | |
| Charts:- Daily , Weekly | |
| Add USGO to Watchlist: View: Get Complete USGO Trend Analysis ➞ | |
 | APT Alpha Pro Tech Ltd |
| Sector: Industrials | |
| SubSector: Building Products & Equipment | |
| MarketCap: 51.17 Millions | |
| Recent Price: 4.89 Market Intelligence Score: 70 | |
| Day Percent Change: 0.734021% Day Change: 0 | |
| Week Change: 0.734021% Year-to-date Change: -9.2% | |
| APT Links: Profile News Message Board | |
| Charts:- Daily , Weekly | |
| Add APT to Watchlist: View: Get Complete APT Trend Analysis ➞ | |
 | PDS Precision Drilling Corp |
| Sector: Energy | |
| SubSector: Oil & Gas Drilling | |
| MarketCap: 774.34 Millions | |
| Recent Price: 56.77 Market Intelligence Score: 70 | |
| Day Percent Change: -2.59094% Day Change: 0.97 | |
| Week Change: -0.473352% Year-to-date Change: -10.0% | |
| PDS Links: Profile News Message Board | |
| Charts:- Daily , Weekly | |
| Add PDS to Watchlist: View: Get Complete PDS Trend Analysis ➞ | |
 | GIB CGI Inc |
| Sector: Technology | |
| SubSector: Information Technology Services | |
| MarketCap: 21345.4 Millions | |
| Recent Price: 96.73 Market Intelligence Score: 50 | |
| Day Percent Change: 1.51118% Day Change: 0.06 | |
| Week Change: 0.259121% Year-to-date Change: -11.2% | |
| GIB Links: Profile News Message Board | |
| Charts:- Daily , Weekly | |
| Add GIB to Watchlist: View: Get Complete GIB Trend Analysis ➞ | |
 | TAC Transalta Corp |
| Sector: Utilities | |
| SubSector: Utilities - Independent Power Producers | |
| MarketCap: 3639.79 Millions | |
| Recent Price: 12.28 Market Intelligence Score: 60 | |
| Day Percent Change: 1.32013% Day Change: 0 | |
| Week Change: 1.73985% Year-to-date Change: -12.0% | |
| TAC Links: Profile News Message Board | |
| Charts:- Daily , Weekly | |
| Add TAC to Watchlist: View: Get Complete TAC Trend Analysis ➞ | |
 | TECK Teck Resources Ltd |
| Sector: Materials | |
| SubSector: Other Industrial Metals & Mining | |
| MarketCap: 16774.2 Millions | |
| Recent Price: 34.31 Market Intelligence Score: 80 | |
| Day Percent Change: 4.69942% Day Change: 0.49 | |
| Week Change: 4.19071% Year-to-date Change: -15.8% | |
| TECK Links: Profile News Message Board | |
| Charts:- Daily , Weekly | |
| Add TECK to Watchlist: View: Get Complete TECK Trend Analysis ➞ | |
 | BTE Baytex Energy Corp |
| Sector: Energy | |
| SubSector: Oil & Gas E&P | |
| MarketCap: 1674.89 Millions | |
| Recent Price: 2.18 Market Intelligence Score: 50 | |
| Day Percent Change: -3.53982% Day Change: 0.04 | |
| Week Change: 0% Year-to-date Change: -16.4% | |
| BTE Links: Profile News Message Board | |
| Charts:- Daily , Weekly | |
| Add BTE to Watchlist: View: Get Complete BTE Trend Analysis ➞ | |
 | MIST Milestone Pharmaceuticals Inc |
| Sector: Health Care | |
| SubSector: Biotechnology | |
| MarketCap: 152.99 Millions | |
| Recent Price: 1.80 Market Intelligence Score: 40 | |
| Day Percent Change: 1.1236% Day Change: 0.07 | |
| Week Change: 1.69492% Year-to-date Change: -17.1% | |
| MIST Links: Profile News Message Board | |
| Charts:- Daily , Weekly | |
| Add MIST to Watchlist: View: Get Complete MIST Trend Analysis ➞ | |
 | TLRY Tilray Brands Inc |
| Sector: Health Care | |
| SubSector: Drug Manufacturers - Specialty & Generic | |
| MarketCap: 1309.63 Millions | |
| Recent Price: 1.19 Market Intelligence Score: 40 | |
| Day Percent Change: 3.47826% Day Change: 0.05 | |
| Week Change: -13.1387% Year-to-date Change: -18.5% | |
| TLRY Links: Profile News Message Board | |
| Charts:- Daily , Weekly | |
| Add TLRY to Watchlist: View: Get Complete TLRY Trend Analysis ➞ | |
 | BLCO Bausch + Lomb Corp |
| Sector: Health Care | |
| SubSector: Medical Instruments & Supplies | |
| MarketCap: 5311.53 Millions | |
| Recent Price: 15.01 Market Intelligence Score: 53 | |
| Day Percent Change: -0.28% Day Change: -0.04 | |
| Week Change: 2.98% Year-to-date Change: -19.7% | |
| BLCO Links: Profile News Message Board | |
| Charts:- Daily , Weekly | |
| Add BLCO to Watchlist: View: Get Complete BLCO Trend Analysis ➞ | |
 | MEOH Methanex Corp |
| Sector: Materials | |
| SubSector: Chemicals | |
| MarketCap: 2986.1 Millions | |
| Recent Price: 38.61 Market Intelligence Score: 100 | |
| Day Percent Change: 4.09814% Day Change: 0.13 | |
| Week Change: 8.79121% Year-to-date Change: -21.3% | |
| MEOH Links: Profile News Message Board | |
| Charts:- Daily , Weekly | |
| Add MEOH to Watchlist: View: Get Complete MEOH Trend Analysis ➞ | |
 | ACHV Achieve Life Sciences Inc |
| Sector: Health Care | |
| SubSector: Biotechnology | |
| MarketCap: 144.63 Millions | |
| Recent Price: 2.83 Market Intelligence Score: 50 | |
| Day Percent Change: 1.43369% Day Change: 0.31 | |
| Week Change: -5.03356% Year-to-date Change: -23.3% | |
| ACHV Links: Profile News Message Board | |
| Charts:- Daily , Weekly | |
| Add ACHV to Watchlist: View: Get Complete ACHV Trend Analysis ➞ | |
 | VET Vermilion Energy Inc |
| Sector: Energy | |
| SubSector: Oil & Gas E&P | |
| MarketCap: 1121.2 Millions | |
| Recent Price: 7.29 Market Intelligence Score: 30 | |
| Day Percent Change: -2.67023% Day Change: 0.14 | |
| Week Change: -5.07812% Year-to-date Change: -24.0% | |
| VET Links: Profile News Message Board | |
| Charts:- Daily , Weekly | |
| Add VET to Watchlist: View: Get Complete VET Trend Analysis ➞ | |
 | TFII TFI International Inc |
| Sector: Industrials | |
| SubSector: Trucking | |
| MarketCap: 8008.11 Millions | |
| Recent Price: 96.46 Market Intelligence Score: 90 | |
| Day Percent Change: -0.268817% Day Change: 0.79 | |
| Week Change: 2.51886% Year-to-date Change: -26.0% | |
| TFII Links: Profile News Message Board | |
| Charts:- Daily , Weekly | |
| Add TFII to Watchlist: View: Get Complete TFII Trend Analysis ➞ | |
 | DCBO Docebo Inc |
| Sector: Technology | |
| SubSector: Software - Application | |
| MarketCap: 923.86 Millions | |
| Recent Price: 31.18 Market Intelligence Score: 60 | |
| Day Percent Change: 0.128452% Day Change: 0.92 | |
| Week Change: 0.678076% Year-to-date Change: -31.2% | |
| DCBO Links: Profile News Message Board | |
| Charts:- Daily , Weekly | |
| Add DCBO to Watchlist: View: Get Complete DCBO Trend Analysis ➞ | |
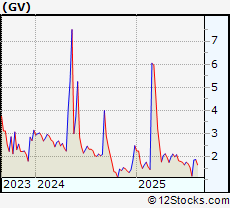 | GV Visionary Holdings Inc |
| Sector: Consumer Staples | |
| SubSector: Education & Training Services | |
| MarketCap: 6.62 Millions | |
| Recent Price: 1.51 Market Intelligence Score: 20 | |
| Day Percent Change: 2.02703% Day Change: -0.01 | |
| Week Change: -6.21118% Year-to-date Change: -34.3% | |
| GV Links: Profile News Message Board | |
| Charts:- Daily , Weekly | |
| Add GV to Watchlist: View: Get Complete GV Trend Analysis ➞ | |
 | WPRT Westport Fuel Systems Inc |
| Sector: Services & Goods | |
| SubSector: Auto Parts | |
| MarketCap: 43.72 Millions | |
| Recent Price: 2.52 Market Intelligence Score: 0 | |
| Day Percent Change: -4.54545% Day Change: -0.02 | |
| Week Change: -12.1951% Year-to-date Change: -34.4% | |
| WPRT Links: Profile News Message Board | |
| Charts:- Daily , Weekly | |
| Add WPRT to Watchlist: View: Get Complete WPRT Trend Analysis ➞ | |
 | NOA North American Construction Group Ltd |
| Sector: Energy | |
| SubSector: Oil & Gas Equipment & Services | |
| MarketCap: 393.48 Millions | |
| Recent Price: 13.37 Market Intelligence Score: 50 | |
| Day Percent Change: -0.742391% Day Change: 0.33 | |
| Week Change: -0.520833% Year-to-date Change: -37.8% | |
| NOA Links: Profile News Message Board | |
| Charts:- Daily , Weekly | |
| Add NOA to Watchlist: View: Get Complete NOA Trend Analysis ➞ | |
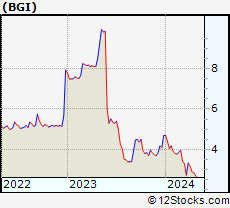 | BGI Birks Group Inc |
| Sector: Services & Goods | |
| SubSector: Luxury Goods | |
| MarketCap: 16.83 Millions | |
| Recent Price: 0.86 Market Intelligence Score: 80 | |
| Day Percent Change: 3.50645% Day Change: -0.03 | |
| Week Change: 18.8927% Year-to-date Change: -46.1% | |
| BGI Links: Profile News Message Board | |
| Charts:- Daily , Weekly | |
| Add BGI to Watchlist: View: Get Complete BGI Trend Analysis ➞ | |
 | ASTL Algoma Steel Group Inc |
| Sector: Materials | |
| SubSector: Steel | |
| MarketCap: 538.29 Millions | |
| Recent Price: 5.13 Market Intelligence Score: 70 | |
| Day Percent Change: 3.01205% Day Change: 0.22 | |
| Week Change: 4.0568% Year-to-date Change: -46.3% | |
| ASTL Links: Profile News Message Board | |
| Charts:- Daily , Weekly | |
| Add ASTL to Watchlist: View: Get Complete ASTL Trend Analysis ➞ | |
 | VERO Venus Concept Inc |
| Sector: Health Care | |
| SubSector: Medical Devices | |
| MarketCap: 4.24 Millions | |
| Recent Price: 2.28 Market Intelligence Score: 40 | |
| Day Percent Change: 0% Day Change: 0.07 | |
| Week Change: 0% Year-to-date Change: -47.4% | |
| VERO Links: Profile News Message Board | |
| Charts:- Daily , Weekly | |
| Add VERO to Watchlist: View: Get Complete VERO Trend Analysis ➞ | |
 | GTE Gran Tierra Energy Inc |
| Sector: Energy | |
| SubSector: Oil & Gas E&P | |
| MarketCap: 139.05 Millions | |
| Recent Price: 3.94 Market Intelligence Score: 30 | |
| Day Percent Change: -2.71605% Day Change: 0.02 | |
| Week Change: -5.28846% Year-to-date Change: -47.7% | |
| GTE Links: Profile News Message Board | |
| Charts:- Daily , Weekly | |
| Add GTE to Watchlist: View: Get Complete GTE Trend Analysis ➞ | |
 | MERC Mercer International Inc |
| Sector: Materials | |
| SubSector: Paper & Paper Products | |
| MarketCap: 216.35 Millions | |
| Recent Price: 3.23 Market Intelligence Score: 70 | |
| Day Percent Change: 1.25392% Day Change: 0.06 | |
| Week Change: -0.615385% Year-to-date Change: -47.8% | |
| MERC Links: Profile News Message Board | |
| Charts:- Daily , Weekly | |
| Add MERC to Watchlist: View: Get Complete MERC Trend Analysis ➞ | |
 | PROF Profound Medical Corp |
| Sector: Health Care | |
| SubSector: Medical Devices | |
| MarketCap: 123.81 Millions | |
| Recent Price: 4.12 Market Intelligence Score: 0 | |
| Day Percent Change: -6.78733% Day Change: -0.04 | |
| Week Change: -8.84956% Year-to-date Change: -47.8% | |
| PROF Links: Profile News Message Board | |
| Charts:- Daily , Weekly | |
| Add PROF to Watchlist: View: Get Complete PROF Trend Analysis ➞ | |
 | CGC Canopy Growth Corporation |
| Sector: Health Care | |
| SubSector: Drug Manufacturers - Specialty & Generic | |
| MarketCap: 344.65 Millions | |
| Recent Price: 1.46 Market Intelligence Score: 60 | |
| Day Percent Change: 5.7971% Day Change: 0.03 | |
| Week Change: -3.31126% Year-to-date Change: -49.3% | |
| CGC Links: Profile News Message Board | |
| Charts:- Daily , Weekly | |
| Add CGC to Watchlist: View: Get Complete CGC Trend Analysis ➞ | |
| To view more stocks, click on Next / Previous arrows or select different range: 0 - 25 , 25 - 50 , 50 - 75 , 75 - 100 , 100 - 125 , 125 - 150 , 150 - 175 , 175 - 200 , 200 - 225 , 225 - 250 | ||
| Click To Change The Sort Order: By Market Cap or Company Size Performance: Year-to-date, Week and Day | |
| Select Chart Type: | ||
 Best Stocks Today 12Stocks.com |
© 2025 12Stocks.com Terms & Conditions Privacy Contact Us
All Information Provided Only For Education And Not To Be Used For Investing or Trading. See Terms & Conditions


One More Thing ... Get Best Stocks Delivered Daily!
Never Ever Miss A Move With Our Top Ten Stocks Lists
Find Best Stocks In Any Market - Bull or Bear Market
Take A Peek At Our Top Ten Stocks Lists: Daily, Weekly, Year-to-Date & Top Trends
Find Best Stocks In Any Market - Bull or Bear Market
Take A Peek At Our Top Ten Stocks Lists: Daily, Weekly, Year-to-Date & Top Trends
Canada Stocks With Best Up Trends [0-bearish to 100-bullish]: Celestica [100], Equinox Gold[100], Gold Royalty[100], EMX Royalty[100], Iamgold Corp[100], Trilogy Metals[100], Barrick Mining[100], Methanex Corp[100], Eldorado Gold[100], Turquo Hill[100], Denison Mines[100]
Best Canada Stocks Year-to-Date:
Americas Gold[605.128%], Avino Silver[339.322%], Gold Royalty[209.677%], Tower Hill[199.363%], Celestica [160.75%], New Gold[140.458%], EMX Royalty[133.908%], Kinross Gold[124.846%], Sandstorm Gold[102.209%], Agnico Eagle[86.6197%], OR Royalties[85.4636%] Best Canada Stocks This Week:
Crescent Point[4066.17%], Golden Star[1837.95%], Alexco Resource[690.301%], Yamana Gold[625.812%], Novelion [579.167%], Turquo Hill[433.11%], Enerplus [415.601%], Nevsun Resources[402.516%], Bellatrix Exploration[291.621%], Domtar [250.297%], Trillium [203.688%] Best Canada Stocks Daily:
Canadian Solar[15.036%], Celestica [9.64128%], Equinox Gold[9.0301%], Ballard Power[7.56757%], Novelion [7.37813%], Gold Royalty[6.66667%], EMX Royalty[6.5445%], Canopy Growth[5.7971%], Iamgold Corp[4.75687%], Teck Resources[4.69942%], Trilogy Metals[4.54545%]