
 Login Sign Up


| |||||
 |  | ||||

| 12Stocks.com Market Intelligence |
Best Canada Stocks
|
|
| Quick Read: Top Canada Stocks By Performances & Trends: Daily, Weekly, Year-to-Date, Market Cap (Size) & Technical Trends | |||
| Best Canada Views: Quick Browse View, Summary & Slide Show | |||
| 12Stocks.com Canada Stocks Performances & Trends Daily | |||||||||
|
|  The overall market intelligence score is 90 (0-bearish to 100-bullish) which puts Canada index in short term bullish trend. The market intelligence score from previous trading session is 90 and an improvement of trend continues.
| ||||||||
Here are the market intelligence trend scores of the most requested Canada stocks at 12Stocks.com (click stock name for detailed review):
| ||||||||||||||||||||||||
| Scroll down this page for most comprehensive review of Canada stocks by performance, trends, technical analysis, charts, fund plays & more | ||||||||||||||||||||||||

| 12Stocks.com: Top Performing Canada Index Stocks | ||||||||||||||||||||||||||||||||||||||||||||||||
 The top performing Canada Index stocks year to date are
Now, more recently, over last week, the top performing Canada Index stocks on the move are


|
||||||||||||||||||||||||||||||||||||||||||||||||
| 12Stocks.com: Investing in Canada Index with Stocks | |
|
The following table helps investors and traders sort through current performance and trends (as measured by market intelligence score) of various
stocks in the Canada Index. Quick View: Move mouse or cursor over stock symbol (ticker) to view short-term technical chart and over stock name to view long term chart. Click on  to add stock symbol to your watchlist and to add stock symbol to your watchlist and  to view watchlist. Click on any ticker or stock name for detailed market intelligence report for that stock. to view watchlist. Click on any ticker or stock name for detailed market intelligence report for that stock. |
12Stocks.com Performance of Stocks in Canada Index
| Ticker | Stock Name | Watchlist | Category | Recent Price | Market Intelligence Score | Change % | YTD Change% |
| CRME | Cardiome Pharma |   | Health Care | 62.56 | 80 | 1.87% | 0.00% |
| CXRX | Concordia | | Health Care | 42.14 | 70 | 4.33% | 0.00% |
| PCOM | Points | | Technology | 42.14 | 70 | 4.33% | 0.00% |
| AAU | Almaden Minerals | | Materials | 89.11 | 80 | 0.77% | 0.00% |
| EGI | Entree Gold | | Materials | 43.29 | 80 | 0.00% | 0.00% |
| HYGS | Hydrogenics | | Industrials | 1.57 | 20 | 1.29% | 0.00% |
| NEPT | Neptune Wellness | | Health Care | 59.64 | 80 | 0.07% | 0.00% |
| SRRA | Sierra Oncology | | Health Care | 14.95 | 30 | 3.68% | 0.00% |
| IPCI | IntelliPharmaCeutics | | Health Care | 121.30 | 30 | -1.90% | 0.00% |
| TRIL | Trillium | | Health Care | 56.00 | 80 | 2.88% | 0.00% |
| AEZS | Aeterna Zentaris | | Health Care | 6.14 | 50 | 7.34% | 0.00% |
| KIQ | Kelso | | Transports | 0.41 | 60 | -4.65% | 0.00% |
| BAA | Banro | | Materials | 0.85 | 10 | -1.16% | 0.00% |
| SMTX | SMTC | | Technology | 2.06 | 0 | -2.37% | 0.00% |
| CPAH | CounterPath | | Technology | 0.90 | 10 | -3.23% | 0.00% |
| LBIX | Leading Brands | | Consumer Staples | 1.15 | 0 | 0.00% | 0.00% |
| ACST | Acasti Pharma | | Health Care | 3.37 | 60 | -0.88% | 0.00% |
| CRHM | CRH Medical | | Health Care | 18.50 | 80 | -6.04% | 0.00% |
| LMLP | UBS ETRACS | | Utilities | 44.13 | 80 | -0.61% | 0.00% |
| KL | Kirkland Lake | | Materials | 38.92 | 30 | -0.23% | 0.00% |
| TSG | Stars | | Services & Goods | 44.13 | 40 | 0.64% | 0.00% |
| ATCO | Atlas | | Financials | 15.48 | 20 | 0.00% | 0.00% |
| OSB | Norbord | | Services & Goods | 37.02 | 0 | -3.67% | 0.00% |
| APHA | Aphria | | Health Care | 17.23 | 10 | -3.39% | 0.00% |
| BLU | BELL Health | | Health Care | 14.74 | 30 | 0.00% | 0.00% |
| To view more stocks, click on Next / Previous arrows or select different range: 0 - 25 , 25 - 50 , 50 - 75 , 75 - 100 , 100 - 125 , 125 - 150 , 150 - 175 , 175 - 200 , 200 - 225 , 225 - 250 | ||
 | Click To Change The Sort Order: By Market Cap or Company Size Performance: Year-to-date, Week and Day |  |
| Detailed Overview Of Canada Stocks |
| Canada Technical Overview, Leaders & Laggards, Top Canada ETF Funds & Detailed Canada Stocks List, Charts, Trends & More |
| Canada: Technical Analysis, Trends & YTD Performance | |
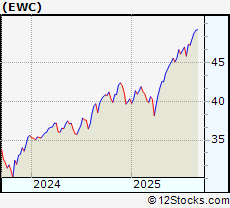
 EWC Weekly Chart |
|
| Long Term Trend: Very Good | |
| Medium Term Trend: Good | |
 EWC Daily Chart |
|
| Short Term Trend: Good | |
| Overall Trend Score: 90 | |
| YTD Performance: 22.6769% | |
| **Trend Scores & Views Are Only For Educational Purposes And Not For Investing | |
| 12Stocks.com: Investing in Canada Index using Exchange Traded Funds | |
|
The following table shows list of key exchange traded funds (ETF) that
help investors play Canada stock market. For detailed view, check out our ETF Funds section of our website. Quick View: Move mouse or cursor over ETF symbol (ticker) to view short-term technical chart and over ETF name to view long term chart. Click on ticker or stock name for detailed view. Click on to add stock symbol to your watchlist and to view watchlist. |
12Stocks.com List of ETFs that track Canada Index
| Ticker | ETF Name | Watchlist | Recent Price | Market Intelligence Score | Change % | Week % | Year-to-date % |
| FCAN | Canada AlphaDEX | | 93.12 | 70 | -0.608389 | 10.3841 | 0% |
| QCAN | Canada StrategicFactors | | 59.03 | 10 | 0 | 0 | 0% |
| 12Stocks.com: Charts, Trends, Fundamental Data and Performances of Canada Stocks | |
|
We now take in-depth look at all Canada stocks including charts, multi-period performances and overall trends (as measured by market intelligence score). One can sort Canada stocks (click link to choose) by Daily, Weekly and by Year-to-Date performances. Also, one can sort by size of the company or by market capitalization. |
| Select Your Default Chart Type: | |||||
| |||||
| Click on stock symbol or name for detailed view. Click on to add stock symbol to your watchlist and to view watchlist. Quick View: Move mouse or cursor over "Daily" to quickly view daily technical stock chart and over "Weekly" to view weekly technical stock chart. | |||||

 | XRA Exeter Resource Corporation |
| Sector: Materials | |
| SubSector: Gold | |
| MarketCap: 105.97 Millions | |
| Recent Price: 1.56 Market Intelligence Score: 20 | |
| Day Percent Change: -0.636943% Day Change: -9999 | |
| Week Change: -53.012% Year-to-date Change: 0.0% | |
| XRA Links: Profile News Message Board | |
| Charts:- Daily , Weekly | |
| Add XRA to Watchlist: View: Get Complete XRA Trend Analysis ➞ | |
 | CRME Cardiome Pharma Corp. |
| Sector: Health Care | |
| SubSector: Drug Manufacturers - Other | |
| MarketCap: 101.35 Millions | |
| Recent Price: 62.56 Market Intelligence Score: 80 | |
| Day Percent Change: 1.87266% Day Change: -9999 | |
| Week Change: 4.15383% Year-to-date Change: 0.0% | |
| CRME Links: Profile News Message Board | |
| Charts:- Daily , Weekly | |
| Add CRME to Watchlist: View: Get Complete CRME Trend Analysis ➞ | |
 | CXRX Concordia International Corp. |
| Sector: Health Care | |
| SubSector: Biotechnology | |
| MarketCap: 101.01 Millions | |
| Recent Price: 42.14 Market Intelligence Score: 70 | |
| Day Percent Change: 4.33276% Day Change: -9999 | |
| Week Change: 283.789% Year-to-date Change: 0.0% | |
| CXRX Links: Profile News Message Board | |
| Charts:- Daily , Weekly | |
| Add CXRX to Watchlist: View: Get Complete CXRX Trend Analysis ➞ | |
 | PCOM Points International Ltd. |
| Sector: Technology | |
| SubSector: Internet Information Providers | |
| MarketCap: 111.98 Millions | |
| Recent Price: 42.14 Market Intelligence Score: 70 | |
| Day Percent Change: 4.33276% Day Change: -9999 | |
| Week Change: 68.6274% Year-to-date Change: 0.0% | |
| PCOM Links: Profile News Message Board | |
| Charts:- Daily , Weekly | |
| Add PCOM to Watchlist: View: Get Complete PCOM Trend Analysis ➞ | |
 | AAU Almaden Minerals Ltd. |
| Sector: Materials | |
| SubSector: Gold | |
| MarketCap: 29.2619 Millions | |
| Recent Price: 89.11 Market Intelligence Score: 80 | |
| Day Percent Change: 0.76897% Day Change: -9999 | |
| Week Change: 61270.5% Year-to-date Change: 0.0% | |
| AAU Links: Profile News Message Board | |
| Charts:- Daily , Weekly | |
| Add AAU to Watchlist: View: Get Complete AAU Trend Analysis ➞ | |
 | EGI Entree Gold Inc. |
| Sector: Materials | |
| SubSector: Gold | |
| MarketCap: 84.5 Millions | |
| Recent Price: 43.29 Market Intelligence Score: 80 | |
| Day Percent Change: 0% Day Change: -9999 | |
| Week Change: 113.356% Year-to-date Change: 0.0% | |
| EGI Links: Profile News Message Board | |
| Charts:- Daily , Weekly | |
| Add EGI to Watchlist: View: Get Complete EGI Trend Analysis ➞ | |
 | HYGS Hydrogenics Corporation |
| Sector: Industrials | |
| SubSector: Industrial Electrical Equipment | |
| MarketCap: 81.15 Millions | |
| Recent Price: 1.57 Market Intelligence Score: 20 | |
| Day Percent Change: 1.29032% Day Change: -9999 | |
| Week Change: -64.5598% Year-to-date Change: 0.0% | |
| HYGS Links: Profile News Message Board | |
| Charts:- Daily , Weekly | |
| Add HYGS to Watchlist: View: Get Complete HYGS Trend Analysis ➞ | |
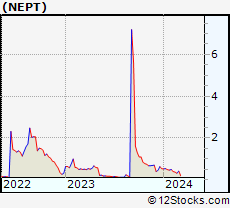 | NEPT Neptune Wellness Solutions Inc. |
| Sector: Health Care | |
| SubSector: Biotechnology | |
| MarketCap: 113.785 Millions | |
| Recent Price: 59.64 Market Intelligence Score: 80 | |
| Day Percent Change: 0.0671141% Day Change: -9999 | |
| Week Change: 14100% Year-to-date Change: 0.0% | |
| NEPT Links: Profile News Message Board | |
| Charts:- Daily , Weekly | |
| Add NEPT to Watchlist: View: Get Complete NEPT Trend Analysis ➞ | |
 | SRRA Sierra Oncology, Inc. |
| Sector: Health Care | |
| SubSector: Biotechnology | |
| MarketCap: 125.185 Millions | |
| Recent Price: 14.95 Market Intelligence Score: 30 | |
| Day Percent Change: 3.67545% Day Change: -9999 | |
| Week Change: -72.8132% Year-to-date Change: 0.0% | |
| SRRA Links: Profile News Message Board | |
| Charts:- Daily , Weekly | |
| Add SRRA to Watchlist: View: Get Complete SRRA Trend Analysis ➞ | |
 | IPCI IntelliPharmaCeutics International Inc. |
| Sector: Health Care | |
| SubSector: Drug Delivery | |
| MarketCap: 72.59 Millions | |
| Recent Price: 121.30 Market Intelligence Score: 30 | |
| Day Percent Change: -1.90053% Day Change: -9999 | |
| Week Change: -13.0092% Year-to-date Change: 0.0% | |
| IPCI Links: Profile News Message Board | |
| Charts:- Daily , Weekly | |
| Add IPCI to Watchlist: View: Get Complete IPCI Trend Analysis ➞ | |
 | TRIL Trillium Therapeutics Inc. |
| Sector: Health Care | |
| SubSector: Biotechnology | |
| MarketCap: 250.885 Millions | |
| Recent Price: 56.00 Market Intelligence Score: 80 | |
| Day Percent Change: 2.88444% Day Change: -9999 | |
| Week Change: 203.688% Year-to-date Change: 0.0% | |
| TRIL Links: Profile News Message Board | |
| Charts:- Daily , Weekly | |
| Add TRIL to Watchlist: View: Get Complete TRIL Trend Analysis ➞ | |
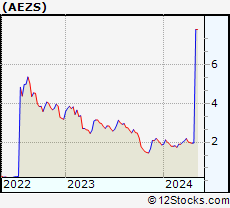 | AEZS Aeterna Zentaris Inc. |
| Sector: Health Care | |
| SubSector: Biotechnology | |
| MarketCap: 13.6785 Millions | |
| Recent Price: 6.14 Market Intelligence Score: 50 | |
| Day Percent Change: 7.34266% Day Change: -9999 | |
| Week Change: 2.76151% Year-to-date Change: 0.0% | |
| AEZS Links: Profile News Message Board | |
| Charts:- Daily , Weekly | |
| Add AEZS to Watchlist: View: Get Complete AEZS Trend Analysis ➞ | |
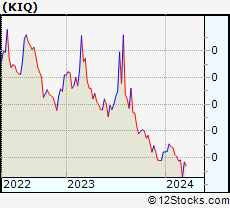 | KIQ Kelso Technologies Inc. |
| Sector: Transports | |
| SubSector: Railroads | |
| MarketCap: 24.5722 Millions | |
| Recent Price: 0.41 Market Intelligence Score: 60 | |
| Day Percent Change: -4.65116% Day Change: -9999 | |
| Week Change: 203.929% Year-to-date Change: 0.0% | |
| KIQ Links: Profile News Message Board | |
| Charts:- Daily , Weekly | |
| Add KIQ to Watchlist: View: Get Complete KIQ Trend Analysis ➞ | |
 | BAA Banro Corporation |
| Sector: Materials | |
| SubSector: Gold | |
| MarketCap: 36.42 Millions | |
| Recent Price: 0.85 Market Intelligence Score: 10 | |
| Day Percent Change: -1.16279% Day Change: -9999 | |
| Week Change: -95.819% Year-to-date Change: 0.0% | |
| BAA Links: Profile News Message Board | |
| Charts:- Daily , Weekly | |
| Add BAA to Watchlist: View: Get Complete BAA Trend Analysis ➞ | |
 | SMTX SMTC Corporation |
| Sector: Technology | |
| SubSector: Printed Circuit Boards | |
| MarketCap: 57.1235 Millions | |
| Recent Price: 2.06 Market Intelligence Score: 0 | |
| Day Percent Change: -2.36967% Day Change: -9999 | |
| Week Change: -65.894% Year-to-date Change: 0.0% | |
| SMTX Links: Profile News Message Board | |
| Charts:- Daily , Weekly | |
| Add SMTX to Watchlist: View: Get Complete SMTX Trend Analysis ➞ | |
 | CPAH CounterPath Corporation |
| Sector: Technology | |
| SubSector: Application Software | |
| MarketCap: 12.7662 Millions | |
| Recent Price: 0.90 Market Intelligence Score: 10 | |
| Day Percent Change: -3.22581% Day Change: -9999 | |
| Week Change: -74.1379% Year-to-date Change: 0.0% | |
| CPAH Links: Profile News Message Board | |
| Charts:- Daily , Weekly | |
| Add CPAH to Watchlist: View: Get Complete CPAH Trend Analysis ➞ | |
 | LBIX Leading Brands, Inc. |
| Sector: Consumer Staples | |
| SubSector: Beverages - Soft Drinks | |
| MarketCap: 4.86 Millions | |
| Recent Price: 1.15 Market Intelligence Score: 0 | |
| Day Percent Change: 0% Day Change: -9999 | |
| Week Change: 0% Year-to-date Change: 0.0% | |
| LBIX Links: Profile News Message Board | |
| Charts:- Daily , Weekly | |
| Add LBIX to Watchlist: View: Get Complete LBIX Trend Analysis ➞ | |
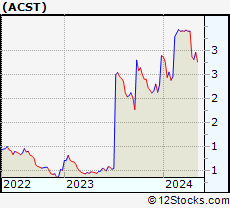 | ACST Acasti Pharma Inc. |
| Sector: Health Care | |
| SubSector: Biotechnology | |
| MarketCap: 28.2785 Millions | |
| Recent Price: 3.37 Market Intelligence Score: 60 | |
| Day Percent Change: -0.882353% Day Change: -9999 | |
| Week Change: 2.69381% Year-to-date Change: 0.0% | |
| ACST Links: Profile News Message Board | |
| Charts:- Daily , Weekly | |
| Add ACST to Watchlist: View: Get Complete ACST Trend Analysis ➞ | |
 | CRHM CRH Medical Corporation |
| Sector: Health Care | |
| SubSector: Medical Instruments & Supplies | |
| MarketCap: 80.286 Millions | |
| Recent Price: 18.50 Market Intelligence Score: 80 | |
| Day Percent Change: -6.04368% Day Change: -9999 | |
| Week Change: 363.659% Year-to-date Change: 0.0% | |
| CRHM Links: Profile News Message Board | |
| Charts:- Daily , Weekly | |
| Add CRHM to Watchlist: View: Get Complete CRHM Trend Analysis ➞ | |
 | LMLP UBS ETRACS M Py 2xLvg WF MLP Ex-Engy ETN |
| Sector: Utilities | |
| SubSector: Exchange Traded Fund | |
| MarketCap: 0 Millions | |
| Recent Price: 44.13 Market Intelligence Score: 80 | |
| Day Percent Change: -0.608108% Day Change: -9999 | |
| Week Change: 117.068% Year-to-date Change: 0.0% | |
| LMLP Links: Profile News Message Board | |
| Charts:- Daily , Weekly | |
| Add LMLP to Watchlist: View: Get Complete LMLP Trend Analysis ➞ | |
 | KL Kirkland Lake Gold Ltd. |
| Sector: Materials | |
| SubSector: Gold | |
| MarketCap: 7317.39 Millions | |
| Recent Price: 38.92 Market Intelligence Score: 30 | |
| Day Percent Change: -0.23071% Day Change: -9999 | |
| Week Change: 3.31829% Year-to-date Change: 0.0% | |
| KL Links: Profile News Message Board | |
| Charts:- Daily , Weekly | |
| Add KL to Watchlist: View: Get Complete KL Trend Analysis ➞ | |
 | TSG The Stars Group Inc. |
| Sector: Services & Goods | |
| SubSector: Gaming Activities | |
| MarketCap: 4559.49 Millions | |
| Recent Price: 44.13 Market Intelligence Score: 40 | |
| Day Percent Change: 0.638541% Day Change: -9999 | |
| Week Change: -6.12636% Year-to-date Change: 0.0% | |
| TSG Links: Profile News Message Board | |
| Charts:- Daily , Weekly | |
| Add TSG to Watchlist: View: Get Complete TSG Trend Analysis ➞ | |
 | ATCO Atlas Corp. |
| Sector: Financials | |
| SubSector: Asset Management | |
| MarketCap: 1668.33 Millions | |
| Recent Price: 15.48 Market Intelligence Score: 20 | |
| Day Percent Change: 0% Day Change: -9999 | |
| Week Change: 0% Year-to-date Change: 0.0% | |
| ATCO Links: Profile News Message Board | |
| Charts:- Daily , Weekly | |
| Add ATCO to Watchlist: View: Get Complete ATCO Trend Analysis ➞ | |
 | OSB Norbord Inc. |
| Sector: Services & Goods | |
| SubSector: Building Materials Wholesale | |
| MarketCap: 847.243 Millions | |
| Recent Price: 37.02 Market Intelligence Score: 0 | |
| Day Percent Change: -3.66901% Day Change: -9999 | |
| Week Change: -92.3035% Year-to-date Change: 0.0% | |
| OSB Links: Profile News Message Board | |
| Charts:- Daily , Weekly | |
| Add OSB to Watchlist: View: Get Complete OSB Trend Analysis ➞ | |
 | APHA Aphria Inc. |
| Sector: Health Care | |
| SubSector: Drug Manufacturers - Other | |
| MarketCap: 670.533 Millions | |
| Recent Price: 17.23 Market Intelligence Score: 10 | |
| Day Percent Change: -3.39221% Day Change: -9999 | |
| Week Change: -5.64074% Year-to-date Change: 0.0% | |
| APHA Links: Profile News Message Board | |
| Charts:- Daily , Weekly | |
| Add APHA to Watchlist: View: Get Complete APHA Trend Analysis ➞ | |
| To view more stocks, click on Next / Previous arrows or select different range: 0 - 25 , 25 - 50 , 50 - 75 , 75 - 100 , 100 - 125 , 125 - 150 , 150 - 175 , 175 - 200 , 200 - 225 , 225 - 250 | ||
| Click To Change The Sort Order: By Market Cap or Company Size Performance: Year-to-date, Week and Day | |
| Select Chart Type: | ||
 Best Stocks Today 12Stocks.com |
© 2025 12Stocks.com Terms & Conditions Privacy Contact Us
All Information Provided Only For Education And Not To Be Used For Investing or Trading. See Terms & Conditions


One More Thing ... Get Best Stocks Delivered Daily!
Never Ever Miss A Move With Our Top Ten Stocks Lists
Find Best Stocks In Any Market - Bull or Bear Market
Take A Peek At Our Top Ten Stocks Lists: Daily, Weekly, Year-to-Date & Top Trends
Find Best Stocks In Any Market - Bull or Bear Market
Take A Peek At Our Top Ten Stocks Lists: Daily, Weekly, Year-to-Date & Top Trends
Canada Stocks With Best Up Trends [0-bearish to 100-bullish]: Celestica [100], Equinox Gold[100], Gold Royalty[100], EMX Royalty[100], Iamgold Corp[100], Trilogy Metals[100], Barrick Mining[100], Methanex Corp[100], Eldorado Gold[100], Turquo Hill[100], Denison Mines[100]
Best Canada Stocks Year-to-Date:
Americas Gold[605.128%], Avino Silver[339.322%], Gold Royalty[209.677%], Tower Hill[199.363%], Celestica [160.75%], New Gold[140.458%], EMX Royalty[133.908%], Kinross Gold[124.846%], Sandstorm Gold[102.209%], Agnico Eagle[86.6197%], OR Royalties[85.4636%] Best Canada Stocks This Week:
Crescent Point[4066.17%], Golden Star[1837.95%], Alexco Resource[690.301%], Yamana Gold[625.812%], Novelion [579.167%], Turquo Hill[433.11%], Enerplus [415.601%], Nevsun Resources[402.516%], Bellatrix Exploration[291.621%], Domtar [250.297%], Trillium [203.688%] Best Canada Stocks Daily:
Canadian Solar[15.036%], Celestica [9.64128%], Equinox Gold[9.0301%], Ballard Power[7.56757%], Novelion [7.37813%], Gold Royalty[6.66667%], EMX Royalty[6.5445%], Canopy Growth[5.7971%], Iamgold Corp[4.75687%], Teck Resources[4.69942%], Trilogy Metals[4.54545%]