
 Login Sign Up


| |||||
 |  | ||||

| 12Stocks.com Market Intelligence |
Best Biotech Stocks
|
|
| Quick Read: Best Biotech Stocks List By Performances & Trends: Daily, Weekly, Year-to-Date, Market Cap (Size) & Technical Trends | |||
| Best Biotech Stocks Views: Quick Browse View, Summary & Slide Show View | |||
| 12Stocks.com Biotech Stocks Performances & Trends Daily | |||||||||
|
|  The overall market intelligence score is 100 (0-bearish to 100-bullish) which puts Biotech sector in short term bullish trend. The market intelligence score from previous trading session is 90 and an improvement of trend continues.
| ||||||||
Here are the market intelligence trend scores of the most requested Biotech stocks at 12Stocks.com (click stock name for detailed review):
|


| 12Stocks.com: Investing in Biotech sector with Stocks | |
|
The following table helps investors and traders sort through current performance and trends (as measured by market intelligence score) of various
stocks in the Biotech sector. Quick View: Move mouse or cursor over stock symbol (ticker) to view short-term Technical chart and over stock name to view long term chart. Click on  to add stock symbol to your watchlist and to add stock symbol to your watchlist and  to view watchlist. Click on any ticker or stock name for detailed market intelligence report for that stock. to view watchlist. Click on any ticker or stock name for detailed market intelligence report for that stock. |
12Stocks.com Performance of Stocks in Biotech Sector
| Ticker | Stock Name | Watchlist | Category | Recent Price | Market Intelligence Score | Change % | YTD Change% |
| ETNB | 89bio |   | Biotechnology | 14.84 | 90 | 1.02% | 85.96% |
| CLLS | Cellectis ADR | | Biotechnology | 3.36 | 80 | 2.13% | 85.64% |
| VERV | Verve | | Biotechnology | 11.13 | 50 | 0.00% | 85.19% |
| ENTA | Enanta | | Biotechnology | 10.33 | 60 | -2.64% | 84.79% |
| THTX | Theratechnologies | | Biotechnology | 3.39 | 90 | 0.00% | 84.24% |
| LQDA | Liquidia Corp | | Biotechnology | 21.92 | 30 | -0.59% | 81.16% |
| LXRX | Lexicon | | Biotechnology | 1.39 | 80 | -1.77% | 78.23% |
| ARWR | Arrowhead | | Biotechnology | 34.59 | 90 | -1.20% | 76.03% |
| CRSP | CRISPR | | Biotechnology | 72.85 | 100 | 10.11% | 75.84% |
| BDTX | Black Diamond | | Biotechnology | 3.73 | 80 | 0.27% | 74.30% |
| CORT | Corcept | | Biotechnology | 85.53 | 70 | 1.51% | 71.15% |
| MIRM | Mirum | | Biotechnology | 71.75 | 30 | -1.71% | 70.67% |
| GHRS | GH Research | | Biotechnology | 13.34 | 30 | -1.69% | 68.65% |
| EYPT | EyePoint | | Biotechnology | 13.49 | 40 | 4.49% | 68.06% |
| PBYI | Puma nology | | Biotechnology | 5.22 | 100 | -0.95% | 67.31% |
| NTLA | Intellia | | Biotechnology | 20.44 | 100 | 8.96% | 67.27% |
| ALEC | Alector | | Biotechnology | 3.16 | 90 | 5.33% | 67.20% |
| PTGX | Protagonist | | Biotechnology | 65.03 | 50 | 1.61% | 66.83% |
| LGND | Ligand | | Biotechnology | 180.12 | 100 | 0.58% | 66.13% |
| AKRO | Akero | | Biotechnology | 46.41 | 30 | -0.30% | 65.28% |
| RIGL | Rigel | | Biotechnology | 28.11 | 30 | -0.19% | 62.28% |
| RYTM | Rhythm | | Biotechnology | 97.23 | 40 | -2.78% | 61.86% |
| PHAT | Phathom | | Biotechnology | 11.82 | 70 | -3.82% | 61.26% |
| PROK | ProKidney Corp | | Biotechnology | 2.78 | 80 | 6.92% | 60.69% |
| SLS | SELLAS Life | | Biotechnology | 1.71 | 50 | 1.18% | 59.81% |
| To view more stocks, click on Next / Previous arrows or select different range: 0 - 25 , 25 - 50 , 50 - 75 , 75 - 100 , 100 - 125 , 125 - 150 , 150 - 175 , 175 - 200 , 200 - 225 , 225 - 250 , 250 - 275 , 275 - 300 , 300 - 325 , 325 - 350 , 350 - 375 , 375 - 400 , 400 - 425 , 425 - 450 , 450 - 475 | ||
 | Click To Change The Sort Order: By Market Cap or Company Size Performance: Year-to-date, Week and Day |  |
|
Get the most comprehensive stock market coverage daily at 12Stocks.com ➞ Best Stocks Today ➞ Best Stocks Weekly ➞ Best Stocks Year-to-Date ➞ Best Stocks Trends ➞  Best Stocks Today 12Stocks.com Best Nasdaq Stocks ➞ Best S&P 500 Stocks ➞ Best Tech Stocks ➞ Best Biotech Stocks ➞ |
| Detailed Overview of Biotech Stocks |
| Biotech Technical Overview, Leaders & Laggards, Top Biotech ETF Funds & Detailed Biotech Stocks List, Charts, Trends & More |
| Biotech Sector: Technical Analysis, Trends & YTD Performance | |
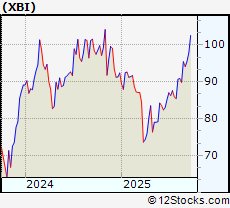
| Biotech sector, as represented by XBI, an exchange-traded fund [ETF] that holds basket of Biotech stocks (e.g, Amgen, Celgene) is up by 12.1001% and is currently underperforming the overall market by -2.6578% year-to-date. Below is a quick view of Technical charts and trends: | |
 XBI Weekly Chart |
|
| Long Term Trend: Very Good | |
| Medium Term Trend: Very Good | |
 XBI Daily Chart |
|
| Short Term Trend: Very Good | |
| Overall Trend Score: 100 | |
| YTD Performance: 12.1001% | |
| **Trend Scores & Views Are Only For Educational Purposes And Not For Investing | |
| 12Stocks.com: Top Performing Biotech Sector Stocks | ||||||||||||||||||||||||||||||||||||||||||||||
 The top performing Biotech sector stocks year to date are
Now, more recently, over last week, the top performing Biotech sector stocks on the move are


|
||||||||||||||||||||||||||||||||||||||||||||||
| 12Stocks.com: Investing in Biotech Sector using Exchange Traded Funds | |
|
The following table shows list of key exchange traded funds (ETF) that
help investors track Biotech Index. For detailed view, check out our ETF Funds section of our website. Quick View: Move mouse or cursor over ETF symbol (ticker) to view short-term Technical chart and over ETF name to view long term chart. Click on ticker or stock name for detailed view. Click on to add stock symbol to your watchlist and to view watchlist. |
12Stocks.com List of ETFs that track Biotech Index
| Ticker | ETF Name | Watchlist | Recent Price | Market Intelligence Score | Change % | Week % | Year-to-date % |
| UBIO | Biotechnology | | 73.34 | 80 | -0.0681292 | 260.748 | 0% |
| HCRF | Edge Multifactor | | 67.14 | 23 | 0 | 9999 | NA |
| SICK | Healthcare Bear 3X | | 37.90 | 36 | 0 | 9999 | NA |
| LABS | Biotech Bear 1X | | 24.18 | 56 | 0 | 9999 | NA |
| BTEC | Principal Healthcare Innovators | | 39.49 | 30 | 0 | 1.02328 | 0% |
| 12Stocks.com: Charts, Trends, Fundamental Data and Performances of Biotech Stocks | |
|
We now take in-depth look at all Biotech stocks including charts, multi-period performances and overall trends (as measured by market intelligence score). One can sort Biotech stocks (click link to choose) by Daily, Weekly and by Year-to-Date performances. Also, one can sort by size of the company or by market capitalization. |
| Select Your Default Chart Type: | |||||
| |||||
| Click on stock symbol or name for detailed view. Click on to add stock symbol to your watchlist and to view watchlist. Quick View: Move mouse or cursor over "Daily" to quickly view daily Technical stock chart and over "Weekly" to view weekly Technical stock chart. | |||||

 | ETNB 89bio Inc |
| Sector: Health Care | |
| SubSector: Biotechnology | |
| MarketCap: 1315.49 Millions | |
| Recent Price: 14.84 Market Intelligence Score: 90 | |
| Day Percent Change: 1.0211% Day Change: 0.09 | |
| Week Change: 0.952381% Year-to-date Change: 86.0% | |
| ETNB Links: Profile News Message Board | |
| Charts:- Daily , Weekly | |
| Add ETNB to Watchlist: View: Get Complete ETNB Trend Analysis ➞ | |
 | CLLS Cellectis ADR |
| Sector: Health Care | |
| SubSector: Biotechnology | |
| MarketCap: 193.2 Millions | |
| Recent Price: 3.36 Market Intelligence Score: 80 | |
| Day Percent Change: 2.12766% Day Change: -0.05 | |
| Week Change: -3.17003% Year-to-date Change: 85.6% | |
| CLLS Links: Profile News Message Board | |
| Charts:- Daily , Weekly | |
| Add CLLS to Watchlist: View: Get Complete CLLS Trend Analysis ➞ | |
 | VERV Verve Therapeutics, Inc. |
| Sector: Health Care | |
| SubSector: Biotechnology | |
| MarketCap: 1200 Millions | |
| Recent Price: 11.13 Market Intelligence Score: 50 | |
| Day Percent Change: 0% Day Change: -9999 | |
| Week Change: 1.64384% Year-to-date Change: 85.2% | |
| VERV Links: Profile News Message Board | |
| Charts:- Daily , Weekly | |
| Add VERV to Watchlist: View: Get Complete VERV Trend Analysis ➞ | |
 | ENTA Enanta Pharmaceuticals Inc |
| Sector: Health Care | |
| SubSector: Biotechnology | |
| MarketCap: 189.19 Millions | |
| Recent Price: 10.33 Market Intelligence Score: 60 | |
| Day Percent Change: -2.63902% Day Change: -0.23 | |
| Week Change: 32.2663% Year-to-date Change: 84.8% | |
| ENTA Links: Profile News Message Board | |
| Charts:- Daily , Weekly | |
| Add ENTA to Watchlist: View: Get Complete ENTA Trend Analysis ➞ | |
 | THTX Theratechnologies Inc |
| Sector: Health Care | |
| SubSector: Biotechnology | |
| MarketCap: 150.35 Millions | |
| Recent Price: 3.39 Market Intelligence Score: 90 | |
| Day Percent Change: 0% Day Change: 0 | |
| Week Change: 2.41692% Year-to-date Change: 84.2% | |
| THTX Links: Profile News Message Board | |
| Charts:- Daily , Weekly | |
| Add THTX to Watchlist: View: Get Complete THTX Trend Analysis ➞ | |
 | LQDA Liquidia Corp |
| Sector: Health Care | |
| SubSector: Biotechnology | |
| MarketCap: 2483.74 Millions | |
| Recent Price: 21.92 Market Intelligence Score: 30 | |
| Day Percent Change: -0.589569% Day Change: -0.05 | |
| Week Change: -0.0911577% Year-to-date Change: 81.2% | |
| LQDA Links: Profile News Message Board | |
| Charts:- Daily , Weekly | |
| Add LQDA to Watchlist: View: Get Complete LQDA Trend Analysis ➞ | |
 | LXRX Lexicon Pharmaceuticals Inc |
| Sector: Health Care | |
| SubSector: Biotechnology | |
| MarketCap: 396.1 Millions | |
| Recent Price: 1.39 Market Intelligence Score: 80 | |
| Day Percent Change: -1.77305% Day Change: 0.04 | |
| Week Change: 4.13534% Year-to-date Change: 78.2% | |
| LXRX Links: Profile News Message Board | |
| Charts:- Daily , Weekly | |
| Add LXRX to Watchlist: View: Get Complete LXRX Trend Analysis ➞ | |
 | ARWR Arrowhead Pharmaceuticals Inc |
| Sector: Health Care | |
| SubSector: Biotechnology | |
| MarketCap: 4019.84 Millions | |
| Recent Price: 34.59 Market Intelligence Score: 90 | |
| Day Percent Change: -1.19966% Day Change: 0.55 | |
| Week Change: 5.36095% Year-to-date Change: 76.0% | |
| ARWR Links: Profile News Message Board | |
| Charts:- Daily , Weekly | |
| Add ARWR to Watchlist: View: Get Complete ARWR Trend Analysis ➞ | |
 | CRSP CRISPR Therapeutics AG |
| Sector: Health Care | |
| SubSector: Biotechnology | |
| MarketCap: 4989.54 Millions | |
| Recent Price: 72.85 Market Intelligence Score: 100 | |
| Day Percent Change: 10.1118% Day Change: 2.41 | |
| Week Change: 19.3284% Year-to-date Change: 75.8% | |
| CRSP Links: Profile News Message Board | |
| Charts:- Daily , Weekly | |
| Add CRSP to Watchlist: View: Get Complete CRSP Trend Analysis ➞ | |
 | BDTX Black Diamond Therapeutics Inc |
| Sector: Health Care | |
| SubSector: Biotechnology | |
| MarketCap: 167.39 Millions | |
| Recent Price: 3.73 Market Intelligence Score: 80 | |
| Day Percent Change: 0.268817% Day Change: 0.11 | |
| Week Change: 14.4172% Year-to-date Change: 74.3% | |
| BDTX Links: Profile News Message Board | |
| Charts:- Daily , Weekly | |
| Add BDTX to Watchlist: View: Get Complete BDTX Trend Analysis ➞ | |
 | CORT Corcept Therapeutics Inc |
| Sector: Health Care | |
| SubSector: Biotechnology | |
| MarketCap: 7308.58 Millions | |
| Recent Price: 85.53 Market Intelligence Score: 70 | |
| Day Percent Change: 1.51335% Day Change: 0.58 | |
| Week Change: 2.00978% Year-to-date Change: 71.2% | |
| CORT Links: Profile News Message Board | |
| Charts:- Daily , Weekly | |
| Add CORT to Watchlist: View: Get Complete CORT Trend Analysis ➞ | |
 | MIRM Mirum Pharmaceuticals Inc |
| Sector: Health Care | |
| SubSector: Biotechnology | |
| MarketCap: 3821.08 Millions | |
| Recent Price: 71.75 Market Intelligence Score: 30 | |
| Day Percent Change: -1.71233% Day Change: 2.35 | |
| Week Change: -3.38002% Year-to-date Change: 70.7% | |
| MIRM Links: Profile News Message Board | |
| Charts:- Daily , Weekly | |
| Add MIRM to Watchlist: View: Get Complete MIRM Trend Analysis ➞ | |
 | GHRS GH Research PLC |
| Sector: Health Care | |
| SubSector: Biotechnology | |
| MarketCap: 873.98 Millions | |
| Recent Price: 13.34 Market Intelligence Score: 30 | |
| Day Percent Change: -1.69492% Day Change: 0.21 | |
| Week Change: -2.27106% Year-to-date Change: 68.6% | |
| GHRS Links: Profile News Message Board | |
| Charts:- Daily , Weekly | |
| Add GHRS to Watchlist: View: Get Complete GHRS Trend Analysis ➞ | |
 | EYPT EyePoint Pharmaceuticals Inc |
| Sector: Health Care | |
| SubSector: Biotechnology | |
| MarketCap: 965.67 Millions | |
| Recent Price: 13.49 Market Intelligence Score: 40 | |
| Day Percent Change: 4.4909% Day Change: 0.09 | |
| Week Change: -4.15483% Year-to-date Change: 68.1% | |
| EYPT Links: Profile News Message Board | |
| Charts:- Daily , Weekly | |
| Add EYPT to Watchlist: View: Get Complete EYPT Trend Analysis ➞ | |
 | PBYI Puma Biotechnology Inc |
| Sector: Health Care | |
| SubSector: Biotechnology | |
| MarketCap: 253.36 Millions | |
| Recent Price: 5.22 Market Intelligence Score: 100 | |
| Day Percent Change: -0.948767% Day Change: 0.11 | |
| Week Change: 10.5932% Year-to-date Change: 67.3% | |
| PBYI Links: Profile News Message Board | |
| Charts:- Daily , Weekly | |
| Add PBYI to Watchlist: View: Get Complete PBYI Trend Analysis ➞ | |
 | NTLA Intellia Therapeutics Inc |
| Sector: Health Care | |
| SubSector: Biotechnology | |
| MarketCap: 1294.6 Millions | |
| Recent Price: 20.44 Market Intelligence Score: 100 | |
| Day Percent Change: 8.95522% Day Change: -0.09 | |
| Week Change: 15.0901% Year-to-date Change: 67.3% | |
| NTLA Links: Profile News Message Board | |
| Charts:- Daily , Weekly | |
| Add NTLA to Watchlist: View: Get Complete NTLA Trend Analysis ➞ | |
 | ALEC Alector Inc |
| Sector: Health Care | |
| SubSector: Biotechnology | |
| MarketCap: 304.65 Millions | |
| Recent Price: 3.16 Market Intelligence Score: 90 | |
| Day Percent Change: 5.33333% Day Change: 0.07 | |
| Week Change: 0% Year-to-date Change: 67.2% | |
| ALEC Links: Profile News Message Board | |
| Charts:- Daily , Weekly | |
| Add ALEC to Watchlist: View: Get Complete ALEC Trend Analysis ➞ | |
 | PTGX Protagonist Therapeutics Inc |
| Sector: Health Care | |
| SubSector: Biotechnology | |
| MarketCap: 3765.65 Millions | |
| Recent Price: 65.03 Market Intelligence Score: 50 | |
| Day Percent Change: 1.60938% Day Change: -0.19 | |
| Week Change: -1.395% Year-to-date Change: 66.8% | |
| PTGX Links: Profile News Message Board | |
| Charts:- Daily , Weekly | |
| Add PTGX to Watchlist: View: Get Complete PTGX Trend Analysis ➞ | |
 | LGND Ligand Pharmaceuticals, Inc |
| Sector: Health Care | |
| SubSector: Biotechnology | |
| MarketCap: 3267.73 Millions | |
| Recent Price: 180.12 Market Intelligence Score: 100 | |
| Day Percent Change: 0.583554% Day Change: 2.06 | |
| Week Change: 6.60511% Year-to-date Change: 66.1% | |
| LGND Links: Profile News Message Board | |
| Charts:- Daily , Weekly | |
| Add LGND to Watchlist: View: Get Complete LGND Trend Analysis ➞ | |
 | AKRO Akero Therapeutics Inc |
| Sector: Health Care | |
| SubSector: Biotechnology | |
| MarketCap: 3577.11 Millions | |
| Recent Price: 46.41 Market Intelligence Score: 30 | |
| Day Percent Change: -0.300752% Day Change: 0.34 | |
| Week Change: -2.21239% Year-to-date Change: 65.3% | |
| AKRO Links: Profile News Message Board | |
| Charts:- Daily , Weekly | |
| Add AKRO to Watchlist: View: Get Complete AKRO Trend Analysis ➞ | |
 | RIGL Rigel Pharmaceuticals |
| Sector: Health Care | |
| SubSector: Biotechnology | |
| MarketCap: 741.53 Millions | |
| Recent Price: 28.11 Market Intelligence Score: 30 | |
| Day Percent Change: -0.18821% Day Change: 0.63 | |
| Week Change: -7.17635% Year-to-date Change: 62.3% | |
| RIGL Links: Profile News Message Board | |
| Charts:- Daily , Weekly | |
| Add RIGL to Watchlist: View: Get Complete RIGL Trend Analysis ➞ | |
 | RYTM Rhythm Pharmaceuticals Inc |
| Sector: Health Care | |
| SubSector: Biotechnology | |
| MarketCap: 6782.82 Millions | |
| Recent Price: 97.23 Market Intelligence Score: 40 | |
| Day Percent Change: -2.77972% Day Change: 2.98 | |
| Week Change: 0.330203% Year-to-date Change: 61.9% | |
| RYTM Links: Profile News Message Board | |
| Charts:- Daily , Weekly | |
| Add RYTM to Watchlist: View: Get Complete RYTM Trend Analysis ➞ | |
 | PHAT Phathom Pharmaceuticals Inc |
| Sector: Health Care | |
| SubSector: Biotechnology | |
| MarketCap: 875.45 Millions | |
| Recent Price: 11.82 Market Intelligence Score: 70 | |
| Day Percent Change: -3.82425% Day Change: 0.32 | |
| Week Change: 0.939368% Year-to-date Change: 61.3% | |
| PHAT Links: Profile News Message Board | |
| Charts:- Daily , Weekly | |
| Add PHAT to Watchlist: View: Get Complete PHAT Trend Analysis ➞ | |
 | PROK ProKidney Corp |
| Sector: Health Care | |
| SubSector: Biotechnology | |
| MarketCap: 662.14 Millions | |
| Recent Price: 2.78 Market Intelligence Score: 80 | |
| Day Percent Change: 6.92308% Day Change: 0.04 | |
| Week Change: 2.20588% Year-to-date Change: 60.7% | |
| PROK Links: Profile News Message Board | |
| Charts:- Daily , Weekly | |
| Add PROK to Watchlist: View: Get Complete PROK Trend Analysis ➞ | |
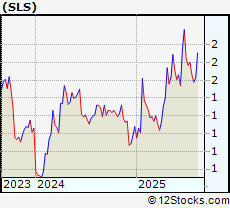 | SLS SELLAS Life Sciences Group Inc |
| Sector: Health Care | |
| SubSector: Biotechnology | |
| MarketCap: 201.12 Millions | |
| Recent Price: 1.71 Market Intelligence Score: 50 | |
| Day Percent Change: 1.18343% Day Change: -0.09 | |
| Week Change: 4.90798% Year-to-date Change: 59.8% | |
| SLS Links: Profile News Message Board | |
| Charts:- Daily , Weekly | |
| Add SLS to Watchlist: View: Get Complete SLS Trend Analysis ➞ | |
| To view more stocks, click on Next / Previous arrows or select different range: 0 - 25 , 25 - 50 , 50 - 75 , 75 - 100 , 100 - 125 , 125 - 150 , 150 - 175 , 175 - 200 , 200 - 225 , 225 - 250 , 250 - 275 , 275 - 300 , 300 - 325 , 325 - 350 , 350 - 375 , 375 - 400 , 400 - 425 , 425 - 450 , 450 - 475 | ||
| Click To Change The Sort Order: By Market Cap or Company Size Performance: Year-to-date, Week and Day | |
| Select Chart Type: | ||
|
Best Stocks Today 12Stocks.com |
© 2025 12Stocks.com Terms & Conditions Privacy Contact Us
All Information Provided Only For Education And Not To Be Used For Investing or Trading. See Terms & Conditions


One More Thing ... Get Best Stocks Delivered Daily!
Never Ever Miss A Move With Our Top Ten Stocks Lists
Find Best Stocks In Any Market - Bull or Bear Market
Take A Peek At Our Top Ten Stocks Lists: Daily, Weekly, Year-to-Date & Top Trends
Find Best Stocks In Any Market - Bull or Bear Market
Take A Peek At Our Top Ten Stocks Lists: Daily, Weekly, Year-to-Date & Top Trends
Biotech Stocks With Best Up Trends [0-bearish to 100-bullish]: Taysha Gene[100], DBV Technologies[100], Valneva SE[100], Prime Medicine[100], AlloVir [100], Sarepta [100], Monopar [100], Cara [100], Absci Corp[100], Spruce [100], Cabaletta Bio[100]
Best Biotech Stocks Year-to-Date:
Kaleido [9900%], Vor Biopharma[3175%], Nanobiotix ADR[581.379%], I-Mab ADR[357.506%], Monopar [337.489%], Nektar [319.84%], DBV Technologies[276.923%], Celcuity [276.39%], Galectin [263.248%], Cidara [260.806%], Lineage Cell[233.981%] Best Biotech Stocks This Week:
Athersys [193287%], VBI Vaccines[86898.5%], ContraFect [47677.8%], Clovis Oncology[39610.5%], NanoString Technologies[17224.7%], Neptune Wellness[14100%], Achillion [10033.3%], Kaleido [9900%], Nymox [8258.49%], Epizyme [5739.46%], Portola [4717.55%] Best Biotech Stocks Daily:
Kaleido [9900%], Neoleukin [332.665%], Syros [226.23%], Athenex [103.333%], Taysha Gene[53.4591%], DBV Technologies[21.6485%], Valneva SE[20.197%], Prime Medicine[19.4097%], Aptose [17.5439%], AlloVir [16.9215%], Sarepta [15.6832%]