
 Login Sign Up


| |||||
 |  | ||||

| 12Stocks.com Market Intelligence |
Best Biotech Stocks
|
|
| Quick Read: Best Biotech Stocks List By Performances & Trends: Daily, Weekly, Year-to-Date, Market Cap (Size) & Technical Trends | |||
| Best Biotech Stocks Views: Quick Browse View, Summary & Slide Show View | |||
| 12Stocks.com Biotech Stocks Performances & Trends Daily | |||||||||
|
|  The overall market intelligence score is 100 (0-bearish to 100-bullish) which puts Biotech sector in short term bullish trend. The market intelligence score from previous trading session is 90 and an improvement of trend continues.
| ||||||||
Here are the market intelligence trend scores of the most requested Biotech stocks at 12Stocks.com (click stock name for detailed review):
|


| 12Stocks.com: Investing in Biotech sector with Stocks | |
|
The following table helps investors and traders sort through current performance and trends (as measured by market intelligence score) of various
stocks in the Biotech sector. Quick View: Move mouse or cursor over stock symbol (ticker) to view short-term Technical chart and over stock name to view long term chart. Click on  to add stock symbol to your watchlist and to add stock symbol to your watchlist and  to view watchlist. Click on any ticker or stock name for detailed market intelligence report for that stock. to view watchlist. Click on any ticker or stock name for detailed market intelligence report for that stock. |
12Stocks.com Performance of Stocks in Biotech Sector
| Ticker | Stock Name | Watchlist | Category | Recent Price | Market Intelligence Score | Change % | YTD Change% |
| BLUE | bluebird bio |   | Biotechnology | 4.97 | 40 | 0.00% | -42.81% |
| VCEL | Vericel Corp | | Biotechnology | 31.52 | 40 | 1.97% | -42.81% |
| ANNX | Annexon | | Biotechnology | 3.12 | 80 | 2.97% | -43.27% |
| BMEA | Biomea Fusion | | Biotechnology | 2.09 | 80 | 3.47% | -43.36% |
| GRTX | Galera | | Biotechnology | 0.02 | 30 | 0.44% | -43.64% |
| EWTX | Edgewise | | Biotechnology | 15.00 | 50 | -2.85% | -44.51% |
| ZNTL | Zentalis | | Biotechnology | 1.66 | 90 | 7.79% | -44.67% |
| ALT | Altimmune | | Biotechnology | 3.93 | 100 | 1.55% | -44.73% |
| IFRX | InflaRx N.V | | Biotechnology | 1.38 | 80 | 1.47% | -44.80% |
| MRVI | Maravai Life | | Biotechnology | 2.96 | 90 | -5.57% | -45.99% |
| CAPR | Capricor | | Biotechnology | 7.98 | 90 | 2.05% | -46.66% |
| WVE | Wave Life | | Biotechnology | 7.02 | 30 | -0.14% | -47.28% |
| MGNX | Macrogenics | | Biotechnology | 1.71 | 50 | 0.29% | -48.33% |
| VXRT | Vaxart | | Biotechnology | 0.37 | 50 | -1.60% | -48.52% |
| CDXS | Codexis | | Biotechnology | 2.52 | 50 | 0.80% | -49.60% |
| XNCR | Xencor | | Biotechnology | 11.83 | 90 | 0.00% | -50.27% |
| OBIO | Orchestra BioMed | | Biotechnology | 2.66 | 80 | 4.31% | -50.56% |
| DYN | Dyne | | Biotechnology | 12.55 | 50 | 0.40% | -50.71% |
| ARVN | Arvinas | | Biotechnology | 9.28 | 100 | 1.59% | -50.90% |
| THRD | Third Harmonic | | Biotechnology | 5.38 | 30 | 0.00% | -51.27% |
| PCVX | Vaxcyte | | Biotechnology | 40.15 | 100 | 5.57% | -51.80% |
| HOOK | HOOKIPA Pharma | | Biotechnology | 0.92 | 70 | 3.37% | -52.82% |
| NRIX | Nurix | | Biotechnology | 9.08 | 40 | -3.40% | -53.46% |
| CGEM | Cullinan | | Biotechnology | 5.75 | 10 | -4.17% | -53.59% |
| CBIO | Crescent Biopharma | | Biotechnology | 12.03 | 20 | 1.09% | -53.73% |
| To view more stocks, click on Next / Previous arrows or select different range: 0 - 25 , 25 - 50 , 50 - 75 , 75 - 100 , 100 - 125 , 125 - 150 , 150 - 175 , 175 - 200 , 200 - 225 , 225 - 250 , 250 - 275 , 275 - 300 , 300 - 325 , 325 - 350 , 350 - 375 , 375 - 400 , 400 - 425 , 425 - 450 , 450 - 475 | ||
 | Click To Change The Sort Order: By Market Cap or Company Size Performance: Year-to-date, Week and Day |  |
|
Get the most comprehensive stock market coverage daily at 12Stocks.com ➞ Best Stocks Today ➞ Best Stocks Weekly ➞ Best Stocks Year-to-Date ➞ Best Stocks Trends ➞  Best Stocks Today 12Stocks.com Best Nasdaq Stocks ➞ Best S&P 500 Stocks ➞ Best Tech Stocks ➞ Best Biotech Stocks ➞ |
| Detailed Overview of Biotech Stocks |
| Biotech Technical Overview, Leaders & Laggards, Top Biotech ETF Funds & Detailed Biotech Stocks List, Charts, Trends & More |
| Biotech Sector: Technical Analysis, Trends & YTD Performance | |
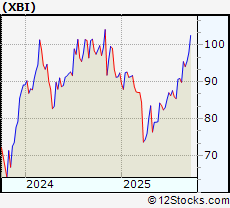
| Biotech sector, as represented by XBI, an exchange-traded fund [ETF] that holds basket of Biotech stocks (e.g, Amgen, Celgene) is up by 12.1001% and is currently underperforming the overall market by -2.6578% year-to-date. Below is a quick view of Technical charts and trends: | |
 XBI Weekly Chart |
|
| Long Term Trend: Very Good | |
| Medium Term Trend: Very Good | |
 XBI Daily Chart |
|
| Short Term Trend: Very Good | |
| Overall Trend Score: 100 | |
| YTD Performance: 12.1001% | |
| **Trend Scores & Views Are Only For Educational Purposes And Not For Investing | |
| 12Stocks.com: Top Performing Biotech Sector Stocks | ||||||||||||||||||||||||||||||||||||||||||||||
 The top performing Biotech sector stocks year to date are
Now, more recently, over last week, the top performing Biotech sector stocks on the move are


|
||||||||||||||||||||||||||||||||||||||||||||||
| 12Stocks.com: Investing in Biotech Sector using Exchange Traded Funds | |
|
The following table shows list of key exchange traded funds (ETF) that
help investors track Biotech Index. For detailed view, check out our ETF Funds section of our website. Quick View: Move mouse or cursor over ETF symbol (ticker) to view short-term Technical chart and over ETF name to view long term chart. Click on ticker or stock name for detailed view. Click on to add stock symbol to your watchlist and to view watchlist. |
12Stocks.com List of ETFs that track Biotech Index
| Ticker | ETF Name | Watchlist | Recent Price | Market Intelligence Score | Change % | Week % | Year-to-date % |
| UBIO | Biotechnology | | 73.34 | 80 | -0.0681292 | 260.748 | 0% |
| HCRF | Edge Multifactor | | 67.14 | 23 | 0 | 9999 | NA |
| SICK | Healthcare Bear 3X | | 37.90 | 36 | 0 | 9999 | NA |
| LABS | Biotech Bear 1X | | 24.18 | 56 | 0 | 9999 | NA |
| BTEC | Principal Healthcare Innovators | | 39.49 | 30 | 0 | 1.02328 | 0% |
| 12Stocks.com: Charts, Trends, Fundamental Data and Performances of Biotech Stocks | |
|
We now take in-depth look at all Biotech stocks including charts, multi-period performances and overall trends (as measured by market intelligence score). One can sort Biotech stocks (click link to choose) by Daily, Weekly and by Year-to-Date performances. Also, one can sort by size of the company or by market capitalization. |
| Select Your Default Chart Type: | |||||
| |||||
| Click on stock symbol or name for detailed view. Click on to add stock symbol to your watchlist and to view watchlist. Quick View: Move mouse or cursor over "Daily" to quickly view daily Technical stock chart and over "Weekly" to view weekly Technical stock chart. | |||||

 | BLUE bluebird bio, Inc. |
| Sector: Health Care | |
| SubSector: Biotechnology | |
| MarketCap: 3365.05 Millions | |
| Recent Price: 4.97 Market Intelligence Score: 40 | |
| Day Percent Change: 0% Day Change: -9999 | |
| Week Change: 0% Year-to-date Change: -42.8% | |
| BLUE Links: Profile News Message Board | |
| Charts:- Daily , Weekly | |
| Add BLUE to Watchlist: View: Get Complete BLUE Trend Analysis ➞ | |
 | VCEL Vericel Corp |
| Sector: Health Care | |
| SubSector: Biotechnology | |
| MarketCap: 1718.17 Millions | |
| Recent Price: 31.52 Market Intelligence Score: 40 | |
| Day Percent Change: 1.97347% Day Change: 0.08 | |
| Week Change: 4.19835% Year-to-date Change: -42.8% | |
| VCEL Links: Profile News Message Board | |
| Charts:- Daily , Weekly | |
| Add VCEL to Watchlist: View: Get Complete VCEL Trend Analysis ➞ | |
 | ANNX Annexon Inc |
| Sector: Health Care | |
| SubSector: Biotechnology | |
| MarketCap: 238.45 Millions | |
| Recent Price: 3.12 Market Intelligence Score: 80 | |
| Day Percent Change: 2.9703% Day Change: 0.03 | |
| Week Change: 10.6383% Year-to-date Change: -43.3% | |
| ANNX Links: Profile News Message Board | |
| Charts:- Daily , Weekly | |
| Add ANNX to Watchlist: View: Get Complete ANNX Trend Analysis ➞ | |
 | BMEA Biomea Fusion Inc |
| Sector: Health Care | |
| SubSector: Biotechnology | |
| MarketCap: 114.26 Millions | |
| Recent Price: 2.09 Market Intelligence Score: 80 | |
| Day Percent Change: 3.46535% Day Change: 0.01 | |
| Week Change: 5.02513% Year-to-date Change: -43.4% | |
| BMEA Links: Profile News Message Board | |
| Charts:- Daily , Weekly | |
| Add BMEA to Watchlist: View: Get Complete BMEA Trend Analysis ➞ | |
 | GRTX Galera Therapeutics, Inc. |
| Sector: Health Care | |
| SubSector: Biotechnology | |
| MarketCap: 277.585 Millions | |
| Recent Price: 0.02 Market Intelligence Score: 30 | |
| Day Percent Change: 0.444444% Day Change: -9999 | |
| Week Change: -1.73913% Year-to-date Change: -43.6% | |
| GRTX Links: Profile News Message Board | |
| Charts:- Daily , Weekly | |
| Add GRTX to Watchlist: View: Get Complete GRTX Trend Analysis ➞ | |
 | EWTX Edgewise Therapeutics Inc |
| Sector: Health Care | |
| SubSector: Biotechnology | |
| MarketCap: 1640.23 Millions | |
| Recent Price: 15.00 Market Intelligence Score: 50 | |
| Day Percent Change: -2.84974% Day Change: 0.78 | |
| Week Change: -9.58409% Year-to-date Change: -44.5% | |
| EWTX Links: Profile News Message Board | |
| Charts:- Daily , Weekly | |
| Add EWTX to Watchlist: View: Get Complete EWTX Trend Analysis ➞ | |
 | ZNTL Zentalis Pharmaceuticals Inc |
| Sector: Health Care | |
| SubSector: Biotechnology | |
| MarketCap: 126.24 Millions | |
| Recent Price: 1.66 Market Intelligence Score: 90 | |
| Day Percent Change: 7.79221% Day Change: 0.23 | |
| Week Change: 9.21053% Year-to-date Change: -44.7% | |
| ZNTL Links: Profile News Message Board | |
| Charts:- Daily , Weekly | |
| Add ZNTL to Watchlist: View: Get Complete ZNTL Trend Analysis ➞ | |
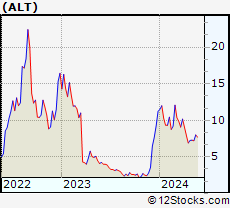 | ALT Altimmune Inc |
| Sector: Health Care | |
| SubSector: Biotechnology | |
| MarketCap: 333.61 Millions | |
| Recent Price: 3.93 Market Intelligence Score: 100 | |
| Day Percent Change: 1.55039% Day Change: -0.1 | |
| Week Change: 0.255102% Year-to-date Change: -44.7% | |
| ALT Links: Profile News Message Board | |
| Charts:- Daily , Weekly | |
| Add ALT to Watchlist: View: Get Complete ALT Trend Analysis ➞ | |
 | IFRX InflaRx N.V |
| Sector: Health Care | |
| SubSector: Biotechnology | |
| MarketCap: 110.77 Millions | |
| Recent Price: 1.38 Market Intelligence Score: 80 | |
| Day Percent Change: 1.47059% Day Change: 0.01 | |
| Week Change: 1.47059% Year-to-date Change: -44.8% | |
| IFRX Links: Profile News Message Board | |
| Charts:- Daily , Weekly | |
| Add IFRX to Watchlist: View: Get Complete IFRX Trend Analysis ➞ | |
 | MRVI Maravai LifeSciences Holdings Inc |
| Sector: Health Care | |
| SubSector: Biotechnology | |
| MarketCap: 640.96 Millions | |
| Recent Price: 2.96 Market Intelligence Score: 90 | |
| Day Percent Change: -5.57325% Day Change: -0.06 | |
| Week Change: 9.00735% Year-to-date Change: -46.0% | |
| MRVI Links: Profile News Message Board | |
| Charts:- Daily , Weekly | |
| Add MRVI to Watchlist: View: Get Complete MRVI Trend Analysis ➞ | |
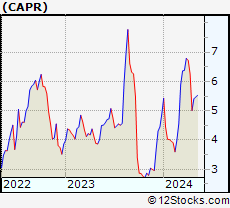 | CAPR Capricor Therapeutics Inc |
| Sector: Health Care | |
| SubSector: Biotechnology | |
| MarketCap: 308.13 Millions | |
| Recent Price: 7.98 Market Intelligence Score: 90 | |
| Day Percent Change: 2.04604% Day Change: -0.16 | |
| Week Change: 28.9176% Year-to-date Change: -46.7% | |
| CAPR Links: Profile News Message Board | |
| Charts:- Daily , Weekly | |
| Add CAPR to Watchlist: View: Get Complete CAPR Trend Analysis ➞ | |
 | WVE Wave Life Sciences Ltd |
| Sector: Health Care | |
| SubSector: Biotechnology | |
| MarketCap: 1319.27 Millions | |
| Recent Price: 7.02 Market Intelligence Score: 30 | |
| Day Percent Change: -0.142248% Day Change: 0.31 | |
| Week Change: 4.30906% Year-to-date Change: -47.3% | |
| WVE Links: Profile News Message Board | |
| Charts:- Daily , Weekly | |
| Add WVE to Watchlist: View: Get Complete WVE Trend Analysis ➞ | |
 | MGNX Macrogenics Inc |
| Sector: Health Care | |
| SubSector: Biotechnology | |
| MarketCap: 126.41 Millions | |
| Recent Price: 1.71 Market Intelligence Score: 50 | |
| Day Percent Change: 0.294118% Day Change: -0.05 | |
| Week Change: -0.872093% Year-to-date Change: -48.3% | |
| MGNX Links: Profile News Message Board | |
| Charts:- Daily , Weekly | |
| Add MGNX to Watchlist: View: Get Complete MGNX Trend Analysis ➞ | |
 | VXRT Vaxart, Inc. |
| Sector: Health Care | |
| SubSector: Biotechnology | |
| MarketCap: 129.785 Millions | |
| Recent Price: 0.37 Market Intelligence Score: 50 | |
| Day Percent Change: -1.59574% Day Change: -0.01 | |
| Week Change: 2.77778% Year-to-date Change: -48.5% | |
| VXRT Links: Profile News Message Board | |
| Charts:- Daily , Weekly | |
| Add VXRT to Watchlist: View: Get Complete VXRT Trend Analysis ➞ | |
 | CDXS Codexis Inc |
| Sector: Health Care | |
| SubSector: Biotechnology | |
| MarketCap: 218.45 Millions | |
| Recent Price: 2.52 Market Intelligence Score: 50 | |
| Day Percent Change: 0.8% Day Change: 0 | |
| Week Change: 1.6129% Year-to-date Change: -49.6% | |
| CDXS Links: Profile News Message Board | |
| Charts:- Daily , Weekly | |
| Add CDXS to Watchlist: View: Get Complete CDXS Trend Analysis ➞ | |
 | XNCR Xencor Inc |
| Sector: Health Care | |
| SubSector: Biotechnology | |
| MarketCap: 609.81 Millions | |
| Recent Price: 11.83 Market Intelligence Score: 90 | |
| Day Percent Change: 0% Day Change: -0.07 | |
| Week Change: 12.7741% Year-to-date Change: -50.3% | |
| XNCR Links: Profile News Message Board | |
| Charts:- Daily , Weekly | |
| Add XNCR to Watchlist: View: Get Complete XNCR Trend Analysis ➞ | |
 | OBIO Orchestra BioMed Holdings Inc |
| Sector: Health Care | |
| SubSector: Biotechnology | |
| MarketCap: 148.38 Millions | |
| Recent Price: 2.66 Market Intelligence Score: 80 | |
| Day Percent Change: 4.31373% Day Change: 0.06 | |
| Week Change: 9.91736% Year-to-date Change: -50.6% | |
| OBIO Links: Profile News Message Board | |
| Charts:- Daily , Weekly | |
| Add OBIO to Watchlist: View: Get Complete OBIO Trend Analysis ➞ | |
 | DYN Dyne Therapeutics Inc |
| Sector: Health Care | |
| SubSector: Biotechnology | |
| MarketCap: 2022.99 Millions | |
| Recent Price: 12.55 Market Intelligence Score: 50 | |
| Day Percent Change: 0.4% Day Change: 0.25 | |
| Week Change: -4.70767% Year-to-date Change: -50.7% | |
| DYN Links: Profile News Message Board | |
| Charts:- Daily , Weekly | |
| Add DYN to Watchlist: View: Get Complete DYN Trend Analysis ➞ | |
 | ARVN Arvinas Inc |
| Sector: Health Care | |
| SubSector: Biotechnology | |
| MarketCap: 574.86 Millions | |
| Recent Price: 9.28 Market Intelligence Score: 100 | |
| Day Percent Change: 1.58817% Day Change: 0.2 | |
| Week Change: 19.9871% Year-to-date Change: -50.9% | |
| ARVN Links: Profile News Message Board | |
| Charts:- Daily , Weekly | |
| Add ARVN to Watchlist: View: Get Complete ARVN Trend Analysis ➞ | |
 | THRD Third Harmonic Bio, Inc. |
| Sector: Health Care | |
| SubSector: Biotechnology | |
| MarketCap: 190 Millions | |
| Recent Price: 5.38 Market Intelligence Score: 30 | |
| Day Percent Change: 0% Day Change: -9999 | |
| Week Change: 0% Year-to-date Change: -51.3% | |
| THRD Links: Profile News Message Board | |
| Charts:- Daily , Weekly | |
| Add THRD to Watchlist: View: Get Complete THRD Trend Analysis ➞ | |
 | PCVX Vaxcyte Inc |
| Sector: Health Care | |
| SubSector: Biotechnology | |
| MarketCap: 4286.77 Millions | |
| Recent Price: 40.15 Market Intelligence Score: 100 | |
| Day Percent Change: 5.57455% Day Change: 0.65 | |
| Week Change: 22.3339% Year-to-date Change: -51.8% | |
| PCVX Links: Profile News Message Board | |
| Charts:- Daily , Weekly | |
| Add PCVX to Watchlist: View: Get Complete PCVX Trend Analysis ➞ | |
 | HOOK HOOKIPA Pharma Inc. |
| Sector: Health Care | |
| SubSector: Biotechnology | |
| MarketCap: 294.785 Millions | |
| Recent Price: 0.92 Market Intelligence Score: 70 | |
| Day Percent Change: 3.37079% Day Change: 0 | |
| Week Change: 0.987925% Year-to-date Change: -52.8% | |
| HOOK Links: Profile News Message Board | |
| Charts:- Daily , Weekly | |
| Add HOOK to Watchlist: View: Get Complete HOOK Trend Analysis ➞ | |
 | NRIX Nurix Therapeutics Inc |
| Sector: Health Care | |
| SubSector: Biotechnology | |
| MarketCap: 757.61 Millions | |
| Recent Price: 9.08 Market Intelligence Score: 40 | |
| Day Percent Change: -3.40426% Day Change: 0.12 | |
| Week Change: 4.36782% Year-to-date Change: -53.5% | |
| NRIX Links: Profile News Message Board | |
| Charts:- Daily , Weekly | |
| Add NRIX to Watchlist: View: Get Complete NRIX Trend Analysis ➞ | |
 | CGEM Cullinan Therapeutics Inc |
| Sector: Health Care | |
| SubSector: Biotechnology | |
| MarketCap: 412.93 Millions | |
| Recent Price: 5.75 Market Intelligence Score: 10 | |
| Day Percent Change: -4.16667% Day Change: 0.2 | |
| Week Change: -4.64345% Year-to-date Change: -53.6% | |
| CGEM Links: Profile News Message Board | |
| Charts:- Daily , Weekly | |
| Add CGEM to Watchlist: View: Get Complete CGEM Trend Analysis ➞ | |
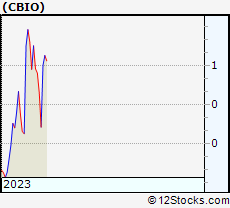 | CBIO Crescent Biopharma Inc |
| Sector: Health Care | |
| SubSector: Biotechnology | |
| MarketCap: 197.83 Millions | |
| Recent Price: 12.03 Market Intelligence Score: 20 | |
| Day Percent Change: 1.09244% Day Change: 0.6 | |
| Week Change: -7.31895% Year-to-date Change: -53.7% | |
| CBIO Links: Profile News Message Board | |
| Charts:- Daily , Weekly | |
| Add CBIO to Watchlist: View: Get Complete CBIO Trend Analysis ➞ | |
| To view more stocks, click on Next / Previous arrows or select different range: 0 - 25 , 25 - 50 , 50 - 75 , 75 - 100 , 100 - 125 , 125 - 150 , 150 - 175 , 175 - 200 , 200 - 225 , 225 - 250 , 250 - 275 , 275 - 300 , 300 - 325 , 325 - 350 , 350 - 375 , 375 - 400 , 400 - 425 , 425 - 450 , 450 - 475 | ||
| Click To Change The Sort Order: By Market Cap or Company Size Performance: Year-to-date, Week and Day | |
| Select Chart Type: | ||
|
Best Stocks Today 12Stocks.com |
© 2025 12Stocks.com Terms & Conditions Privacy Contact Us
All Information Provided Only For Education And Not To Be Used For Investing or Trading. See Terms & Conditions


One More Thing ... Get Best Stocks Delivered Daily!
Never Ever Miss A Move With Our Top Ten Stocks Lists
Find Best Stocks In Any Market - Bull or Bear Market
Take A Peek At Our Top Ten Stocks Lists: Daily, Weekly, Year-to-Date & Top Trends
Find Best Stocks In Any Market - Bull or Bear Market
Take A Peek At Our Top Ten Stocks Lists: Daily, Weekly, Year-to-Date & Top Trends
Biotech Stocks With Best Up Trends [0-bearish to 100-bullish]: Taysha Gene[100], DBV Technologies[100], Valneva SE[100], Prime Medicine[100], AlloVir [100], Sarepta [100], Monopar [100], Cara [100], Absci Corp[100], Spruce [100], Cabaletta Bio[100]
Best Biotech Stocks Year-to-Date:
Kaleido [9900%], Vor Biopharma[3175%], Nanobiotix ADR[581.379%], I-Mab ADR[357.506%], Monopar [337.489%], Nektar [319.84%], DBV Technologies[276.923%], Celcuity [276.39%], Galectin [263.248%], Cidara [260.806%], Lineage Cell[233.981%] Best Biotech Stocks This Week:
Athersys [193287%], VBI Vaccines[86898.5%], ContraFect [47677.8%], Clovis Oncology[39610.5%], NanoString Technologies[17224.7%], Neptune Wellness[14100%], Achillion [10033.3%], Kaleido [9900%], Nymox [8258.49%], Epizyme [5739.46%], Portola [4717.55%] Best Biotech Stocks Daily:
Kaleido [9900%], Neoleukin [332.665%], Syros [226.23%], Athenex [103.333%], Taysha Gene[53.4591%], DBV Technologies[21.6485%], Valneva SE[20.197%], Prime Medicine[19.4097%], Aptose [17.5439%], AlloVir [16.9215%], Sarepta [15.6832%]