
 Login Sign Up


| |||||
 |  | ||||

| 12Stocks.com Market Intelligence |
Best Asia Stocks
|
|
| Quick Read: Top Asia Stocks By Performances & Trends: Daily, Weekly, Year-to-Date, Market Cap (Size) & Technical Trends | |||
| Best Asia Views: Quick Browse View, Summary & Slide Show | |||
| 12Stocks.com Asia Stocks Performances & Trends Daily | |||||||||
|
|  The overall market intelligence score is 100 (0-bearish to 100-bullish) which puts Asia index in short term bullish trend. The market intelligence score from previous trading session is 60 and hence an improvement of trend.
| ||||||||
Here are the market intelligence trend scores of the most requested Asia stocks at 12Stocks.com (click stock name for detailed review):
|


| Consider signing up for our daily 12Stocks.com "Best Stocks Newsletter". You will never ever miss a big stock move again! |
| 12Stocks.com: Top Performing Asia Index Stocks | |||||||||||||||||||||||||||||||||||||||||||||||
 The top performing Asia Index stocks year to date are
Now, more recently, over last week, the top performing Asia Index stocks on the move are


|
|||||||||||||||||||||||||||||||||||||||||||||||
| 12Stocks.com: Investing in Asia Index with Stocks | |
|
The following table helps investors and traders sort through current performance and trends (as measured by market intelligence score) of various
stocks in the Asia Index. Quick View: Move mouse or cursor over stock symbol (ticker) to view short-term technical chart and over stock name to view long term chart. Click on  to add stock symbol to your watchlist and to add stock symbol to your watchlist and  to view watchlist. Click on any ticker or stock name for detailed market intelligence report for that stock. to view watchlist. Click on any ticker or stock name for detailed market intelligence report for that stock. |
12Stocks.com Performance of Stocks in Asia Index
| Ticker | Stock Name | Watchlist | Category | Recent Price | Market Intelligence Score | Change % | Weekly Change% |
| DTSS | Datasea |   | Industrials | 1.84 | 70 | -2.76% | 0.98% |
| EDTK | Skillful Craftsman | | Consumer Staples | 1.04 | 50 | 2.97% | 0.97% |
| SFWL | Shengfeng Development | | Industrials | 1.04 | 59 | 2.94% | 0.94% |
| CHT | Chunghwa Telecom | | Technology | 45.50 | 30 | 0.02% | 0.91% |
| WNS | WNS () | | Services & Goods | 75.51 | 70 | 0.28% | 0.75% |
| HUYA | HUYA | | Services & Goods | 3.32 | 40 | 4.08% | 0.61% |
| YUMC | Yum China | | Services & Goods | 45.09 | 80 | 1.08% | 0.60% |
| JD | JD.com | | Technology | 31.88 | 60 | 2.25% | 0.57% |
| GDS | GDS | | Technology | 32.00 | 60 | -5.60% | 0.50% |
| PETZ | TDH | | Consumer Staples | 0.98 | 30 | -2.48% | 0.40% |
| CBAT | CBAK Energy | | Health Care | 0.99 | 40 | 1.12% | 0.23% |
| BIDU | Baidu | | Technology | 90.01 | 80 | 2.74% | 0.18% |
| JFIN | Jiayin | | Technology | 13.28 | 70 | 8.41% | 0.15% |
| ATAT | Atour Lifestyle | | Services & Goods | 34.49 | 51 | 1.56% | 0.03% |
| CWS | AdvisorShares Focused | | Utilities | 68.74 | 80 | -0.29% | 0.02% |
| CALI | China Auto | | Services & Goods | 50.54 | 70 | -0.02% | 0.01% |
| IH | iHuman | | Consumer Staples | 2.75 | 40 | 3.77% | 0.00% |
| PERF | Perfect | | Technology | 1.90 | 40 | -1.04% | 0.00% |
| UTSI | UTStarcom | | Technology | 2.40 | 0 | 0.00% | 0.00% |
| HIMX | Himax | | Technology | 7.50 | 50 | 0.13% | 0.00% |
| TOP | TOP Financial | | Financials | 1.17 | 43 | 0.91% | -0.07% |
| OCFT | OneConnect Financial | | Technology | 7.42 | 50 | 1.09% | -0.13% |
| CPSL | China Precision | | Materials | 26.59 | 80 | 0.02% | -0.16% |
| SOHU | Sohu.com | | Technology | 15.53 | 70 | 1.77% | -0.19% |
| BILI | Bilibili | | Technology | 23.76 | 40 | -6.11% | -0.25% |
| To view more stocks, click on Next / Previous arrows or select different range: 0 - 25 , 25 - 50 , 50 - 75 , 75 - 100 , 100 - 125 , 125 - 150 , 150 - 175 , 175 - 200 | ||
 | Click To Change The Sort Order: By Market Cap or Company Size Performance: Year-to-date, Week and Day |  |
|
Get the most comprehensive stock market coverage daily at 12Stocks.com ➞ Best Stocks Today ➞ Best Stocks Weekly ➞ Best Stocks Year-to-Date ➞ Best Stocks Trends ➞  Best Stocks Today 12Stocks.com Best Nasdaq Stocks ➞ Best S&P 500 Stocks ➞ Best Tech Stocks ➞ Best Biotech Stocks ➞ |
| Detailed Overview of Asia Stocks |
| Asia Technical Overview, Leaders & Laggards, Top Asia ETF Funds & Detailed Asia Stocks List, Charts, Trends & More |
| Asia: Technical Analysis, Trends & YTD Performance | |
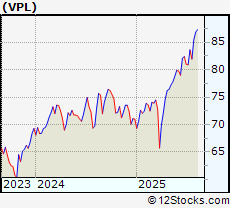
 VPL Weekly Chart |
|
| Long Term Trend: Very Good | |
| Medium Term Trend: Very Good | |
 VPL Daily Chart |
|
| Short Term Trend: Very Good | |
| Overall Trend Score: 100 | |
| YTD Performance: 21.07% | |
| **Trend Scores & Views Are Only For Educational Purposes And Not For Investing | |
| 12Stocks.com: Investing in Asia Index using Exchange Traded Funds | |
|
The following table shows list of key exchange traded funds (ETF) that
help investors play Asia stock market. For detailed view, check out our ETF Funds section of our website. Quick View: Move mouse or cursor over ETF symbol (ticker) to view short-term technical chart and over ETF name to view long term chart. Click on ticker or stock name for detailed view. Click on to add stock symbol to your watchlist and to view watchlist. |
12Stocks.com List of ETFs that track Asia Index
| Ticker | ETF Name | Watchlist | Recent Price | Market Intelligence Score | Change % | Week % | Year-to-date % |
| VPL | Pacific | | 87.25 | 100 | 1.78 | 0.48 | 21.07% |
| EEMA | Emerging Markets Asia | | 85.21 | 90 | -0.18 | -0.32 | 19.2% |
| AIA | Asia 50 | | 83.96 | 90 | -0.29 | -1.9 | 25.07% |
| AAXJ | All Country Asia | | 85.59 | 90 | -0.07 | -0.35 | 19.41% |
| GMF | Emerging Asia Pacific | | 130.85 | 100 | -0.14 | 0.09 | 13.23% |
| EPP | Pacific ex Japan | | 51.11 | 100 | 0.33 | 0.06 | 18.73% |
| ASEA | Southeast Asia | | 17.31 | 90 | -0.17 | -0.63 | 10.91% |
| DVYA | Asia/Pacific Dividend | | 41.78 | 100 | 0.69 | 0.36 | 19.96% |
| IPAC | Core Pacific | | 72.13 | 100 | -0.66 | 0.19 | 19.54% |
| FXI | China Large-Cap | | 39.24 | 100 | 2.27 | 2.35 | 23.05% |
| EWY | South Korea | | 73.5 | 70 | 3.2 | 0.15 | 36.19% |
| EWT | Taiwan | | 59.65 | 50 | 1.84 | -1.27 | 15.94% |
| EWJ | Japan | | 79.98 | 80 | 1.63 | -0.21 | 18.03% |
| EWH | Hong Kong | | 21.48 | 90 | 1.46 | 1.37 | 33% |
| EWS | Singapore | | 28.27 | 100 | 2.13 | 1.91 | 27.47% |
| EWM | Malaysia | | 25.72 | 100 | 2.1 | 2.96 | 9.82% |
| EPHE | Philippines | | 26.15 | 60 | -0.76 | -0.49 | 5.72% |
| EIDO | Indonesia | | 18.44 | 90 | -0.86 | -1.02 | 2.45% |
| THD | Thailand | | 57.19 | 90 | -0.49 | -1.09 | -3.2% |
| VNM | Vietnam | | 17.60 | 50 | -0.51 | -0.9 | 53.31% |
| 12Stocks.com: Charts, Trends, Fundamental Data and Performances of Asia Stocks | |
|
We now take in-depth look at all Asia stocks including charts, multi-period performances and overall trends (as measured by market intelligence score). One can sort Asia stocks (click link to choose) by Daily, Weekly and by Year-to-Date performances. Also, one can sort by size of the company or by market capitalization. |
| Select Your Default Chart Type: | |||||
| |||||
| Click on stock symbol or name for detailed view. Click on to add stock symbol to your watchlist and to view watchlist. Quick View: Move mouse or cursor over "Daily" to quickly view daily technical stock chart and over "Weekly" to view weekly technical stock chart. | |||||

 | DTSS Datasea Inc. |
| Sector: Industrials | |
| SubSector: Conglomerates | |
| MarketCap: 36.8848 Millions | |
| Recent Price: 1.84 Market Intelligence Score: 70 | |
| Day Percent Change: -2.76% Day Change: -0.05 | |
| Week Change: 0.98% Year-to-date Change: -19.8% | |
| DTSS Links: Profile News Message Board | |
| Charts:- Daily , Weekly | |
| Add DTSS to Watchlist: View: Get Complete DTSS Trend Analysis ➞ | |
 | EDTK Skillful Craftsman Education Technology Limited |
| Sector: Consumer Staples | |
| SubSector: Education & Training Services | |
| MarketCap: 32347 Millions | |
| Recent Price: 1.04 Market Intelligence Score: 50 | |
| Day Percent Change: 2.97% Day Change: 0.03 | |
| Week Change: 0.97% Year-to-date Change: 3.0% | |
| EDTK Links: Profile News Message Board | |
| Charts:- Daily , Weekly | |
| Add EDTK to Watchlist: View: Get Complete EDTK Trend Analysis ➞ | |
 | SFWL Shengfeng Development Limited |
| Sector: Industrials | |
| SubSector: Integrated Freight & Logistics | |
| MarketCap: 747 Millions | |
| Recent Price: 1.04 Market Intelligence Score: 59 | |
| Day Percent Change: 2.94% Day Change: 0.03 | |
| Week Change: 0.94% Year-to-date Change: -3.7% | |
| SFWL Links: Profile News Message Board | |
| Charts:- Daily , Weekly | |
| Add SFWL to Watchlist: View: Get Complete SFWL Trend Analysis ➞ | |
 | CHT Chunghwa Telecom Co., Ltd. |
| Sector: Technology | |
| SubSector: Telecom Services - Domestic | |
| MarketCap: 28101.3 Millions | |
| Recent Price: 45.50 Market Intelligence Score: 30 | |
| Day Percent Change: 0.02% Day Change: 0.01 | |
| Week Change: 0.91% Year-to-date Change: 25.3% | |
| CHT Links: Profile News Message Board | |
| Charts:- Daily , Weekly | |
| Add CHT to Watchlist: View: Get Complete CHT Trend Analysis ➞ | |
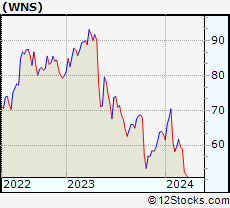 | WNS WNS (Holdings) Limited |
| Sector: Services & Goods | |
| SubSector: Business Services | |
| MarketCap: 2410.72 Millions | |
| Recent Price: 75.51 Market Intelligence Score: 70 | |
| Day Percent Change: 0.28% Day Change: 0.21 | |
| Week Change: 0.75% Year-to-date Change: 59.3% | |
| WNS Links: Profile News Message Board | |
| Charts:- Daily , Weekly | |
| Add WNS to Watchlist: View: Get Complete WNS Trend Analysis ➞ | |
 | HUYA HUYA Inc. |
| Sector: Services & Goods | |
| SubSector: Entertainment - Diversified | |
| MarketCap: 3358.17 Millions | |
| Recent Price: 3.32 Market Intelligence Score: 40 | |
| Day Percent Change: 4.08% Day Change: 0.13 | |
| Week Change: 0.61% Year-to-date Change: 85.7% | |
| HUYA Links: Profile News Message Board | |
| Charts:- Daily , Weekly | |
| Add HUYA to Watchlist: View: Get Complete HUYA Trend Analysis ➞ | |
 | YUMC Yum China Holdings, Inc. |
| Sector: Services & Goods | |
| SubSector: Restaurants | |
| MarketCap: 16284.5 Millions | |
| Recent Price: 45.09 Market Intelligence Score: 80 | |
| Day Percent Change: 1.08% Day Change: 0.48 | |
| Week Change: 0.6% Year-to-date Change: -5.4% | |
| YUMC Links: Profile News Message Board | |
| Charts:- Daily , Weekly | |
| Add YUMC to Watchlist: View: Get Complete YUMC Trend Analysis ➞ | |
 | JD JD.com, Inc. |
| Sector: Technology | |
| SubSector: Internet Information Providers | |
| MarketCap: 59907.3 Millions | |
| Recent Price: 31.88 Market Intelligence Score: 60 | |
| Day Percent Change: 2.25% Day Change: 0.7 | |
| Week Change: 0.57% Year-to-date Change: -19.5% | |
| JD Links: Profile News Message Board | |
| Charts:- Daily , Weekly | |
| Add JD to Watchlist: View: Get Complete JD Trend Analysis ➞ | |
 | GDS GDS Holdings Limited |
| Sector: Technology | |
| SubSector: Data Storage Devices | |
| MarketCap: 8597.99 Millions | |
| Recent Price: 32.00 Market Intelligence Score: 60 | |
| Day Percent Change: -5.6% Day Change: -1.9 | |
| Week Change: 0.5% Year-to-date Change: 34.7% | |
| GDS Links: Profile News Message Board | |
| Charts:- Daily , Weekly | |
| Add GDS to Watchlist: View: Get Complete GDS Trend Analysis ➞ | |
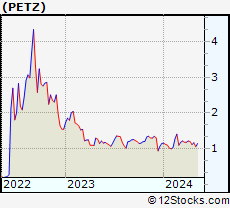 | PETZ TDH Holdings, Inc. |
| Sector: Consumer Staples | |
| SubSector: Processed & Packaged Goods | |
| MarketCap: 12.3748 Millions | |
| Recent Price: 0.98 Market Intelligence Score: 30 | |
| Day Percent Change: -2.48% Day Change: -0.03 | |
| Week Change: 0.4% Year-to-date Change: -21.2% | |
| PETZ Links: Profile News Message Board | |
| Charts:- Daily , Weekly | |
| Add PETZ to Watchlist: View: Get Complete PETZ Trend Analysis ➞ | |
 | CBAT CBAK Energy Technology, Inc. |
| Sector: Health Care | |
| SubSector: Medical Laboratories & Research | |
| MarketCap: 22.43 Millions | |
| Recent Price: 0.99 Market Intelligence Score: 40 | |
| Day Percent Change: 1.12% Day Change: 0.01 | |
| Week Change: 0.23% Year-to-date Change: 5.3% | |
| CBAT Links: Profile News Message Board | |
| Charts:- Daily , Weekly | |
| Add CBAT to Watchlist: View: Get Complete CBAT Trend Analysis ➞ | |
 | BIDU Baidu, Inc. |
| Sector: Technology | |
| SubSector: Internet Information Providers | |
| MarketCap: 33525.9 Millions | |
| Recent Price: 90.01 Market Intelligence Score: 80 | |
| Day Percent Change: 2.74% Day Change: 2.4 | |
| Week Change: 0.18% Year-to-date Change: -0.7% | |
| BIDU Links: Profile News Message Board | |
| Charts:- Daily , Weekly | |
| Add BIDU to Watchlist: View: Get Complete BIDU Trend Analysis ➞ | |
 | JFIN Jiayin Group Inc. |
| Sector: Technology | |
| SubSector: Internet Information Providers | |
| MarketCap: 131.48 Millions | |
| Recent Price: 13.28 Market Intelligence Score: 70 | |
| Day Percent Change: 8.41% Day Change: 1.03 | |
| Week Change: 0.15% Year-to-date Change: 118.3% | |
| JFIN Links: Profile News Message Board | |
| Charts:- Daily , Weekly | |
| Add JFIN to Watchlist: View: Get Complete JFIN Trend Analysis ➞ | |
 | ATAT Atour Lifestyle Holdings Limited |
| Sector: Services & Goods | |
| SubSector: Lodging | |
| MarketCap: 2120 Millions | |
| Recent Price: 34.49 Market Intelligence Score: 51 | |
| Day Percent Change: 1.56% Day Change: 0.53 | |
| Week Change: 0.03% Year-to-date Change: 30.0% | |
| ATAT Links: Profile News Message Board | |
| Charts:- Daily , Weekly | |
| Add ATAT to Watchlist: View: Get Complete ATAT Trend Analysis ➞ | |
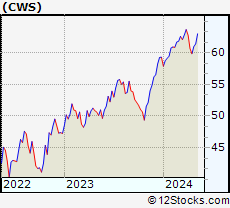 | CWS AdvisorShares Focused Equity ETF |
| Sector: Utilities | |
| SubSector: Exchange Traded Fund | |
| MarketCap: 0 Millions | |
| Recent Price: 68.74 Market Intelligence Score: 80 | |
| Day Percent Change: -0.29% Day Change: -0.2 | |
| Week Change: 0.02% Year-to-date Change: 6.1% | |
| CWS Links: Profile News Message Board | |
| Charts:- Daily , Weekly | |
| Add CWS to Watchlist: View: Get Complete CWS Trend Analysis ➞ | |
 | CALI China Auto Logistics Inc. |
| Sector: Services & Goods | |
| SubSector: Auto Dealerships | |
| MarketCap: 6.86 Millions | |
| Recent Price: 50.54 Market Intelligence Score: 70 | |
| Day Percent Change: -0.02% Day Change: -0.01 | |
| Week Change: 0.01% Year-to-date Change: 2.1% | |
| CALI Links: Profile News Message Board | |
| Charts:- Daily , Weekly | |
| Add CALI to Watchlist: View: Get Complete CALI Trend Analysis ➞ | |
 | IH iHuman Inc. |
| Sector: Consumer Staples | |
| SubSector: Education & Training Services | |
| MarketCap: 12247 Millions | |
| Recent Price: 2.75 Market Intelligence Score: 40 | |
| Day Percent Change: 3.77% Day Change: 0.1 | |
| Week Change: 0% Year-to-date Change: 71.6% | |
| IH Links: Profile News Message Board | |
| Charts:- Daily , Weekly | |
| Add IH to Watchlist: View: Get Complete IH Trend Analysis ➞ | |
 | PERF Perfect Corp. |
| Sector: Technology | |
| SubSector: Software - Application | |
| MarketCap: 582 Millions | |
| Recent Price: 1.90 Market Intelligence Score: 40 | |
| Day Percent Change: -1.04% Day Change: -0.02 | |
| Week Change: 0% Year-to-date Change: -32.9% | |
| PERF Links: Profile News Message Board | |
| Charts:- Daily , Weekly | |
| Add PERF to Watchlist: View: Get Complete PERF Trend Analysis ➞ | |
 | UTSI UTStarcom Holdings Corp. |
| Sector: Technology | |
| SubSector: Communication Equipment | |
| MarketCap: 76.6539 Millions | |
| Recent Price: 2.40 Market Intelligence Score: 0 | |
| Day Percent Change: 0% Day Change: -9996.6 | |
| Week Change: 0% Year-to-date Change: -17.2% | |
| UTSI Links: Profile News Message Board | |
| Charts:- Daily , Weekly | |
| Add UTSI to Watchlist: View: Get Complete UTSI Trend Analysis ➞ | |
 | HIMX Himax Technologies, Inc. |
| Sector: Technology | |
| SubSector: Semiconductor - Specialized | |
| MarketCap: 496.16 Millions | |
| Recent Price: 7.50 Market Intelligence Score: 50 | |
| Day Percent Change: 0.13% Day Change: 0.01 | |
| Week Change: 0% Year-to-date Change: -2.9% | |
| HIMX Links: Profile News Message Board | |
| Charts:- Daily , Weekly | |
| Add HIMX to Watchlist: View: Get Complete HIMX Trend Analysis ➞ | |
 | TOP TOP Financial Group Limited |
| Sector: Financials | |
| SubSector: Capital Markets | |
| MarketCap: 329 Millions | |
| Recent Price: 1.17 Market Intelligence Score: 43 | |
| Day Percent Change: 0.91% Day Change: 0.01 | |
| Week Change: -0.07% Year-to-date Change: -23.5% | |
| TOP Links: Profile News Message Board | |
| Charts:- Daily , Weekly | |
| Add TOP to Watchlist: View: Get Complete TOP Trend Analysis ➞ | |
 | OCFT OneConnect Financial Technology Co., Ltd. |
| Sector: Technology | |
| SubSector: Software Application | |
| MarketCap: 80387 Millions | |
| Recent Price: 7.42 Market Intelligence Score: 50 | |
| Day Percent Change: 1.09% Day Change: 0.08 | |
| Week Change: -0.13% Year-to-date Change: 205.4% | |
| OCFT Links: Profile News Message Board | |
| Charts:- Daily , Weekly | |
| Add OCFT to Watchlist: View: Get Complete OCFT Trend Analysis ➞ | |
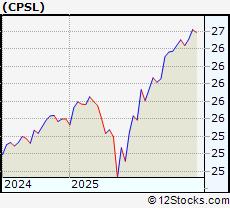 | CPSL China Precision Steel, Inc. |
| Sector: Materials | |
| SubSector: Steel & Iron | |
| MarketCap: 0 Millions | |
| Recent Price: 26.59 Market Intelligence Score: 80 | |
| Day Percent Change: 0.02% Day Change: 0.01 | |
| Week Change: -0.16% Year-to-date Change: 4.0% | |
| CPSL Links: Profile News Message Board | |
| Charts:- Daily , Weekly | |
| Add CPSL to Watchlist: View: Get Complete CPSL Trend Analysis ➞ | |
 | SOHU Sohu.com Limited |
| Sector: Technology | |
| SubSector: Internet Information Providers | |
| MarketCap: 243.48 Millions | |
| Recent Price: 15.53 Market Intelligence Score: 70 | |
| Day Percent Change: 1.77% Day Change: 0.27 | |
| Week Change: -0.19% Year-to-date Change: 17.8% | |
| SOHU Links: Profile News Message Board | |
| Charts:- Daily , Weekly | |
| Add SOHU to Watchlist: View: Get Complete SOHU Trend Analysis ➞ | |
 | BILI Bilibili Inc. |
| Sector: Technology | |
| SubSector: Internet Information Providers | |
| MarketCap: 7043.1 Millions | |
| Recent Price: 23.76 Market Intelligence Score: 40 | |
| Day Percent Change: -6.11% Day Change: -1.54 | |
| Week Change: -0.25% Year-to-date Change: 31.2% | |
| BILI Links: Profile News Message Board | |
| Charts:- Daily , Weekly | |
| Add BILI to Watchlist: View: Get Complete BILI Trend Analysis ➞ | |
| To view more stocks, click on Next / Previous arrows or select different range: 0 - 25 , 25 - 50 , 50 - 75 , 75 - 100 , 100 - 125 , 125 - 150 , 150 - 175 , 175 - 200 | ||
| Click To Change The Sort Order: By Market Cap or Company Size Performance: Year-to-date, Week and Day | |
| Select Chart Type: | ||
|
Best Stocks Today 12Stocks.com |
© 2025 12Stocks.com Terms & Conditions Privacy Contact Us
All Information Provided Only For Education And Not To Be Used For Investing or Trading. See Terms & Conditions


One More Thing ... Get Best Stocks Delivered Daily!
Never Ever Miss A Move With Our Top Ten Stocks Lists
Find Best Stocks In Any Market - Bull or Bear Market
Take A Peek At Our Top Ten Stocks Lists: Daily, Weekly, Year-to-Date & Top Trends
Find Best Stocks In Any Market - Bull or Bear Market
Take A Peek At Our Top Ten Stocks Lists: Daily, Weekly, Year-to-Date & Top Trends
Asia Stocks With Best Up Trends [0-bearish to 100-bullish]: XPeng [100], NIO [100], MINISO [100], Pinduoduo [100], Huazhu [100], iQIYI [100], Melco Resorts[100], Toyota Motor[100], ORIX [100], Honda Motor[100], Full Truck[90]
Best Asia Stocks Year-to-Date:
Regencell Bioscience[9561.54%], I Mab[454.12%], So-Young [384.74%], QuantaSing [269.91%], Xunlei [264.32%], OneConnect Financial[205.35%], Sify [187.76%], Niu [159.78%], Viomi [154.48%], Yatsen Holding[141.21%], Tencent Music[120.18%] Best Asia Stocks This Week:
Xunlei [43.56%], Burning Rock[41.87%], NIO [24.49%], iQIYI [23.04%], Zhihu [18.1%], XPeng [17.39%], Smart Share[14.53%], Cheetah Mobile[13.59%], MINISO [13.58%], QuantaSing [13.01%], Full Truck[12.26%] Best Asia Stocks Daily:
X Financial[15.73%], XPeng [11.68%], Full Truck[9.81%], Viomi [9.39%], NIO [9.27%], CNFinance [7.77%], Lixiang Education[7.32%], Kanzhun [6.61%], MINISO [6.38%], Burning Rock[6.02%], FinVolution [5.55%]